IPCA Labs – Trend Reversal After Long ConsolidationNSE:IPCALAB has successfully transitioned from a downtrend into a bullish structure after months of sideways consolidation. The breakout above the falling trendline followed by a controlled pullback suggests accumulation.
As long as price holds above ₹1450, the trend remains positive and a fresh breakout above ₹1500 can open the door for further upside.
Trendreversalpattern

EURAUD Bearish SetupIf we look at H4 chart of ICMARKETS:EURAUD , it made a great reversal and formed a bearish Engulf at 70% Fib Level.
The H4 timeframe is forming a slid rationality to be bearish on H1 timeframe. The targets may take a week or so to hit while the SL may hit within a few days.
On H1 timeframe the MACD showed overboughtness and the price is probably to change its trend from Bullish to bearish.
the MACD divergence is second by Lower High formation indicating a bearish signal.
Now we need a confirmation for the price to cross the HIgher Low at 1.7795.
I will place a sell stop order 1.7793 with my SL at the Higher High at 1.7863
I will take two positions both at the breakout Higher Low at 1.7793. Both position has 2% risk in total with the stop loss at 1.7863
Note: The Sell stop order is a must. If its not triggered then we are not aiming for any other trade.
Important: If TP1 Hit, we will move our SL to Break even to trade the rest 2.5x reward with 0 risk.
Position 1 with 1 % Risk
Sell Stop: 1.7793
Stop Loss: 1.7863
TP: 1.7723
Position 1 with 1 % Risk
Sell Stop: 1.7793
Stop Loss: 1.7863
TP: 1.7615

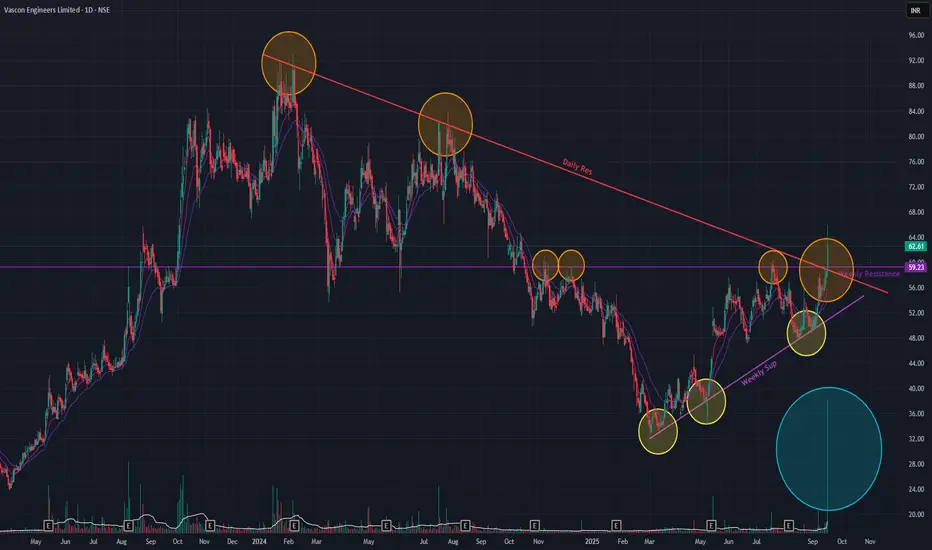
Vascon Eng (Daily Timeframe) - Is this the trend reversal ?Vascon is showing strong indications of a major trend reversal. After forming a series of higher lows since March 2025, the stock has now broken out of a clear Inverted Head & Shoulder pattern on the weekly timeframe.
The breakout is particularly significant as it occurred at a confluence of two major resistance zones: a long-term horizontal trendline dating back to February 2012 and the more recent descending trendline from January 2024. This bullish move was accompanied by a +7.06% surge on high volume and is supported by a positive crossover in the short-term EMAs.
If the bullish momentum continues, the next potential target is the 86 level . Conversely, a failure to sustain the breakout could see the price retrace to support around the 46 level .
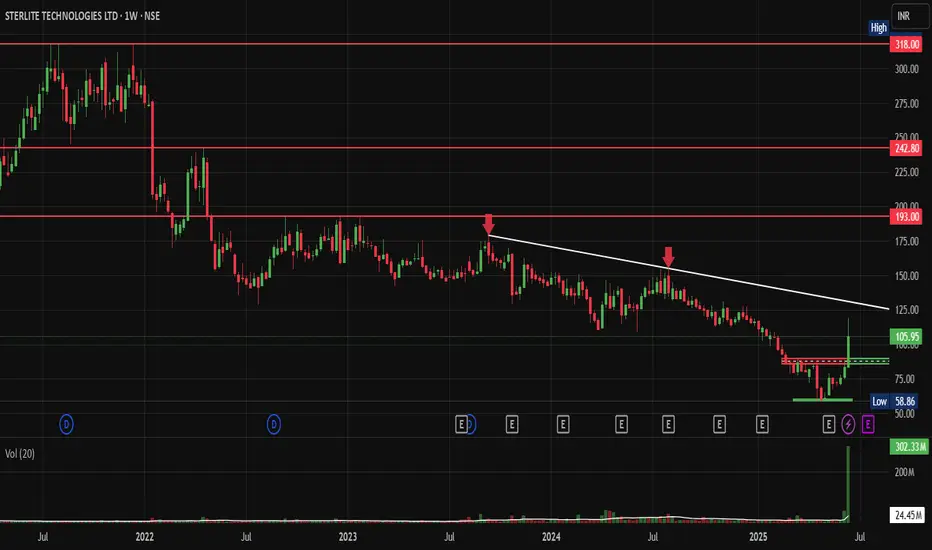
Sterlite Tech: From Despair to Breakout – A Textbook Turnaround NSE:STLTECH : From Despair to Breakout – A Textbook Turnaround Story in the Making. It makes it to my chart of the week Idea after breaking out with good volumes.
Price Action Analysis:
-Recent Action: Strong green candle with significant body suggesting institutional accumulation
-Candle Structure: Minimal upper shadow indicates buying pressure throughout the session
-Previous Action: Series of consolidation candles around ₹85-95 showing accumulation phase
-Breakout Candle: Wide-range bar breaking above downtrend resistance with conviction
Price Swing Analysis:
-Higher Highs/Higher Lows: Recent price action shows initial signs of trend reversal
-Momentum Shift: Price moving from range-bound to trending behaviour
-Gap Analysis: No significant gaps visible, suggesting organic price discovery
Volume Spread Analysis (VSA):
Current Weekly Bar Analysis:
-Volume: 302.33M (Exceptionally high - 12x average volume)
-Spread: Wide range bar with substantial price movement
-Close Position: Closing in the upper 75% of the range
-VSA Interpretation: Professional Money Accumulation - High volume with wide spread and strong close
Volume-Price Relationship Breakdown:
Phase 1 (2022-2023): Distribution & Selling Climax
-High volume on down bars during the initial decline
-Volume spikes coinciding with major price drops
-Classic distribution pattern with professional selling
Phase 2 (2023-2024): Accumulation Phase
-No Supply Bars: Low volume on down bars indicates selling exhaustion
-Testing for Supply: Multiple tests of the ₹50-60 zone with reducing volume
-Background Volume: Consistently low volume, suggesting minimal selling pressure
Phase 3 (Late 2024-2025): Mark-up Beginning
-Effort vs Result: Increasing volume with improving price action
-Spring Action: False break below support, followed by quick recovery
-Current Bar: Classic "Upthrust After Accumulation" with massive volume
Volume Spread Analysis Summary:
Key VSA Signals Identified:
-Selling Climax: Evident in 2022 with high volume and wide down bars
-No Supply: Consistent pattern during 2023-2024 base formation
-Spring/Shakeout: Brief dip below ₹58 with immediate recovery
-Effort to Rise: Current massive volume surge on breakout attempt
-Professional Interest: Volume pattern suggests smart money accumulation
Chart Structure Breakdown:
-Base Formation: Classic Multi-Year Cup Base spanning approximately 3 years (2022-2025)
-Base Duration & Depth: 36+ months with a devastating 85% decline from peak (₹318 to ₹50 lows)
Volume Characteristics:
- Volume dried up significantly during the base formation phase
- Massive volume surge (302.33M vs 24.45M average) accompanying the recent breakout attempt
- Classic accumulation pattern with low volume during decline and high volume on breakout
Key Levels:
Support Levels:
- Primary Support: ₹58-60 (recent low and base formation floor)
- Secondary Support: ₹75-80 (previous resistance turned support)
Resistance Levels:
- Immediate Resistance: ₹125-130 (downtrend line resistance)
- Major Resistance: ₹193-200 (previous significant level)
- Ultimate Resistance: ₹242-250 (prior consolidation zone)
- Breakout Zone: ₹108-112 (current breakout level with volume confirmation)
Price Patterns:
-Primary Pattern: Multi-year Cup Base with potential Handle formation
-Current Action: Breakout from 3-year downtrend line with explosive volume
-Volume Confirmation: 12x volume surge validates the breakout authenticity
-Pattern Reliability: High probability setup given the extended base duration and volume characteristics
Trade Setup:
Entry Strategy:
Primary Entry: ₹110-112 on sustained breakout with volume above 50M
Add-on Entry: ₹115-118 on momentum continuation or successful retest of breakout zone
Early Entry: ₹105-107 for aggressive traders betting on breakout confirmation
Exit Strategy:
Initial Target: ₹140-145 (measured move from base depth)
Secondary Target: ₹175-180 (intermediate resistance zone)
Ultimate Target: ₹200+ (major resistance retest)
Trail SL: Use a 20% trailing stop once the initial target is achieved
Stop-Loss and Risk Management:
Ideal Stop-Loss: ₹95-98 (below breakout zone invalidation)
Conservative SL: ₹88-90 (below recent swing low with buffer)
Position Sizing: Risk 1.5-2% of portfolio capital given the high-conviction setup
Risk-Reward: Attractive 1:3 to 1:4 ratio to initial targets
Sectoral and Fundamental Backdrop:
Sector Outlook:
Sector: Telecom Infrastructure & Optical Fiber - benefiting from 5G rollout momentum
Relative Strength: Telecom capex cycle turning positive with the government's digital infrastructure push
Peer Performance: Optical fiber and telecom equipment stocks showing renewed interest
Stock Fundamentals:
Business Turnaround: The Company has been restructuring operations and reducing its debt burden
Growth Catalyst: 5G infrastructure deployment and the government's Digital India initiatives provide tailwinds
Financial Health: Improving operational efficiency, though still in recovery phase
Technical-Fundamental Alignment: Multi-year base formation coincides with business restructuring completion
Overall Trade Summary:
Reward-to-Risk Ratio: 3.5:1 to initial target, extending to 5:1+ for swing targets
Conviction Level: High- Textbook cup base with volume confirmation.
Ideal Trader Profile:
- Swing Traders: 4-8 week holding period for initial targets
- Positional Traders: 6-12 month horizon for major resistance retest
- Momentum Players: Quick 15-20% moves on breakout continuation
Key Insight: "After 3 years of pain, Sterlite Tech is displaying all the hallmarks of a classic turnaround story - the kind that can deliver multi-bagger returns for patient capital."
Key VSA Insight: "The 12x volume surge represents the moment when smart money stops accumulating and starts marking up - a classic VSA signal for trend initiation."
My Take:
Trade Thesis: This represents a high-probability, low-risk entry into a fundamentally improving story at a technically optimal juncture. The combination of multi-year base, volume breakout, and sector tailwinds creates a compelling risk-adjusted opportunity.
Keep in the Watchlist.
NO RECO. For Buy/Sell.
📌Thank you for exploring my idea! I hope you found it valuable.
🙏FOLLOW for more
👍BOOST if you found it useful.
✍️COMMENT below with your views.
Meanwhile, check out my other stock ideas on the right side until this trade is activated. I would love your feedback.
Disclaimer: "I am not a SEBI REGISTERED RESEARCH ANALYST AND INVESTMENT ADVISER."
This analysis is intended solely for informational and educational purposes and should not be interpreted as financial advice. It is advisable to consult a qualified financial advisor or conduct thorough research before making investment decisions.
Thomas Cook - Early Trend Reversal SignalsNSE:THOMASCOOK Made Beautiful Chart Structure today Before Q4 Results with Good Price and Volume action.
Price Action and Base Formation Analysis:
Consolidation Base:
The stock has formed a critical consolidation base in the ₹130-140 zone:
1. Base Characteristics:
- Horizontal support zone marked in green
- Multiple tests of this zone (4-5 clear touch points)
- Tight price compression indicates potential energy buildup
2. Breakout Dynamics:
- Today's 13.91% surge represents a decisive breakout from the consolidation zone
- Penetration above ₹140 with strong momentum suggests a potential trend change
- The red arrow indicates the resistance level that might be overcome.
Volume Analysis:
Volume provides crucial insights into the price action:
- Today's volume at 2.46M shares is more than 2x the 20-day average
- Significant volume spikes are visible in February and March
- Recent volume pattern shows increasing participation
- Volume expansion coincides with today's breakout, confirming buying interest
Support and Resistance Levels:
Key Resistance Levels:
1. Immediate Resistance: ₹148-150 (recent swing high)
2. Major Resistance: ₹160-165 (previous structural resistance)
3. Psychological Resistance: ₹150 (round number)
Key Support Levels:
1. New Support: ₹130-140 (previous consolidation zone)
2. Secondary Support: ₹125 (lower boundary of recent base)
3. Strong Support: ₹118-120 (52-week low area)
Technical Pattern:
Several important patterns are evident:
1. Accumulation Base: The ₹130-140 zone represents a classic accumulation pattern
- Tight trading range
- Multiple support tests
- Decreasing volatility
2. Trend Reversal Signals:
- Higher lows forming since February
- Decreasing downward momentum
- Breakout with strong volume
My Take:
The combination of:
- Decisive breakout from a multi-month base
- Substantial volume confirmation
- Clear momentum shift
Suggests NSE:THOMASCOOK could be transitioning to a bullish trend Post Q4.
Price Projection:
1. Near-term Target: ₹160-165
2. Intermediate Target: ₹180-190
3. Long-term Potential: Retest of previous highs near ₹200
Critical Watch Points:
- Ability to sustain above ₹140
- Volume confirmation in subsequent sessions
- Holding the breakout without immediate retracement
Keep in the Watchlist.
NO RECO. For Buy/Sell.
📌Thank you for exploring my idea! I hope you found it valuable.
🙏FLLOW for more
👍BOOST if useful
✍️COMMENT below with your views.
Meanwhile, check out my other stock ideas on the right side until this trade is activated. I would love your feedback.
Disclaimer: "I am not SEBI REGISTERED RESEARCH ANALYST AND INVESTMENT ADVISER."
This analysis is intended solely for informational and educational purposes and should not be interpreted as financial advice. It is advisable to consult a qualified financial advisor or conduct thorough research before making investment decisions.

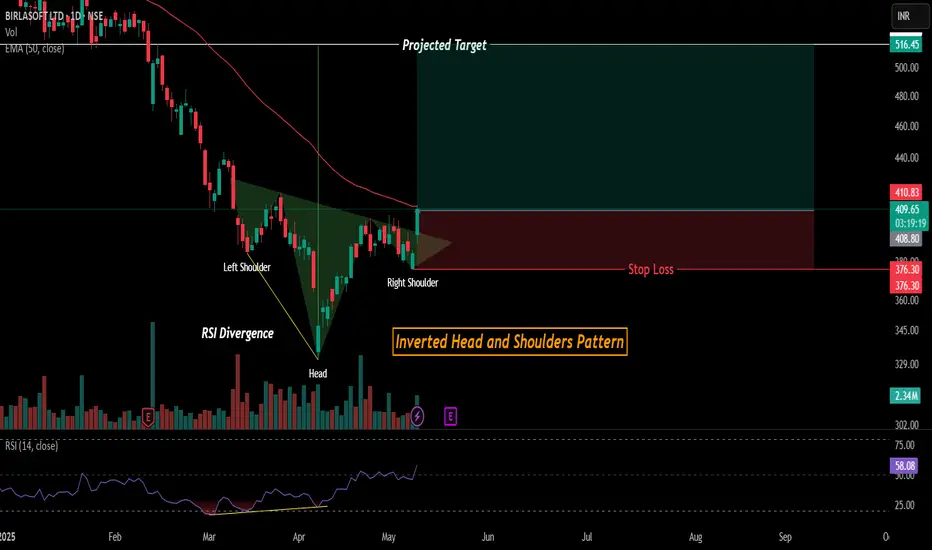
Trend Reversal setup in BSOFT(Inverted H&S Pattern)!Birlasoft (NSE:BSOFT) – Bullish Reversal on Inverted Head & Shoulders
📌 Technical Pattern: A classic Inverted Head and Shoulders pattern is forming, suggesting a potential reversal from the recent downtrend.
✅ Key Highlights:
RSI Divergence at the head hints at waning bearish momentum and potential reversal.
Price is testing the neckline zone; a breakout could confirm the bullish setup.
50-period EMA (~₹452) remains overhead, acting as a dynamic resistance.
📈 Target: ~₹516, calculated from the pattern height.
🔻 Stop Loss: Near ₹376, just below the right shoulder structure.
🧠 Strategy Note: A sustained close above the neckline, preferably on volume, can offer a strong risk-reward trade setup. RSI currently at 58 supports bullish momentum continuation.
Disclaimer: Consider my analysis for educational purposes only.
Before entering any trade:
1️⃣ Educate Yourself – Understand market dynamics and technical patterns.
2️⃣ Do Your Own Research & Analysis – Never rely solely on external opinions.
3️⃣ Define Your Risk-Reward Ratio – Ensure your trade aligns with your risk appetite.
4️⃣ Never Trade with Full Capital – Always manage risk and preserve capital.
Trade wisely! ✅📊
Trend Reversal setup in HCLTECH(Inverted H&S Pattern)!HCL Technologies (NSE:HCLTECH) – Bullish Reversal Setup
📌 Pattern Identified: A clear Inverted Head and Shoulders formation is visible on the daily chart, indicating a potential bullish reversal.
✅ Key Observations:
Price has broken above the neckline and also crossed the 50-period EMA, showing strength.
Notable volume buildup at the right shoulder, supporting the bullish move.
RSI is above 60, suggesting improving momentum.
📈 Projected Target: ~₹2,074 based on the pattern's height.
🔻 Stop Loss: Placed slightly below the right shoulder near ₹1,537.
⚠️ Watch Levels:
₹1,696: Minor resistance.
₹1,780: Key resistance level before the target zone.
📝 Conclusion: A breakout above the neckline with volume confirms the bullish pattern. As long as the price sustains above the stop loss, the risk-reward appears favorable.
Disclaimer: Consider my analysis for educational purposes only.
Before entering any trade:
1️⃣ Educate Yourself – Understand market dynamics and technical patterns.
2️⃣ Do Your Own Research & Analysis – Never rely solely on external opinions.
3️⃣ Define Your Risk-Reward Ratio – Ensure your trade aligns with your risk appetite.
4️⃣ Never Trade with Full Capital – Always manage risk and preserve capital.
Trade wisely! ✅📊

PCBL Daily Chart- LONGHere’s a detailed analysis of PCBL on Daily Chart
1. Trendline
A downward sloping trendline is drawn from previous swing highs, indicating a resistance zone. The recent price action shows that the stock has broken above this trendline with strong momentum, suggesting a potential trend reversal or breakout.
2. Volume
The chart highlights rising volumes as the price breaks out of the trendline. Increasing volume during a breakout adds strength to the move, confirming that buyers are stepping in.
3.Price Pattern
A Triple Double Bottom pattern is visible at the bottom, marked by three distinct touches at the same support level. A triple bottom is a bullish reversal pattern, and the breakout above the trendline validates the pattern, indicating a potential upward move.
4. 20 EMA (Exponential Moving Average)
The price is trading above the 20 EMA, which shows short-term bullish momentum. Sustained trading above this level confirms that the stock is in an uptrend.
5.Suggested Trade Setup:
Entry: After a retest of the trendline around ₹400–405 or on a continuation above the breakout candle high of ₹419.40.
Stop Loss (SL): Below the recent swing low or the 20 EMA, around ₹385.
Target: First target: ₹450 (psychological level and prior resistance).
Second target: ₹475 (previous supply zone).
Educational Disclaimer:
This analysis is for educational purposes only and should not be considered financial advice. Please conduct your own research or consult a professional advisor before making any trading decisions.

Nifty 50. The Doji Candle.Nifty is making Doji at the bottom on weekly chart. Which shows the chances of trend reversal. If Nifty close above 23391 (current week high) then Down trend will be end and reversal process will start in market. For confirmation, the complete week should be close above 23391 for the All time high target (26272).
If Study RSI, Rsi is near 60 on monthly chart which can act as a support and at 40 on weekly chart which is again a support area. If Daily RSI will cross 40 then Market can be bullish again.
And If 23050 broken then It will open the gate of 21500 down side.

NIFTY DAILY - 4/3/2024Index open with positive note and made all time high that is 22440.
Index has formed Doji candle on the daily chart at the top of the market which indicates thug of war between buyers and sellers as the closing was near the opening levels.
We may see trend reversal in near future.
Next levels for nifty will be 22520 upsides and 22303 level downsides.
⚠️ Important: Always maintain your Risk & Reward Ratio.
✅Like and follow to never miss a new idea!✅
Disclaimer: I am not SEBI Registered Advisor. My posts are purely for training and educational purposes.
Eat🍜 Sleep😴 TradingView📈 Repeat 🔁
Happy learning with trading. Cheers!🥂

Andra Papers - Trend reversalFundamentals,
1. Operating Profit are improving
2. Piotroski score 9
3. Net profit TTM is high in Industry
4. Stock with Low PE
Technical
1. Tweezer Bottom
2. Price action supportes by previous resistance & 200 ema
3. Price structure - Consolidation (basing), trend reversal
4. Momentum is expected
Entry : 565 (50%) , 595 ( 50%)
SL: 540

NIFTY DAILY - 21/2/2024Market falls from nifty’s new all-time high that is 22249 level and Bulls lose its winning streak in the market.
Nifty formed shaven head candle on the daily chart which indicates participants are selling from higher level.
Nifty has formed Bearish Engulfing Pattern on daily chart which indicates trend reversal.
We may see further weakness in market.
Nearest support will be 21986 level with resistance of 22381 level.
⚠️ Important: Always maintain your Risk & Reward Ratio.
✅Like and follow to never miss a new idea!✅
Disclaimer: I am not SEBI Registered Advisor. My posts are purely for training and educational purposes.
Eat🍜 Sleep😴 TradingView📈 Repeat 🔁
Happy learning with trading. Cheers!🥂

SAREGAMA looks good for investment for medium to long termThe recent price action of this asset has signaled a significant shift in market sentiment. After a prolonged downtrend, it exhibited a notable uptick in buying interest, successfully breaching the previous lower high of the downtrend. This breakout strongly suggests the initiation of a potential trend reversal.
In addition to the promising technical indicators, the company's fundamentals also appear robust. It has demonstrated impressive growth in annual net profits, and the current-year profits have already surpassed the previous year's figures, showcasing a noteworthy performance that underscores its strong financial health and growth prospects.

IRCTC Analysis (Head and Shoulders)! NSE:IRCTC ANALYSIS!
IRCTC Analysis on a daily Timeframe!
Descending Triangle Pattern Formation, Breakout and Retesting on a Weekly Timeframe!
Inverted Head and Shoulder Pattern Formation, Breakout and Retesting on a Daily Timeframe!
Bullish RSI Divergence in IRCTC!
Trend Reversal in IRCTC!
IRCTC has made Descending Triangle Pattern on weekly Timeframe , and it has given a breakout to its resistance trendline and retested its support level. If we reduce timeframe to Daily timeframe, then we can see the clear INVERTED HEAD AND SHOULDERS PATTERN at the bottom. We can see previous trend is Downtrend. If we combine RSI analysis with it, then we can see a Bullish RSI Divergence. After the bullish divergence the trend has been changed from Downtrend to an Uptrend. After that RSI and Price both are trending Upwards. This is a clear indication of the bullishness. I have extended neckline and support trendline both may act as a Support Trendlines.
Rest of all Analysis is on the chart itself and I have marked all the important levels with price do study thoroughly.
Thank You!
Important Note= Please have a look on my previous IRCTC Analysis which is based on Weekly Analysis.
Entry = Current levels are considered to be a good buy.
Stop Loss = Below 615.50
Targets = 1) 661.50 2) 66490 3) 711.55
Disclaimer = All my analysis is for Educational Purpose only. Before entering into any trade - 1) Educate Yourself 2) Do your own research and analysis 3) Define your Risk to Reward ratio 4) Don't trade with full capital

Sequent longSequent is looking attractive at this level and showing signs of a trend reversal from downside to upside. Keep a close watch and try to catch the move with your Swing trending set-up.
Disclaimer - I am not a SEBI-registered technical analyst and advisor so contact your financial advisor and make a self-decision. I will not be responsible for any profit and loss

GUJARATPOLY Analysis(H&S Pattern)! BSE:GUJARATPOLY Analysis!
Inverted Head and Shoulders Pattern Formation in GUJARATPOLY on Daily Timeframe!
Inverted Head and Shoulders Pattern Breakout in GUJARATPOLY!
Trend Reversal in GUJARATPOLY!
GUJARATPOLY has made INVERTED HEAD AND SHOULDERS PATTERN on a daily timeframe. We can see the price was moving in Falling Parallel Channel . Price has given breakout to the channel on 11 May but it hasn't sustained so we can considered it as a Fakeout . Again prive has given breakout to the channel on 29 May and it has sustained. Also given breakout to the Neackline but we have experienced a selling pressure around it's necklevel.
Entry = Aggressive investors can buy at current levels, Conservative investors can wait for small retest.
Stop Loss = Below 37.40
Targets = 1) 49.70 2) 56.99 3) 65.01
Disclaimer = All my analysis are for Educational Purpose only. Before entering into any trade - 1) Educate Yourself 2) Do your own research and analysis 3) Define your Risk to Reward ratio 4) Don't trade with full capital

SKFINDIASKFINDIA:- The stock has broken its lower high lower low pattern and has also given a breakout of the trendline at 4372.50. If the price sustains then we may see upside movement. Keep an eye on the stock.
Hello traders,
As always, simple and neat charts so everyone can understand and not make it too complicated.
rest details mentioned in the chart.
will be posting more such ideas like this. Until that, like share and follow :)
check my other ideas to get to know about all the successful trades based on price action.
Thanks,
Ajay.
keep learning and keep earning.

POSSIBLE TREND REVERSAL IN CAMS!! (BUYING opportunity)Trend reversal can be seen in the charts of CAMS (Computer age management services ltd) on daily time frame.
It has taken support from the levels of 2000-2170 multiple times
this could be a great opportunity for accumulating the shares of CAMS
start long positions in this scrip if it sustains above the levels of 2170
If it breaks the support levels then further downside can be seen

IEX inverted head and shoulderPerfect inverted head and shoulder
Volumes high
Signs of trend reversal
Can bounce higher after a breakout of 148
Stay tunes!

BAJAJCON - trend reversal spottedReversal spotted
Inverted head and shoulder breakout
Wait for a breakout about 168 which is 200ema
For targets of 180/200/220

JUBILANT PHARMJUBILANT PHARMOVA
Broken long term trendline (18 months old)
200 EMA around 410, a breakout above it
can be the trend reversal
Volumes increasing after results
RSI strong
STAY TUNED!!!

Eurchf long analysis Eurchf buy @ 0.98143
Stop loss 0.97343
Target one 0.99143
Target two 1.00143
Trading idea based on pure price action and trend reversel i am seeing over here so i am opening a buy
If you like my idea please follow me and support me🙏

GODREJCP ready to move upThis stock has been in a downtrend. Few days earlier, it has broken out of trend reversal double bottom pattern. Also retested the the neckline couple of times. In fact, both the times, it went below neckline and again came up with a huge volume. This clearly suggest that strong buyers are standing below that level. The stock is consolidating near it's downward sloping trendline. After watching the huge volume near double bottom pattern, one can easily guess that this stock is getting ready to break that trendline and move higher. Swing traders must add this stock in watchlist.
