REC LTD chart analysis for swing tradeREC LTD chart analysis for swing trade (15 min)
Entry & exits are given on chart.
only for learning, trade at your own risk.
Trendtrading

IDFC chart analysis for swing trade IDFC chart analysis for swing trade (15 min)
Entry & exits are given on chart.
only for learning, trade at your own risk.

ITC chart analysis for swing trading ITC chart analysis for swing trading (15 min timeframe)
Entry & exits are given on chart.
only for learning, trade at your own risk.

Sale tradebased on RSI Divergence theory
looking for a fall in this script
for targets 2450
stop as per comfort
disclaimer - for study purpose only

Welspun enterprises chart analysis> Forming an inverted H&S pattern
> breakout above 110 , price may go up to 150. as per classical chart pattern target.
> only for learning, trade at your own risk.

Saksoft Inverted Head & Shoulder Possible BreakoutTaking support at Monthly EMA21 & Pivot
Saksoft Inverted Head & Shoulder Possible Breakout
Long position with Stoploss below 820

ZEE TVZEE TV as the price is getting rejected at 61.8 of Fibancci Ration with Spinning Top price below 230 can be look for short .
Disclaimer :- I am not SEBI Registered Analyst kindly consult your Financial before taking any trading Decisions .

Three Genuine Triangle EntriesTriangles are very common and promising patterns. Normally they are considered as continuation patterns in the direction of prevailing trend. I am presenting here three useful entry techniques. None is better than the other and each one has its own strengths and weaknesses.
ANTICIPATION SETUP
As the name suggests, the trade is taken before the triangle breakout. It is in anticipation of a continuation breakout. Entry is taken at the third touch of the uptrendline.
Stoploss is fairly smaller, below previous swing low A, compared to other setups. Stop can be brought up to breakeven as soon as breakout happens.
As entry is taken before breakout, the chances of hitting the smaller stop are fairly high.
BREAKOUT SETUP
Entry is taken above the prior swing high B with stop below the recent swing low C as shown in the chart. The stoploss is relatively large but chances of hitting the stop is also relatively less.
CONFIRMATION SETUP
Many a times, after the breakout, price pulls back to the triangle for a retest. The entry is taken above the swing high E formed after the breakout as shown in the chart. Stop is kept below the recent retest swing low F or the last swing low D inside the triangle.
Stop may be large in this case but it comes with higher chances of a successful trade.
TARGETS
Target in all the three cases should be the height of the triangle, shown in the chart, as measured from the breakout point of the triangle.
PRO TIP
♦ The triangle breakout should occur within 1/3rd to 3/4th the length of the triangle (see chart). The late breakouts are not considered as valid continuations and may end up as a trading range.
♦ Ideally volume dries up as the price consolidates in a triangle. Volume starts picking up as the breakout occurs which is a good sign.
♦ Triangles setups are valid in both uptrend and downtrend.
I hope the above information would be helpful.
Thanks for reading 😉

Where BANKNIFTY going NEXT . . .?All the key points, aspects, and confirmations are clearly mentioned on the Chart. Kindly do your own research once before entering.
THANK YOU

concor swing trading idea. educational & interactive posttry to find setup in chart and comment.
watch my past posts for reference

Auropharma swing trade idea > forming continuation pattern
> you may call it ascending triangle pattern .
> breakout above 565 would lead a new rally.
> stop loss 556
> 1st target 1:2 and 2nd is trailing stop loss which is HL
> 1-4 days trade
> use proper risk & money management.
> only for education not a trading tip. i may or may not trade this setup.
> trade at your own risk.

Hero motors stage analysis for swing trade 15 min> forming continuation pattern
> you may call it triangle pattern.
> breakout above 2448 would lead a new rally.
> stop loss 2808
> 1st target 1:2 and 2nd is trailing stop loss which is HL
> 1-4 days trade
> use proper risk & money management.
> only for education not a trading tip. i may or may not trade this setup.
> trade at your own risk.

Jamna Auto Analysis 17 Jul 2022 Hi viewer, hope you are doing great.
I am super bullish in this stock because it looks like flag and pole, if it breaks channel on the upside then, 52 week high will be achieved shortly and trail stop loss for more targets.
And your stop loss will be channel's bottom.
If you see the chart clearly, when ever it comes near the blue dotted line which is a 200 Moving Average support, it goes up.
Disclaimer : I am not a SEBI advisor, please consult your financial advisor before investing.
Thanks.
Have a great day!


ABB INDIA: POSITIVE UPTRENDNSE:ABB shows strong buy indicated by PSAR, MACD & Fisher crossover followed by EMA & MA Crossover
Target 2: 2470.75
Target 1: 2343.35
Stop Loss: 2142.60
𝑫𝒊𝒔𝒄𝒍𝒂𝒊𝒎𝒆𝒓:
The analysis is only for illustration purposes only. Please consult your financial advisor, agent, broker before acting on any information. We may or may not have positions in the stock and our actions may be contrary to the one mentioned here. This analysis may or may not be updated. We would not be responsible for the profit/loss resulting from this analysis.

HIKAL LTD: POSITIVE OUTLOOKNSE:HIKAL shows strong buy indicated by PSAR, MACD & Fisher crossover followed by EMA & MA Crossover
Target 2: 456.80
Target 1: 431.80
Stop Loss: 405.10
𝑫𝒊𝒔𝒄𝒍𝒂𝒊𝒎𝒆𝒓:
The analysis is only for illustration purposes only. Please consult your financial advisor, agent, broker before acting on any information. We may or may not have positions in the stock and our actions may be contrary to the one mentioned here. This analysis may or may not be updated. We would not be responsible for the profit/loss resulting from this analysis.
NSE:GAEL

Copper continues it's DowntrendA small flag is formed in Copper
Expected price level is shown
Information mentioned here is for study purpose

Triangle Pattern in NGA symmetrical triangle pattern formed in Natural gas
Both side levels are given for the price movements
Green shows upside
Red shows downside

USDJPY AnalysisPrice is extremely bullish
Idea - Breakout traders can go long once level of 136.736 is taken out while Pullback traders should wait for the retracement to go long.
Major Pivot - 136.500
Caution - The trend is a bit overextended.


Grasims inverted head and shoulder pattern on 1 hour chartGrasims - inverted head and shoulder pattern on 1 hour chart
Can be a long for short term with a candle close above 1370

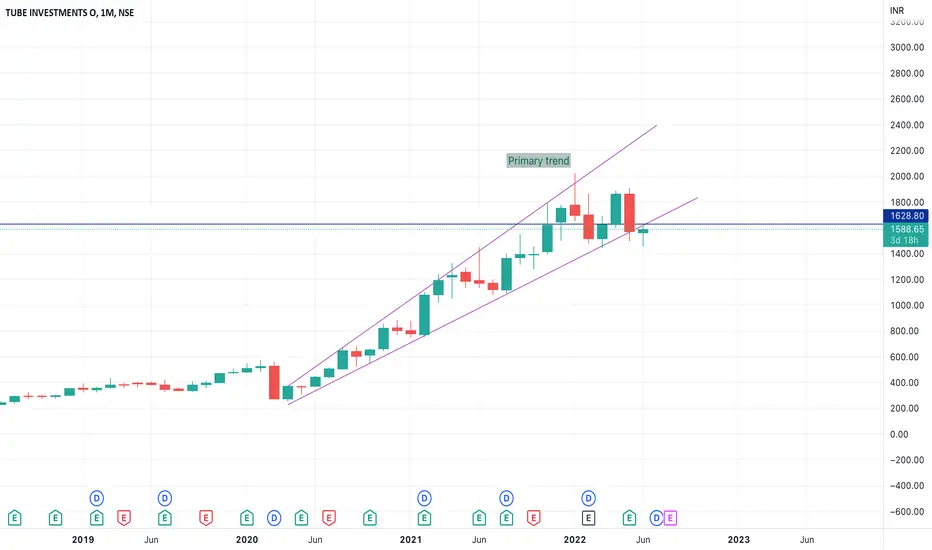
TUBE INVESTMENT - Long term Trend AnalysisTUBE INVESTMENT - Long-term Trend Analysis
1. It breaks the primary trend in daily and weekly candles. Negative sign.
2. The last chance is this week, if it closes above 1630 then it may get an upward reversal.
3. If it falls under the primary trend it has a bright further.
4. first upward target is 1860 and if the market reveals means 2400 will be the ideal target for it.
5. It's a long-term analysis, if it is not able to break 1630 this month or next month if it is open below 1650 it may continue the downtrend.
6. Based on up or downside reversal investors can take the call.
Note:
1. I’m not a SEBI Registered advisor, my research is personal and for educational purposes only.
2. Always check with your financial advisor and take the trade as per your risk/reward ratio.
3. Follow me for more patterns and like, and share so that we feel it is helpful to many and share more patterns...
ADANI ENTERWait And Watch ??
Look for Low risk, High reward, and High Probability setups-
Things to Remember while Trading with the Trend
1. Know what the trend is.
2. The best trades are made in the direction of the trend.
3. Assume that the main trendline or moving average will hold.
4. The longer the moving average is, the better it defines the trend.
5. Wait for the pullback.
6. Don’t chase the market.
7. Don’t fight the market.
8. Even in the strongest trends there should be some retracement.
9. The closer the market is to the trendline, the better the risk/reward ratio is.
10. Use ADX to determine the strength of the trend.
11. Higher the level of ADX , the stronger the trend, below 20 consider the market to be choppy
12. Hold trades longer in a strong trend.
13. Wait for confirmation of a trendline breaking before reversing position.
14. Know where the Support levels are.
15. Place stops outside the Support levels.
Thank You..
