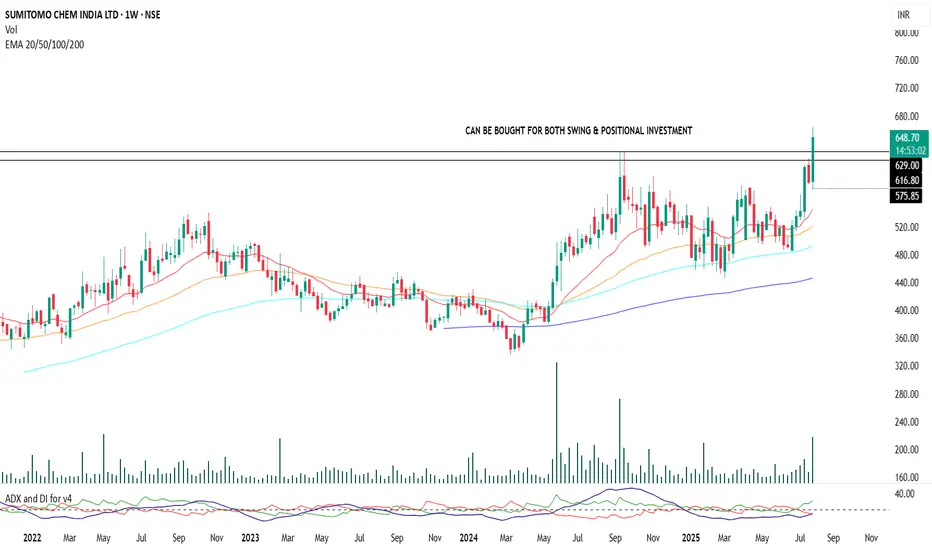
Sumitomo Chemical | Positional Swing Setup with Dynamic SLA strong setup is forming in Sumitomo Chemical with bullish c price action and trend indicators. Entry can be been initiated at current levels with small quantity with a stop-loss placed at ₹570 on a weekly closing basis.
No fixed targets. This is a trailing stop-loss-based position aimed at capturing a sustained trend move.
Add-on Zone: If the price retests the support near the ₹630 level (previous structure/support), more quantity will be added as part of a pyramiding strategy, provided broader market structure remains bullish.
Indicators Used for Trailing SL & Confirmation:
ADX & DI , RSI Levels
Exit Criteria:
Weekly close below ₹570 (hard stop)
Note: This is a disciplined, structure-based swing trade with optional pyramiding. Avoid impulsive exits; trail stop-losses logically based on trend indicators.
Trendtrading
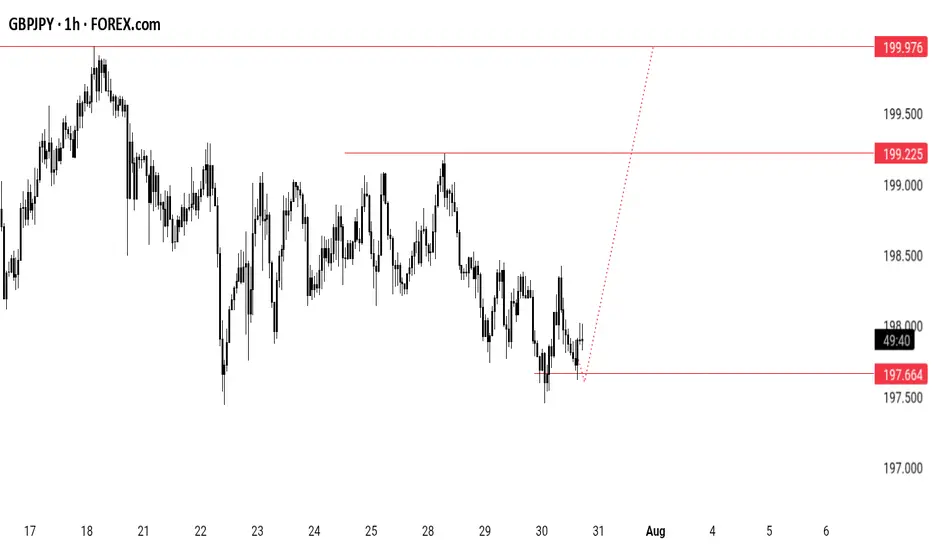
GBPJPY POTENTIAL LONGLooking at GBPJPY ,CURRENTLY taking long positions on the retest of the recently created daily demand zone which also confluences with the retest of the recently created 4h and 1h demand zone .
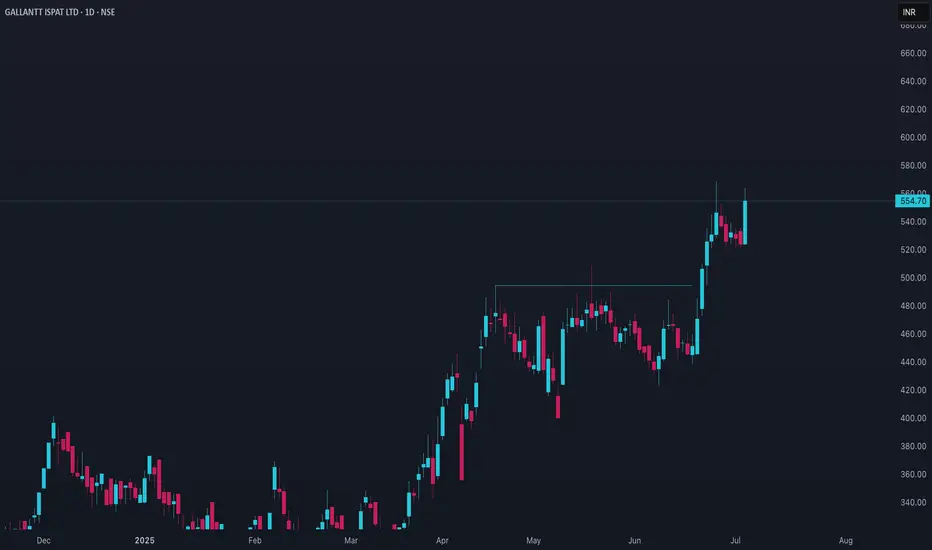
Gallantt price ActionGallantt Ispat Ltd has shown notable price momentum in 2025, with the stock trading in the ₹524–₹555 range and reaching an all-time high of ₹568.65 in late June. Over the past year, the stock has delivered strong returns, nearly doubling from its 52-week low. The last three and six months have seen particularly robust gains, though the past month has included some profit booking and mild declines.
On the financial front, Gallantt Ispat reported a full-year net income of over ₹400 crore for FY25, almost doubling from the previous year. Revenue growth has been steady, but the latest quarter saw a sequential decline in profit after tax, reflecting higher expenses and some variability in operational efficiency. The company’s earnings per share for the year also improved significantly.
Recent quarters have seen an increase in non-operating income, which has contributed to profit growth but raises questions about the sustainability of these gains if operating performance does not keep pace. The company is trading at a high valuation relative to its book value, and its return on equity over the last three years has been moderate.
Technically, the stock has found support near ₹520 and faces resistance at its recent high. Sustained movement above this level could lead to a fresh breakout, while a drop below support may prompt further consolidation. Overall, Gallantt Ispat remains in a positive trend but is subject to volatility and the need for continued operational improvement to justify its elevated valuation.
EURAD POTENTIAL LONGLooking at EURAD on the 1h timeframe,currently looking to take a long position upon the retest of the recently formed 4h and 1h demand zone.A break below the recently formed swing low will invalidate the long.

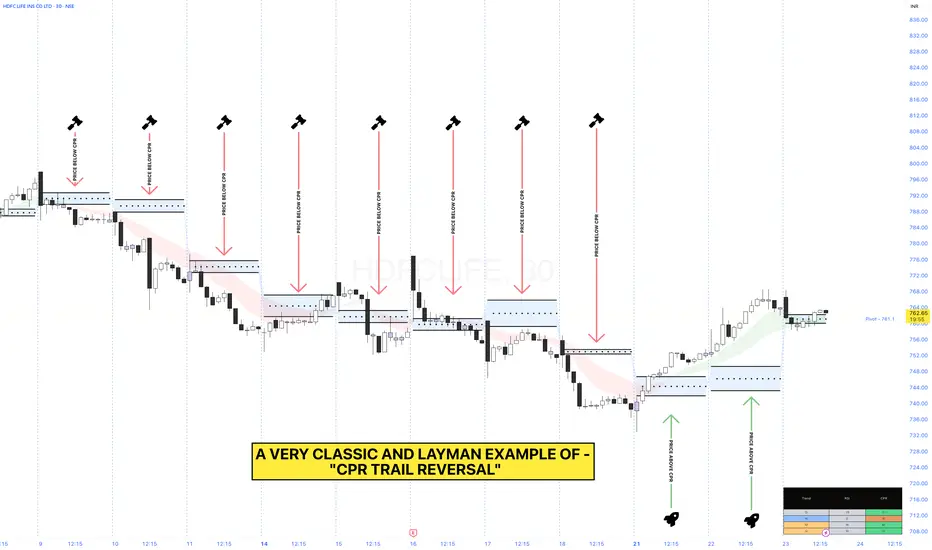
HDFCLIFE ( CPR REVERSAL )HEY PIVSTER'S
Here, we can see a chart analysis of NSE:HDFCLIFE where we spot a live example to demonstrate how an actual CPR Reversal pattern actually looks like and more to it we have added "CPR TRAILS" which now makes the whole pattern look much more informative...🙂
So, here is an example of "CPR TRAIL REVERSAL" which depicts how a particular trend changes alongside it's CPR 📝
SOME OBSERVATION TO BE NOTED:
Here, in the sample size taken for example shows one very interesting price movement alongside it's CPR formation and that is basically-
"If we observe closely then alongside a descending CPR Trail formation the Price alongside the same is not closing above the CPR" 👀
And even if price is able to open above the CPR's we can see that Price is not able to cross the opening high of the first 30min candle until 21st July, 2025 where the price changed track and closed above CPR on the same day 📊
NIFTY Analysis – 21 july 2025 ,morning update at 9 amNIFTY Price Levels:
Expected Opening:-- Near 24985 (flat)
Upside Watch: May test 25035
Downside Trigger: If Nifty fails to hold 24985, potential fall towards:
24896 (Support 1)
24807 (Support 2)
nifty support -24897, 24807, 24722
Resistance -25035, 25122, 25219
Wait for Pattern Confirmation:
Bottleneck patterns often result in fakeouts, so avoid premature entries.
Use BOD or SOR Strategy
BOD (Buy on Dip): Only if strong bounce from support with volume.
SOR (Sell on Rise): If price fails to sustain above resistance zones.
Scalping Opportunity:
Due to bottleneck formation, expect a narrow range
Opening near 24985, range-bound likely due to bottleneck.
Upside capped near 25035 unless breakout on volume.
Watch 24896 and 24807 for bounce or breakdown.
Prefer scalping or small quantity BOD/SOR trades post 9:30 AM
Nifty is opening flat near 24985 (inside this range).
Bearish Bottleneck pattern means price is getting compressed (low volatility).
Both buyers and sellers are active inside this tight band but no clear breakout yet.
Scalping is best strategy in sideways zones, with small targets and stop-loss.

AUDCAD POTENTIAL SHORTLooking at AUDCAD on the 4h timeframe,currently looking to take shorting positions upon the retest of the recently formed daily supply zone which also confluences withe retest of the level in which the market broke out of and the inner 4h and 1h supply zones.

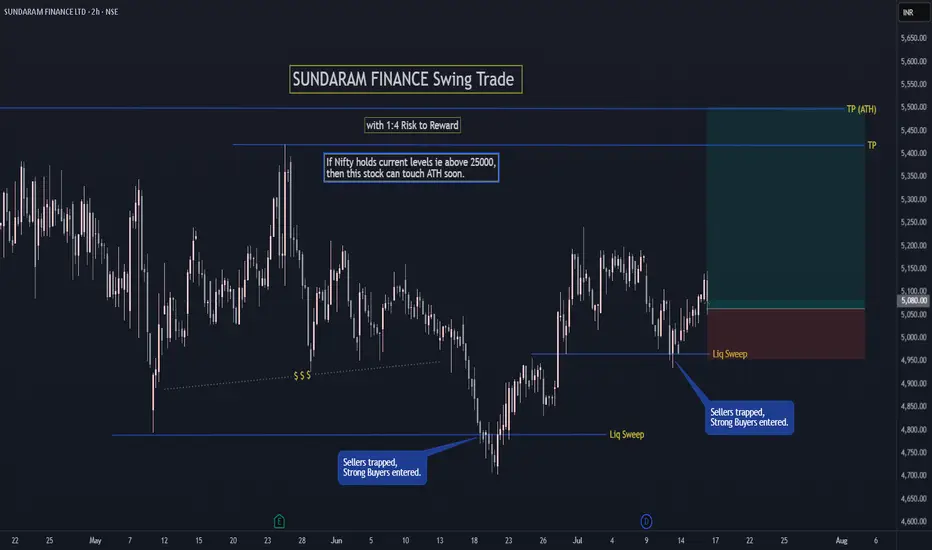
SUNDARAM FINANCE Swing TradeIf Nifty holds current levels ie above 25000,
then SUNDARAM FINANCE can touch ATH soon.
FOLLOW for more such simple swing setups.
Let me know in comments if you have any doubt or questions.
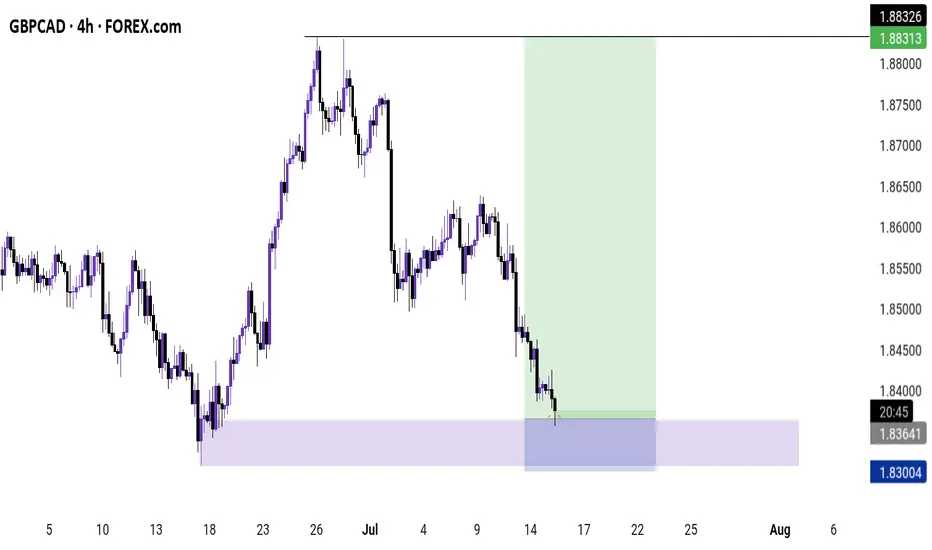
GBPCAD POTENTIAL FOR THE UPSIDELooking at GBPCAD, currently looking to take long positions on the current retest of the daily demand zone which also confluences with the retest of the recently formed 4h and 1h demand zones.Use the lower timeframes to confirm the move and use proper risk management should you decide to join me
US30 potential for the upsideLooking for US30 to push to the upside upon the retest of the recently created 4h/1h demand zone.Use proper risk management should you join me.

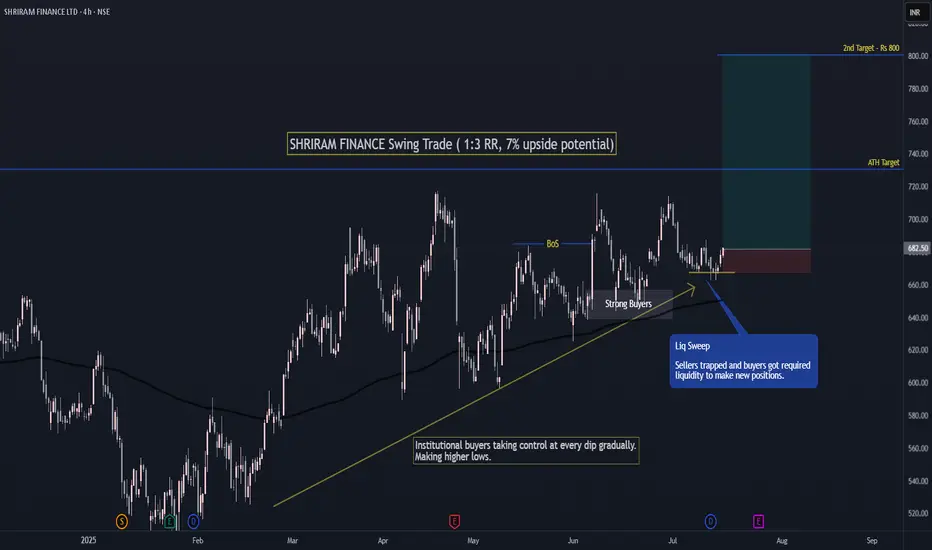
SHRIRAM FINANCE Swing Trade ( 1:3 RR, 7% upside potential)1st Target at ATH with 1:3 RR and 7% upside.
2nd Target at psychological level of 800.
If Nifty holds current level of 25000 then Shriram Finance can make a new ATH.
Institutions have gradually bought the stock at every dip making higher lows continuously.
Recently sellers got trapped which can start a new up-move.
Follow me for more such simple trades.
BAJAJ FINSERV Swing Trade ( 1:3 RR )If Nifty holds current levels ie. 25000, then Bajaj Finserv will continue its sideways-uptrend.
Sellers have recently got trapped by the buyers in the buying zone which can fuel next up-move.
With 1:3 RR, trade setup is simple and looks good if overall market is not bearish.
Thanks and let me know in comments if you have any questions.
Follow for more such simple swing trade setups.

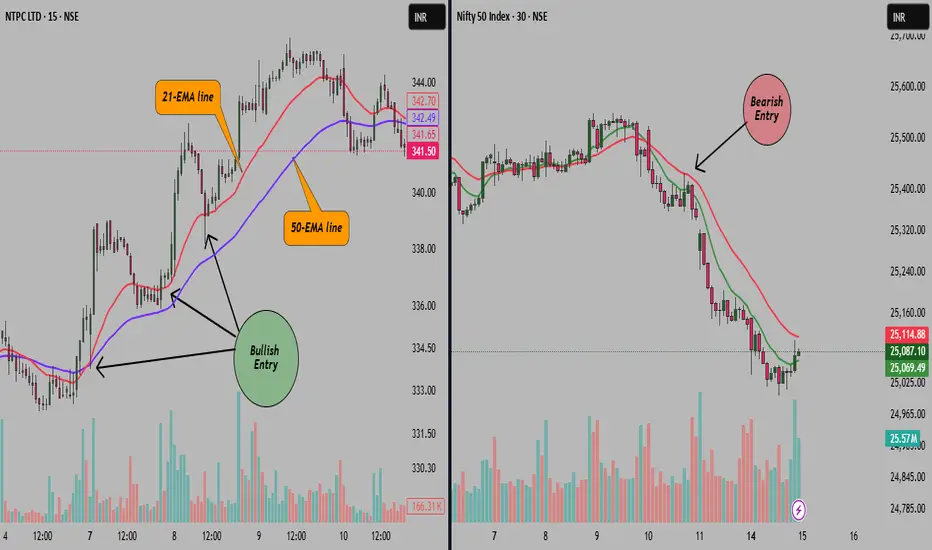
EMA Pullback Entry – The Cleanest Setup for Trend Followers!Hello Traders!
In today’s post, let’s explore one of the most reliable and beginner-friendly setups — the EMA Pullback Entry . If you’re a trend follower looking for clear, rule-based entries , this strategy will become a go-to in your toolkit. It helps you avoid chasing breakouts and instead ride strong trends with precision entries during pullbacks .
What is EMA Pullback Entry?
It’s a trend continuation strategy where traders use Exponential Moving Averages (EMAs) — typically the 21 EMA and 50 EMA — to identify the trend and wait for the price to retrace (pull back) into the moving average zone before continuing in the direction of the trend.
How to Trade the EMA Pullback Setup
Identify the Trend: Use a 21 EMA and 50 EMA on your chart. A bullish trend is confirmed when 21 EMA is above 50 EMA and price stays above both. Opposite for bearish.
Wait for a Pullback: Let the price retrace toward the EMAs without breaking below/above them significantly.
Look for Confirmation Candle: Wait for a bullish (or bearish) confirmation candle near EMAs — like a Pin Bar, Engulfing, or Doji rejection.
Entry & Stop Loss: Enter after confirmation. Place a stop-loss just below the pullback low (for long) or high (for short).
Target: Aim for previous swing high/low or use 1:2 risk-reward ratio.
Why It Works
Trend Is Your Friend: You’re trading with the trend, not against it.
Clear Visual Clarity: EMAs help you spot dynamic support/resistance zones.
Disciplined Entry: You wait for price to come to you, not chase it.
Rahul’s Tip
“The best trades often come to those who wait.” Don’t jump on every candle — let the price respect your EMAs, then strike.
Conclusion
The EMA Pullback Entry is a simple yet powerful setup that can give you high-probability trades in trending markets. Whether you trade intraday or swing, this strategy can help you time entries better and stay disciplined.
Have you tried this setup? Share your experience or ask questions in the comments – let’s grow together!
Exhaustion vs Runaway Gap |How to Catch Trend and Spot ReversalsGaps often confuse traders — some lead to powerful trends, others signal trend exhaustion. In this video, I break down the key psychological and technical differences between Runaway Gaps and Exhaustion Gaps, with real examples and clean explanations.

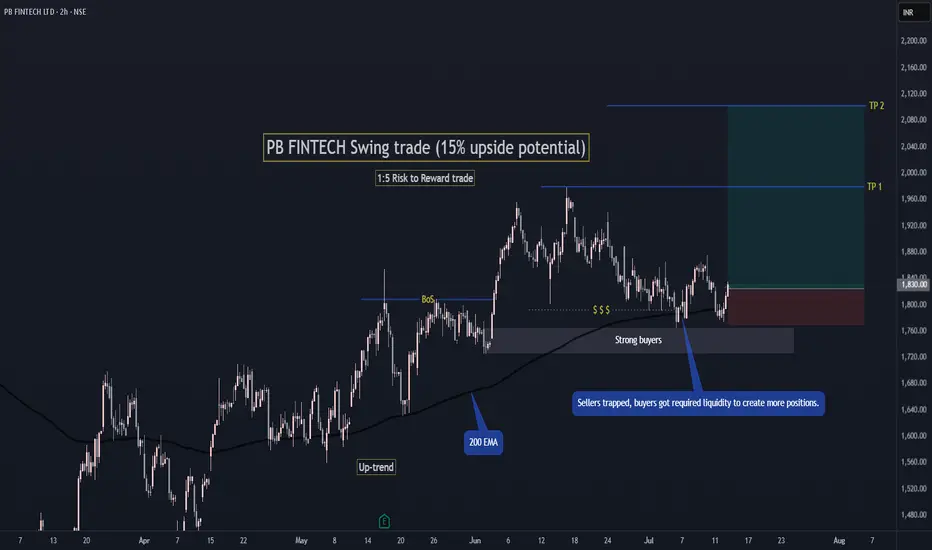
PB FINTECH Swing Trade (15% upside)If Nifty holds current levels ie. 25,000 then there are high chances that PB FINTECH will continue its uptrend and will make a new high.
Currently it is at a buying zone, you can make positions as per your risk.
Sellers are also trapped recently which can start next up-move.
With 1:5 RR and >15% upside potential.
Thanks and let me know if you have any questions regarding this setup in comments.
Banknifty price actionBank Nifty closed at 57,031.9 on July 4, 2025, up 0.42%, showing resilience after a brief dip earlier in the week. The index has been consolidating near all-time highs, maintaining a bullish structure with higher highs and higher lows on the daily chart. Despite some profit booking, Bank Nifty remains above its key moving averages, and technical indicators like RSI and MACD continue to support the broader uptrend.
Short-term support is seen around 56,500–56,600, which aligns with the 20-day EMA. As long as Bank Nifty holds above this zone, the bias remains positive and the index could attempt to move towards resistance levels at 57,540 and 57,854. A decisive close above 57,800 would likely open the path to 58,500. However, overbought oscillators and a weak ADX suggest the trend strength is moderate and the market could remain rangebound unless a breakout occurs.
Constituent performance has been mixed, with ICICI Bank, AU Bank, HDFC Bank, and Axis Bank contributing to gains, while Bank of Baroda, IndusInd Bank, and Federal Bank saw mild declines. Overall, the structure favors a buy-on-dips approach as long as the index stays above its immediate support. A close below 56,500 would be the first sign of a deeper correction.

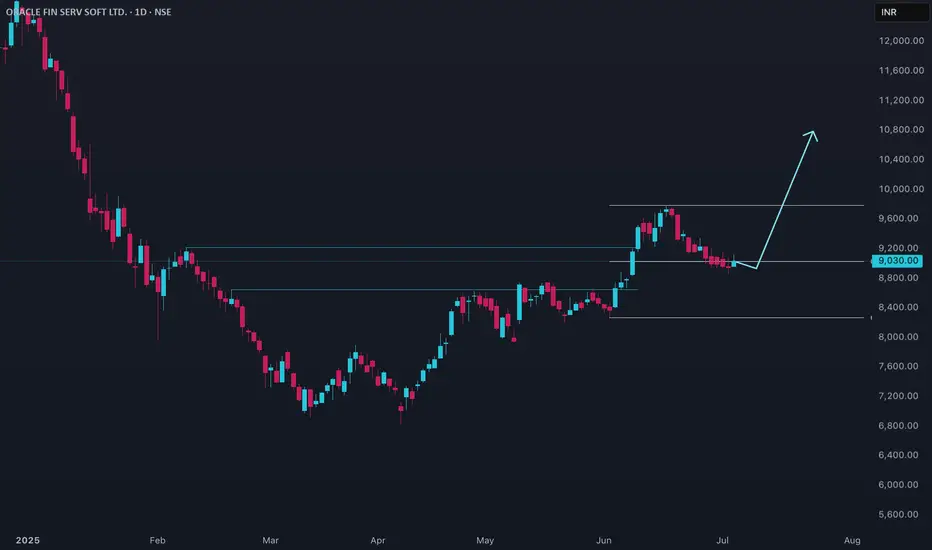
OFSS Price ActionOracle Financial Services Software Ltd (OFSS) is currently trading around ₹9,030, reflecting a volatile but active price environment. Over the past week, the stock declined by nearly 3%, but it has gained over 6% in the last month and more than 15% in the past three months. Despite this recent recovery, OFSS remains down about 29% over six months and approximately 13% over the past year.
Technically, the stock has faced strong resistance in the ₹9,060–₹9,288 range, with immediate supports at ₹8,837, ₹8,731, and ₹8,611. A close above ₹9,195 could trigger fresh buying momentum, while a sustained move below support levels may signal further downside. Options data indicates heightened volatility, with active trading in both calls and puts near the ₹8,000–₹9,500 strikes.
Fundamentally, OFSS reported a 7.4% year-on-year revenue increase in FY2025, with net income up 7.2% and a robust profit margin of 35%. The company’s earnings per share beat analyst expectations, though revenue was slightly below estimates. The dividend yield stands at a healthy 2.96%, and the company maintains a strong market capitalization above ₹77,000 crore.
Overall, OFSS is showing signs of stabilization after a sharp correction, with short-term price action suggesting a cautious but potentially positive outlook if key resistance levels are breached.
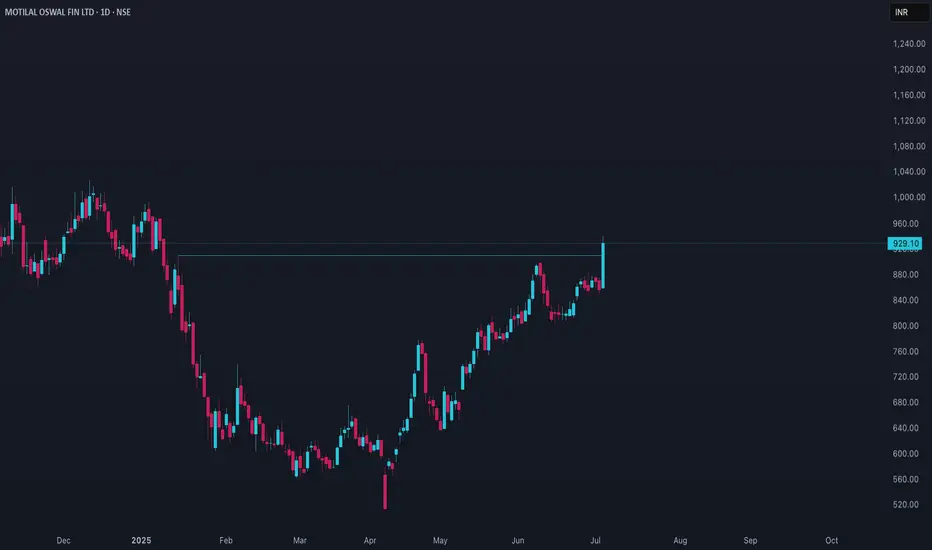
MOTILALOFS Price actionMotilal Oswal Financial Services Ltd (MOTILALOFS) has experienced **strong price momentum over the past year, rising more than 50%**. The stock recently traded between ₹854 and ₹929, with its all-time high of ₹1,064 reached in October 2024 and a 52-week low near ₹488.
**Short-term action:**
In the last week, the stock moved up by about 0.4%, and in the past month, it gained nearly 7%. Over three months, the gain was especially notable at nearly 40%. However, the stock is highly volatile—about 3.8 times as volatile as the Nifty index—and has a high beta of 1.79, indicating large price swings.
**Recent trend:**
After peaking above ₹1,000 in late 2024, MOTILALOFS saw a correction, dropping to the ₹700-800 range by mid-2025. Since then, it has rebounded, climbing back above ₹850. The last few sessions show a mix of minor gains and losses, reflecting ongoing volatility and active trading interest.
**Volume and liquidity:**
Trading volumes have been robust, with some sessions seeing over a million shares traded, especially during sharp moves. This indicates strong liquidity and sustained investor interest.
**Valuation and fundamentals:**
The stock is considered overvalued relative to market averages, with a price-to-earnings ratio above 20 and a price-to-book ratio above 4. Its dividend yield is modest at 0.58%. Despite high volatility, the company has delivered solid profitability and efficiency metrics, with return on equity above 25%.
**Outlook:**
Analysts remain optimistic, with some forecasting potential upside toward ₹1,150, though downside risk remains to ₹763. The company’s business is diversified across broking, asset management, investment banking, and housing finance, and recent results show strong revenue growth, especially in wealth management and housing finance. However, there have been short-term challenges, such as a decline in cash market share and weaker performance in private wealth management.
**Summary:**
MOTILALOFS is in a recovery phase after a sharp correction, showing renewed upward momentum but with high volatility. The outlook is positive, supported by strong fundamentals and sector growth, but investors should remain cautious due to the stock’s elevated valuation and price swings.
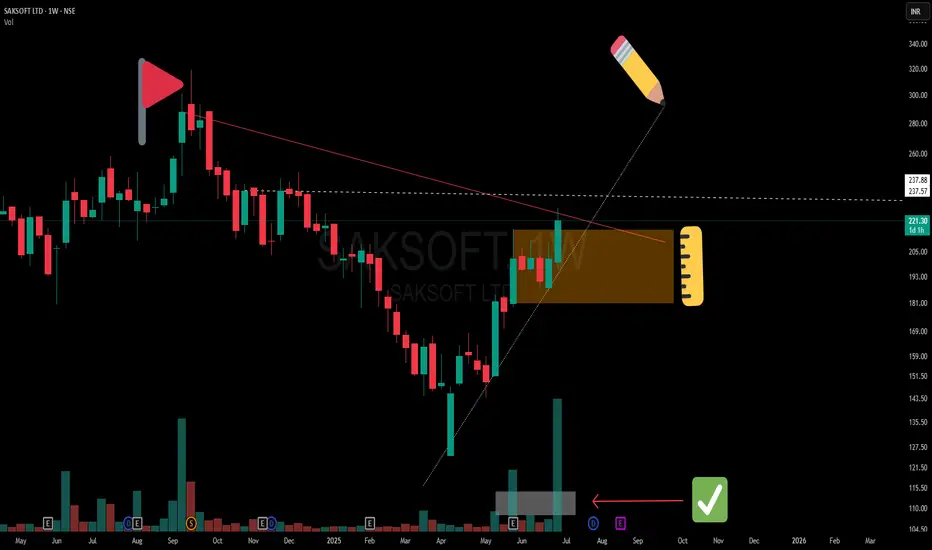
Precision Meets Patience | SAKSOFT Chart WTF🔻 A clean Control Trendline (CT) drawn from the all-time peak (🔺) on the Weekly Time Frame (WTF) shows a long-term price memory resistance finally getting tested.
📏 Overlapping that is a hidden horizontal resistance (⚪ dotted white line), representing the final hurdle before the stock can challenge the supply zone.
🟧 Mother Candle Structure: A powerful consolidation candle has now been broken with strength, giving us structure + intent in one move.
🔊 Volume speaks! We’ve seen two separate clusters of high volume, confirming active participation—not a lonely breakout.
📈 The trendline from bottom left is giving both body and wick supports—a technically clean angle where structure meets sentiment.
📝 Note:
This is a structural breakdown meant for educational and analytical purposes. Not a forecast or recommendation.
ONGC | ascending (bullish) trend channelTechnical Setup Overview:
Chart Type: 2-hour (Intraday)
Trend Channel: Clearly drawn ascending (bullish) trend channel.
Support line: Currently testing or near the lower support of the channel (~242).
Resistance line: Upper channel has been tested multiple times near 257–260 range.

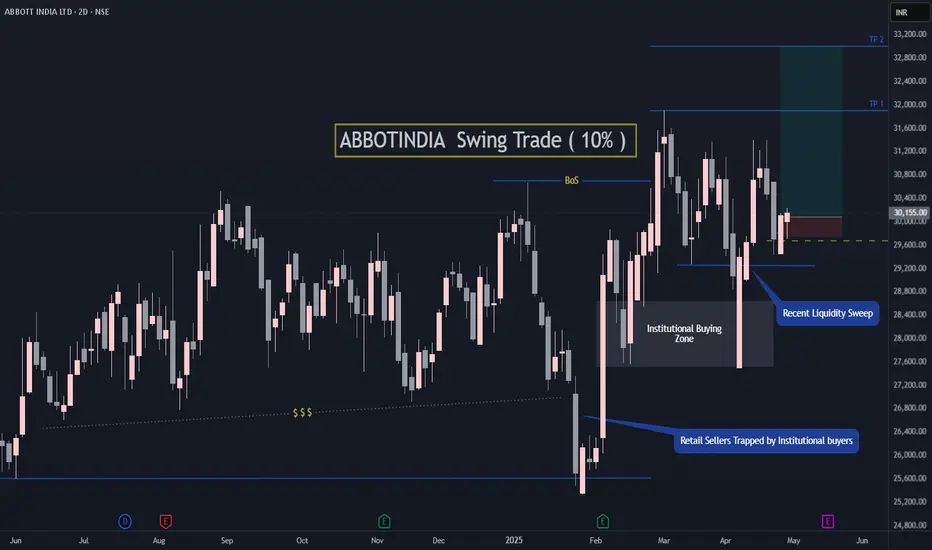
ABBOTINDIA Swing Trade ( 10% upside potential) Abbott India is near to the previous Institutional Buying zone and has upside potential of 10%.
Simple Demand Zone buying setup.
Don't keep hard stop loss. Manage positions as per situation.
Follow for more such setups.
I have been very busy lately because of renovation at home. Will be sharing more setups soon. Thanks.
GRSEHealthy stock , again show some sign of strength.
-11% risk,
Target at least 1:2
80% meet my criteria.
Let's see how it move.

BTC next 24 hours Important Zones are we heading to $100K Yes/NoHello Guys,
Follow up to our Morning Post, DELTAIN:BTCUSD.P responds exactly to the support base of 95000 Zone and
roaming around those.
What to expect now, if we cross the Supply Zone 1 mentioned in the chart, the next target is
It will test Supply Zone 2, till we are comfortably close above this and trade strongly, doors for Historic $100k will open after that level only, btw you know Target for Bitcoin was predicted by our 10x Bulls Team in year 2021.
An vice versa not holding the 95000 demand zones, will make this difficult for bulls.
Plan your trade with risk properly managed.
-10x Bulls
Courtesy: 10x Bulls (An educational helpdesk platform for investors and traders to find the best investment decisions, faculty trained by ex-fund managers, from Top Finance Institutions such as JP Morgan Chase and Goldman Sachs)
