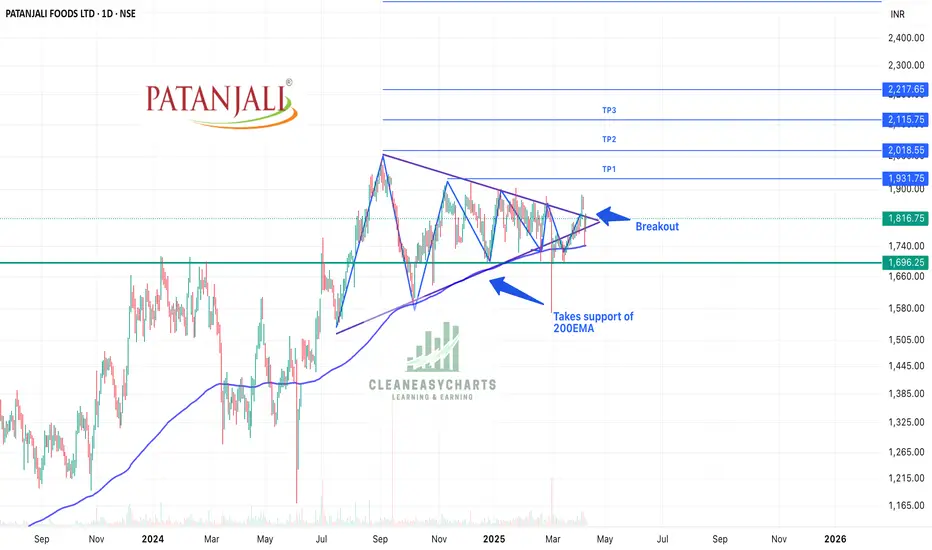
Patanjali - Ascending Traingle BreakoutPatanjali has given a BO of ascending triangle and has taking support of 200EMA. Given the FMCG space, this is looking for a good run. Other factors:
1. Turnaround story from a dead loss making Rushi Soya to a big name in FMCG sector
2. Venturing into unexplored insurance business by acquiring Magma General Insurance
3. LIC increased stake to 7%
4. Tax reduction from 1 April 2025 onwards will result in high disposable income and FMCG sector which is more dependent on domestic demand and hence no impact of tariffs will take lead
5. Support of 200EMA
6. Consolidating in a range from quite some time.
Keep following @Cleaneasycharts as we provide Right Stocks at Right Time at Right Price!!
Cheers!!!
Triangle
Bajaj Finserv in a bullish trend; Watch and trade?Bajaj Finserv has been in a good trend even when overall market remained negative, the stock has been trading around the recent highs.
There has been a Break out of the resistance zone but the market has formed a Tweezer top after the break out on the weekly charts.
If there is trend reversal of the indices, high chance of it forming new high while be there.
YTD the stock has posted 17% positive returns while the markets are down by the approximately the same percentage.
Major Resistance levels :-1860-19410
Possible Target levels (as per fibonacci levels) :- 2304, 2771
This can be the stock of the year. 20-40% return can be captured as per the holding capacity. Keep strict SL
Wait for the price action and trade as per the trading plan/setup.

NIVA BUPA HEALTH (NSE: NIVA) – Breakout PotentialRight now, it is completing a descending triangle breakout, which is a bullish pattern.
The stock has been consolidating for the past 4 months in a tight range, building strength for a breakout.
All important levels have been marked on the chart.
Looking at the chart, we can say that if the price breaks to the upside, there is a high probability that the stock will reach the ₹98.63 target.
For the past few days, volume has also been quite good. If we enter the stock at ₹76.66, we can achieve the target with
Risk: Reward :: 1 : 2.49
Support Levels:
🔹 ₹72.44 – Strong support zone
🔹 ₹70.11 – Previous low acting as support
🔹 ₹69.21 – Secondary support in case of a pullback
Resistance Levels:
🔹 ₹76.66 – Immediate breakout level
🔹 ₹85.35 – Previous high acting as resistance
🔹 ₹98.63 – Final target zone
Reasons:
✅ Consolidation for 4 months, leading to a strong breakout setup
✅ Descending Triangle Breakout
✅ Support at ₹72.44 holding strong
✅ Wait for RSI to cross 60 for confirmation
✅ First breakout attempt after listing drop
✅ High volume surge, indicating strong buying interest
✅ Price > 50 EMA and approaching trendline resistance
Verdict:
Bullish
Plan of Action:
Enter once the breakout is confirmed to the upside.
BUY: ₹76.66
Stoploss: ₹72.44
Target: ₹98.63
Trailing SL: ₹5–₹8 once price crosses ₹85

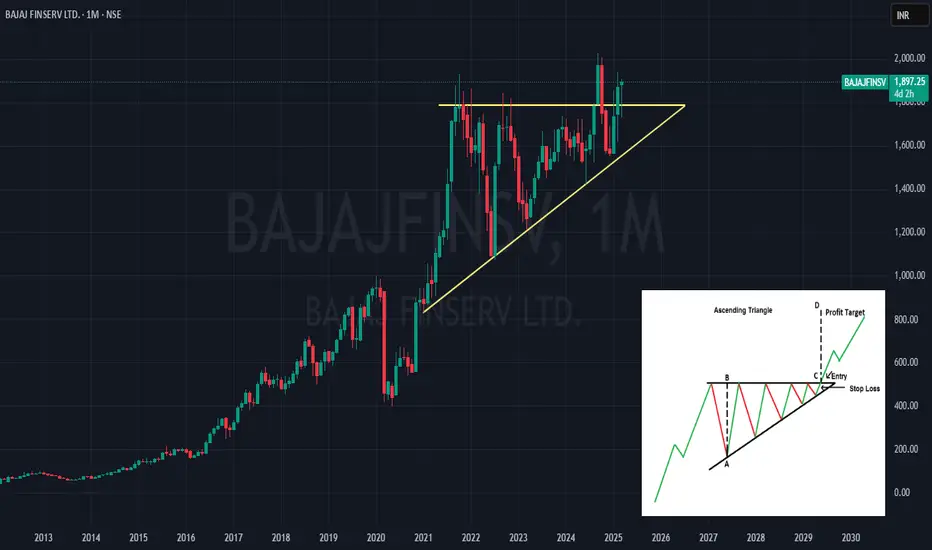
Bajaj Finserv (BAJAJFINSV) forming an Ascending Triangle patternBajaj Finserv's stock is currently forming an Ascending Triangle pattern, which is often considered a bullish continuation pattern. This marks the second time the stock has broken above its September 2021 highs. The first attempt occurred in September 2024, but it failed to maintain momentum above that level and eventually found support within its channel. However, in February 2025, the stock successfully broke through the resistance and closed above it, which had previously acted as a strong resistance level.
This breakout could signal potential bullish momentum.
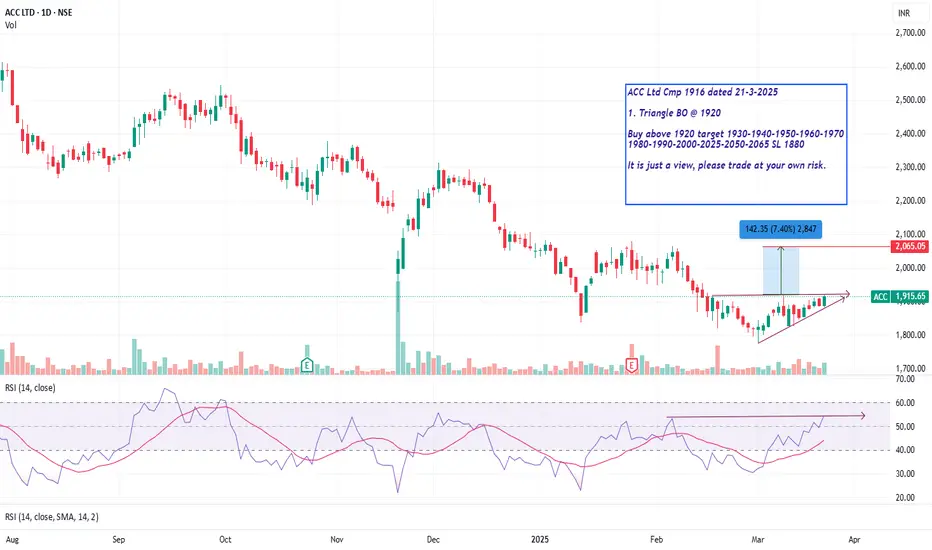
Triangle BO @ 1920 Triangle BOACC Ltd Cmp 1916 dated 21-3-2025
1. Triangle BO @ 1920
Buy above 1920 target 1930-1940-1950-1960-1970
1980-1990-2000-2025-2050-2065 SL 1880
It is just a view, please trade at your own risk.
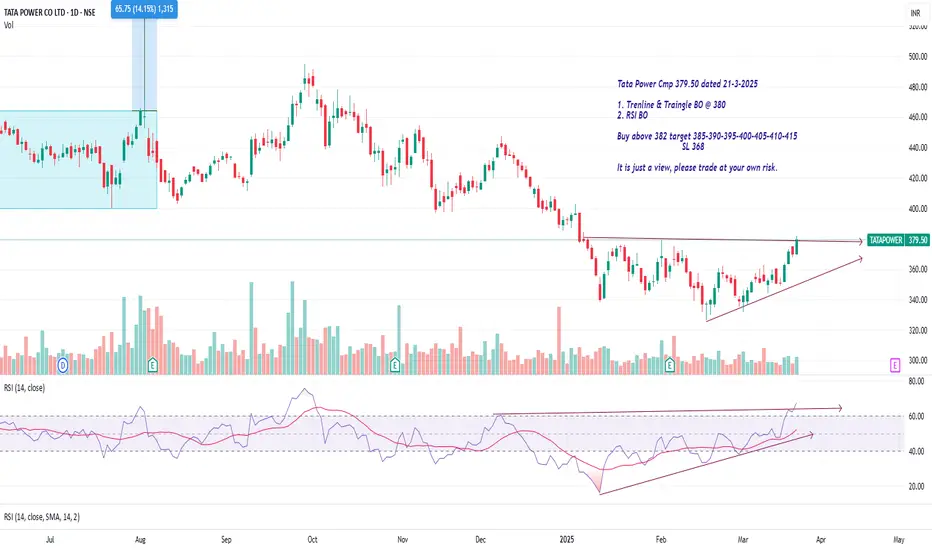
Tata Power Cmp 379.50 Triangle BOTata Power Cmp 379.50 dated 21-3-2025
1. Trenline & Traingle BO @ 380
2. RSI BO
Buy above 382 target 385-390-395-400-405-410-415
SL 368
It is just a view, please trade at your own risk.
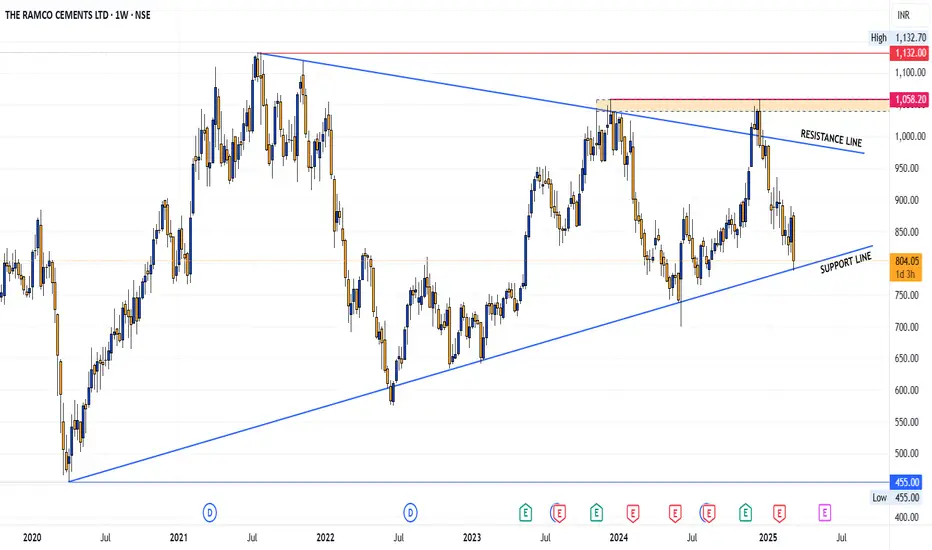
Ramco Cements: A triangle pattern is emergingRamco Cements is developing a triangle pattern, which occasionally offers support and resistance points that can create trading opportunities. I've highlighted these levels on the chart, and I hope this might be useful for anyone looking to navigate these price movements.
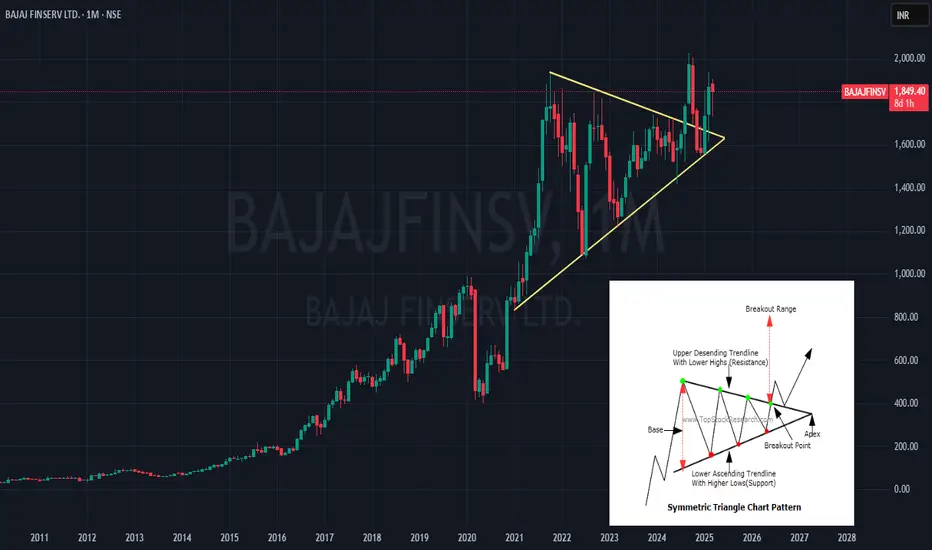
Bajaj Finserv (BAJAJFINSV) – Symmetrical Triangle BreakoutBajaj Finserv has formed a symmetrical triangle pattern on the monthly time frame, indicating a potential strong breakout. This pattern is often seen as a sign of consolidation, and with the recent breakout, it could lead to significant price movement.
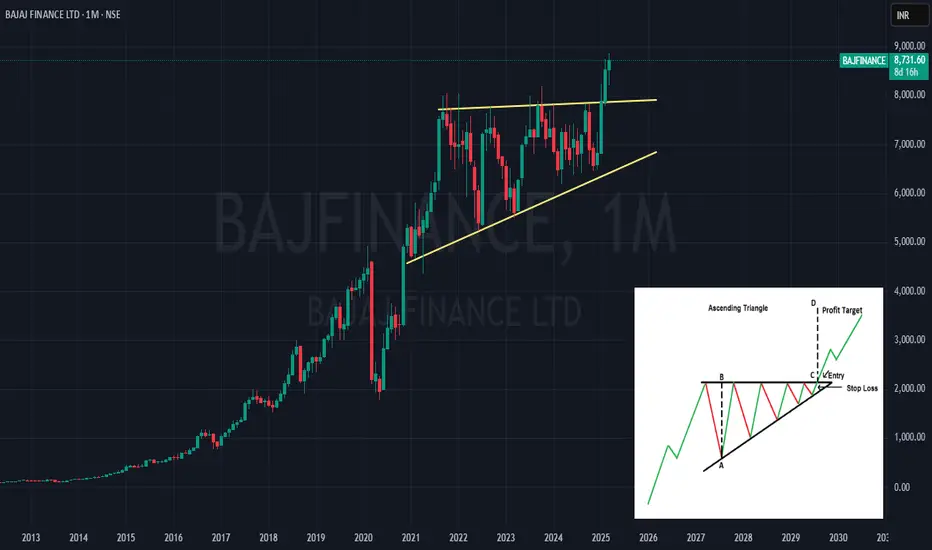
Bajaj Finance (BAJFINANCE) – Ascending Triangle Pattern FormingBajaj Finance's stock is currently forming an Ascending Triangle Pattern, which is often seen as a bullish continuation pattern. For the first time, BAJFINANCE has closed above the September 2021 highs, which was previously a strong resistance level. This indicates that the stock might be gearing up for a potential breakout!
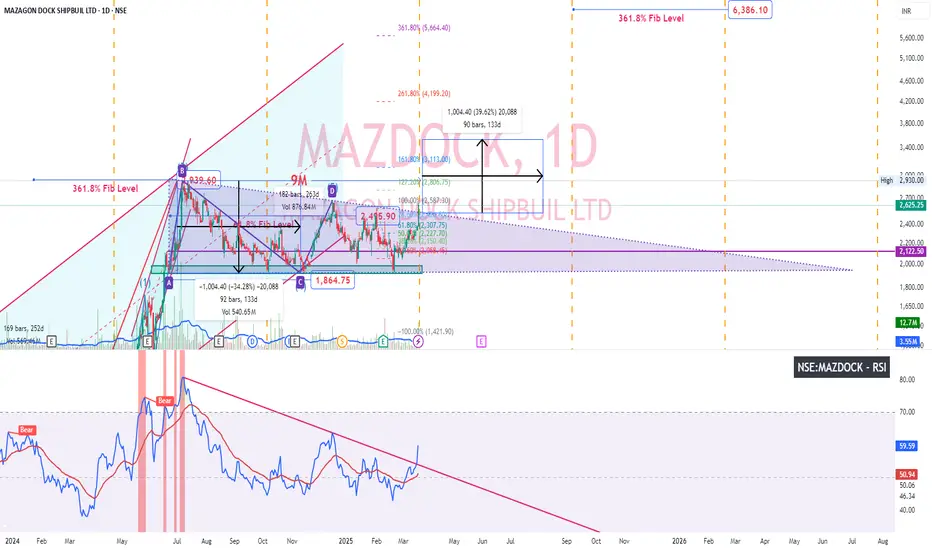
Mazdock - Price, RSI breakout - D timeframeMazdock after good Q3 descending triangle breakout. Usually descending triangle is bearish pattern. Let's see if the target 3539.40 gets reached (height of the triangle)
SWING - VIJAYA DIAGNOSTICS
Script taking support from trendline , displaying higher high around 1080 and Breakout from resistance may attempt for higher swing resistance around 1300 levels

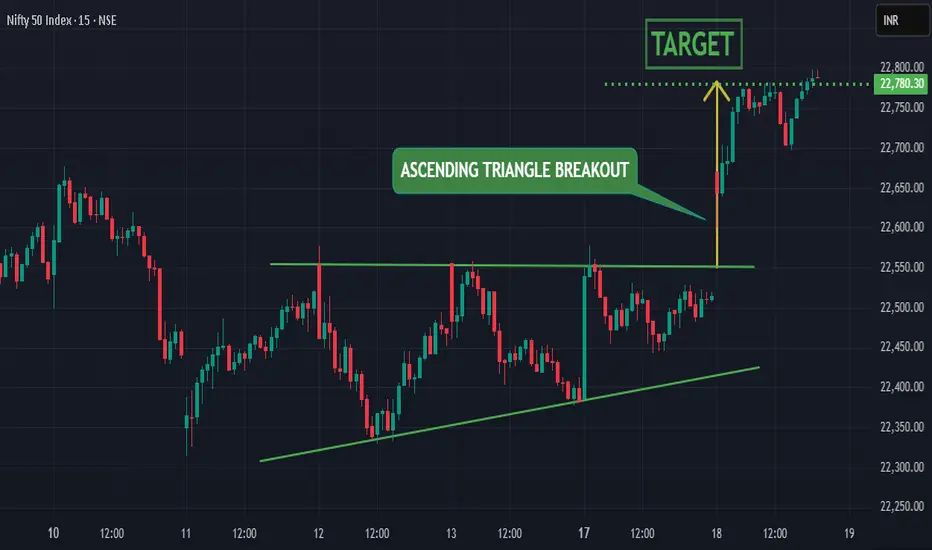
Nifty broke out of Ascending Triangle pattern
ASCENDING TRIANGLE BREAKOUT -
nifty had recently broken out of strong ascending triangle pattern indicating strong upward potential for the index
50D & 100D SMA CROSSOVER -
50D sma had recently crossed over 100D sma and took multiple support on 50D sma repeatedly indicating strong potential of upward momentum for the index
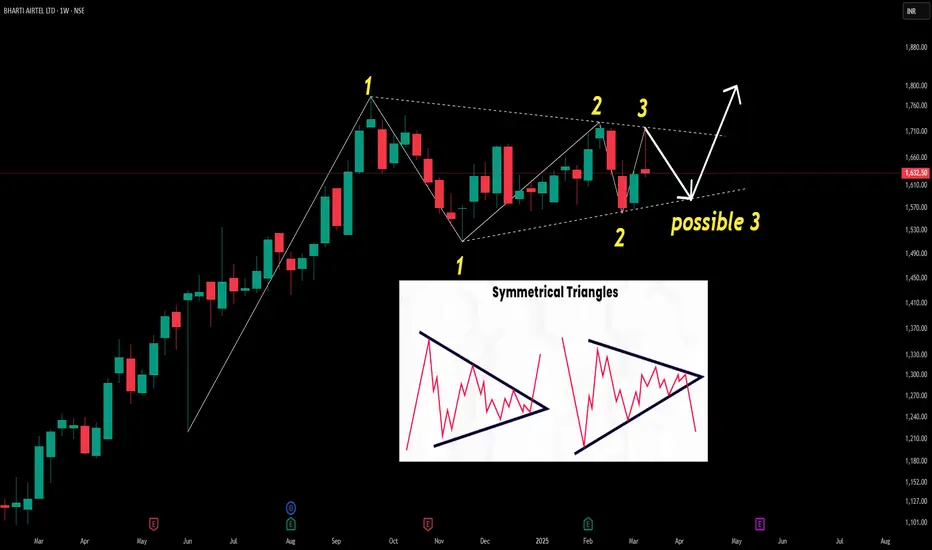
Symmetrical Triangle Pattern Identified: BHARTI AIRTEL LTDThis weekly candlestick chart highlights a symmetrical triangle pattern, a classic signal of potential breakout opportunities. With key points marked (1, 2, 3), traders can analyze possible breakout directions for informed decisions.
harti Airtel Ltd., incorporated in the year 1995, is a Large Cap company (having a market cap of Rs 9,93,885.70 Crore) operating in Telecommunications sector.
Bharti Airtel Ltd. key Products/Revenue Segments include Service Revenue and Sale of Products for the year ending 31-Mar-2024.
For the quarter ended 31-12-2024, the company has reported a Consolidated Total Income of Rs 45,599.00 Crore, up 9.28 % from last quarter Total Income of Rs 41,728.00 Crore and up 18.94 % from last year same quarter Total Income of Rs 38,339.30 Crore. Company has reported net profit after tax of Rs 14,474.90 Crore in latest quarter.
BAJFINANCE - Bullish ascending triangle1. BAJFINANCE - Bullish ascending triangle on Monthly chart
2. Very close stop loss with a high reward potential.
3. Long term chart pattern - may take 3-5 years to achieve the expected target.

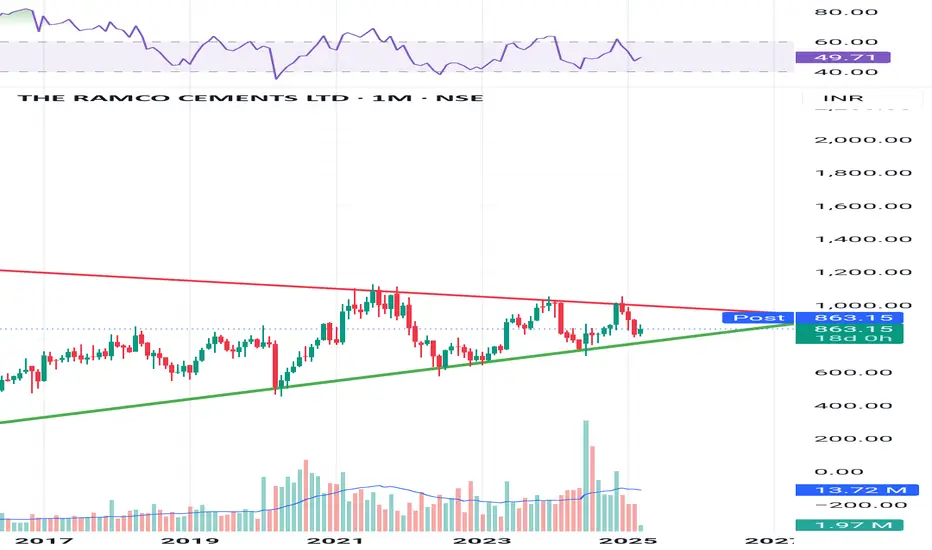
Ramco Cements at a Crossroad: Big Breakout or Breakdown Ahead?This chart shows The Ramco Cements Ltd on a monthly timeframe, with price action forming a clear structure.
Analysis:
Pattern: A symmetrical triangle pattern, where the price is trading within a narrowing range.
Resistance (Red Line): Around ₹1000, where the price has faced multiple rejections.
Support (Green Line): Higher lows, indicating that the long-term uptrend is still intact.
RSI: Currently around 49.71, sitting in a neutral zone — neither overbought nor oversold.
Deception Point:
If the price breaks below ₹800 and sustains, it could signal a bearish breakdown.
Conversely, a breakout above ₹1000 with volume confirmation could trigger a strong bullish rally.
Next Steps:
Wait for a breakout with volume to confirm the move.
Enter the trade only after a confirmation candle to avoid getting trapped in a false breakout.
(AVANTIFEED)Avanti Feeds Ltd. (AVANTIFEED)
Weekly report 🍁
Ascending triangle breakout
Volume ✔️
Here are some key fundamentals:
- *Market Capitalization*: ₹10,884 Cr
- *P/E Ratio*: 22.62 ¹
- *P/B Ratio*: 4.10
- *Dividend Yield*: 0.85%
- *EPS (TTM)*: ₹35.31
- *52 Week High*: ₹822
- *52 Week Low*: ₹472

Amazon analysisAccording to chart pattern, Amazon could face a downfall as other companies doing well in field of AI. Yet, Amazon didn't announce anything about AI project and not developing infrastructure for the same.

EURUSD - PRE BREAKOUT CONSOLIDATION - ASCENDING TRIANGLESymbol - EURUSD
CMP - 1.0485
The EURUSD pair continues to display bullish signals, suggesting the potential for sustained upward movement. However, significant resistance lies ahead, and the market is currently undergoing a pre-breakout consolidation phase. The U.S. dollar is experiencing a corrective phase, influenced by economic data, domestic political developments, and indications from both President Trump and Federal Reserve Chairman Jerome Powell regarding the possibility of an imminent interest rate cut.
The euro is benefiting from the weakening dollar, though the duration of this trend remains uncertain, particularly in the context of the ongoing trade tensions between the U.S. and Europe.
From a technical perspective, the current chart suggests a bullish outlook. An ascending triangle is forming within the prevailing uptrend, generally indicative of market optimism. Key focus is placed on the pattern’s base, with resistance located at the 1.0530 level.
Support levels: 1.0450, 1.0400
Resistance levels: 1.0530
Should the dollar continue its downward trajectory, the pair is poised for potential growth. A retest of the trend support level, possibly marked by a false breakout, could occur before a decisive breakout. A successful breakout and sustained consolidation above the 1.0530 resistance level may trigger further upward movement.

Triangle Pattern in Elliott Wave-4A Triangle pattern in wave4
The wave 5 could end near 22464.
This could be followed by a Sharp reversal trade retracing wave 5 completely

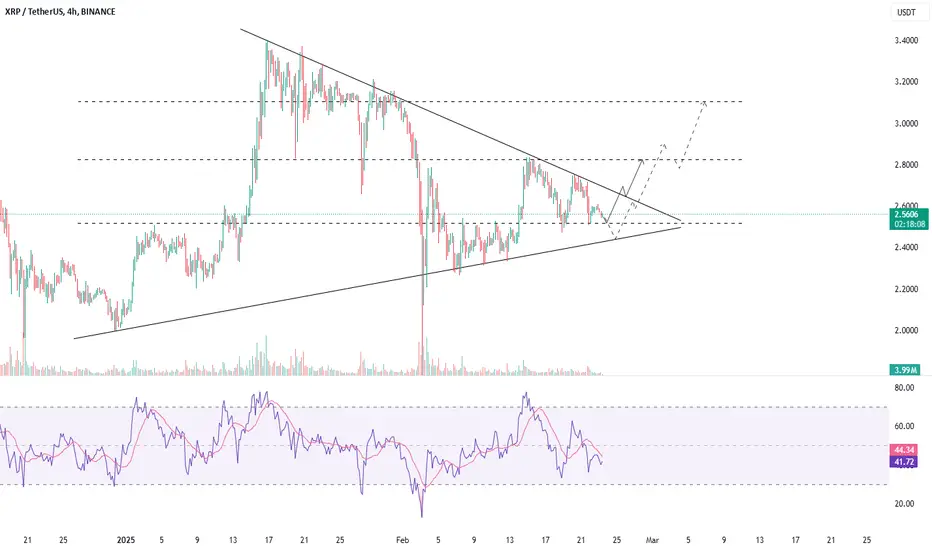
XRPUSDT - FORMING A BULLISH STRUCTURESymbol - XRPUSDT
CMP - 2.5500
XRPUSDT has been exhibiting a range-bound behavior recently, currently trading within a symmetrical triangle formation, indicating potential for a breakout in either direction. This pattern suggests that there is a convergence of support and resistance, and the price could move decisively once it breaks out of this range. Price is also forming a support area, suggesting a strong foundation for a potential upward move, especially if key levels are breached.
While the symmetrical triangle is a typical continuation pattern, the direction of the breakout is still uncertain due to the consolidation phase. Both upward and downward movements are possible depending on how the price interacts with key levels in the near term. I am closely monitoring the price action at these levels, as it could provide the clues necessary to gauge the next potential move.
From a fundamental perspective, the XRP market has seen some buzz surrounding the potential approval of an XRP-based ETF. This rumor has stirred investor sentiment, making the $2.83 level an important threshold. A break and consolidation above this level could trigger a continuation of the upside, especially if positive developments around the ETF rumor materialize. This could act as a major catalyst for a rally, especially if the broader market conditions remain favorable.
Key Support levels: $2.51, $2.00
Key Resistance levels: $2.83, $3.10
If XRP manages to break and hold above $2.83, it could initiate an upward push towards higher resistance levels, potentially igniting a stronger bullish momentum. However, caution should be exercised as the price could first face a retest of support before making any significant movement.
On the other hand, we should also keep an eye on the $2.51 - $2.48 level. A break of this support level could indicate a shift towards a downward trend, sending the price to test lower supports. However, if the price holds above this level, it could form a rebound, giving bulls another chance to push the price higher.
On both the daily and weekly timeframes, the consolidation following the recent rally remains a positive sign, suggesting that the upward momentum could resume once the price breaks out of the symmetrical triangle. As we navigate this phase, both long and short setups are still valid, depending on how the price behaves in relation to these key levels.
In summary, the market is in a phase of consolidation with a potential for upside movement if key resistance levels are cleared, especially with the underlying ETF rumors providing additional bullish sentiment. On the flip side, any breach of support levels could signal a corrective phase.
The Ascending Triangle Pattern: A Bullish Continuation GuideHello Traders!
In today's post, we’ll explore the Ascending Triangle Pattern , one of the most reliable bullish continuation patterns that traders look for during uptrends . It’s an important tool for identifying potential breakout points in trending markets. If you want to learn how to trade these breakouts effectively, mastering the Ascending Triangle is essential.
Chart Pattern: The Ascending Triangle is a strong bullish continuation pattern. In the case of ASIAN PAINTS LTD , we see the price action forming a flat resistance at the top and a rising upward sloping support at the bottom, indicating that the bulls are gradually taking control of the stock.
Key Points to Note:
The stock is respecting the flat resistance , which has been tested multiple times (marked by the red circles).
The upward sloping support is strengthening with each new low, showing growing buying pressure.
The price has recently broken out above the resistance , confirming the breakout pattern.
Trading Strategy:
Entry Point : Once the price breaks the resistance level, consider entering at 1,172.45 .
Stop Loss : Set your stop loss just below the upward sloping support at 1,151.25 to manage risk.
Profit Target : The ideal target after the breakout is approximately 1,261.65 , which is calculated by measuring the height of the triangle and projecting it upward from the breakout point.
Real-World Application:
This is a bullish setup , and traders should keep an eye on volume confirmation post-breakout. A breakout with increased volume would make the setup even stronger. A price move towards the target of 1,261.65 would indicate a successful breakout trade.
Risk Management:
Ensure that you follow your stop loss at 1,151.25 to avoid unnecessary losses in case the breakout fails.
Position size properly to align with your risk tolerance and the potential reward.
What This Means for Traders:
Bullish Setup : The ascending triangle signals that the bulls have control, and we expect the stock to continue higher.
Watch for confirmation of the breakout and enter with confidence, but always be prepared with your stop loss.
Conclusion:
This ascending triangle is a classic pattern, and it offers a great opportunity for long traders . Keep an eye on the breakout, manage your risk, and this trade could potentially yield solid returns.

#MOVR Buy Setup#MOVR breaks out the ascending triangle in 4h TF. Breakout above the 200EMA and candle close would trigger a 20-30% rally..

Nifty - Expiry day analysis Feb 20Price was moving in a range for the past few days and in that process has created a channel pattern. Also I can see a triangle inside the channel.
Buy above 22920 with the stop loss of 22880 for the targets 22960, 23000, 23040, 23100 and 23160.
Sell below 22840 with the stop loss of 22880 for the targets 22800, 22760, 22700 and 22660.
As per daily chart price is at support.
Always do your own analysis before taking any trade.
