TITAN BULLISH RECTANGLE PATTERNTitan forms a bullish rectangle pattern with strong breakout. The target has been given based on the size of the rectangle formed. Target expectation is around 1786
Triangle

Ascending Triangle Chart Pattern (Continuation Pattern)An ascending triangle is a chart pattern used in technical analysis. It is created by price moves that allow for a horizontal line to be drawn along the swing highs, and a rising trendline to be drawn along the swing lows. The two lines form a triangle. Traders often watch for breakouts from triangle patterns. The breakout can occur to the upside or downside. Ascending triangles are often called continuation patterns since the price will typically breakout in the same direction as the trend that was in place just prior to the triangle forming.
Important Points to look at -
The trendlines of a triangle need to run along at least two swing highs and two swing lows.
Ascending triangles are considered a continuation pattern, as the price will typically breakout of the triangle in the price direction prevailing before the triangle. Although, this won't always occur. A breakout in any direction is noteworthy.
Increasing volume helps to confirm the breakout, as it shows rising interest as the price moves out of the pattern.
A minimum of two swing highs and two swing lows are required to form the ascending triangle's trendlines. But, a greater number of trendline touches tends to produce more reliable trading results. Since the trendlines are converging on one another, if the price continues to move within a triangle for multiple swings the price action becomes more coiled, likely leading to a stronger eventual breakout.
A triangle is a type of consolidation, and therefore volume tends to contract during an ascending triangle. As mentioned, traders look for volume to increase on a breakout, as this helps confirm the price is likely to keep heading in the breakout direction. If the price breaks out on low volume, that is a warning sign that the breakout lacks strength. This could mean the price will move back into the pattern. This is called a false breakout.
$ = Liquidity

relaince triangle breakout Reliance has given triangle break out . we can target for 25% gain from the break out ie 2750 rs in comming days

IGL BUY Looks like a triangle breakout in IGL on Day Chart with good risk to reward ratio.
All levels are mentioned in the chart.
BUY at CMP (525) WITH SL 499 , TARGET 590++
***********************************************************
Please trade at your own conviction.

Ascending Triangle and Rounding Bottom with Big Potential growthAll the details are being uploaded in video, kindly refer it.


ZENTECH Symmetrical Triangle BreakoutZENTECH has given breakout at 85 level with high volume, looks like it is going towards 110 level. before that it can swiftly reach 100 level. Central Pivot Range narrowed out of last 3 months. Contraction in CPR indicate a trend ahead
last 3 months it consolidated between 70-85 levels.
RSI closed above 60, i.e 67 on daily scale, indicating strong bulishness.
MACD has buy signal.

BANKNIFTYContinuously it has been forming breakout patterns.
Buying at every dip.
Breakout will decide further trend.

Exide IndustriesBuy above 178.50
Target: 192, 208, 232+
SL: 161
Time Frame: 3-5 Months
Risk is yours and Reward is too yours totally.


Descending Triangle Pattern in WHIRLPOOLThis stock is making lower highs with same low level on daily chart by forming a Descending triangle, breaking 2000 level will open the downside upto 1800 level. as this Sep-2020 quarter results were weak. it could likely break downside.

💡Ascending Triangle in ZECUSD - "Learn More Earn More" With USAscending Triangle Definition:
An ascending triangle is a type of triangle chart pattern that occurs
when there is a resistance level and a slope of higher lows .
It is defined by two lines:
. A horizontal resistance line running through peaks.
. An uptrend line drawn through the bottoms.
The higher lows indicate more buyers are gradually entering the market
and buying pressure increases as price consolidates moving further towards the apex.
An ascending triangle is classified as a continuation chart pattern .
If price can break through the resistance level, that level will now act as a support level.
Breakouts can also happen in both directions. Statistically,
upward breakouts are more likely to occur, but downward ones seem to be more reliable.
In most cases, the buyers will win this battle and the price will break out past the resistance.
But Sometimes the resistance level is too strong,
and there is simply not enough buying power to push it through.
Therefore you should be ready for movement in EITHER direction.
ENTRY:
We would set an entry order above the resistance line and below the slope of the higher lows .
TARGET:
Target is approximately the same distance as the height of the triangle formation.
❤️ If you find this helpful and want more FREE forecasts in TradingView
. . . . . Please show your support back,
. . . . . . . . Hit the 👍 LIKE button,
. . . . . . . . . . Drop some feedback below in the comment!
❤️ Your Support is very much 🙏 appreciated! ❤️
💎 Want us to help you become a better Forex trader ?
Now, It's your turn !
Be sure to leave a comment let us know how you see this opportunity and forecast.
Trade well, ❤️
ForecastCity English Support Team ❤️

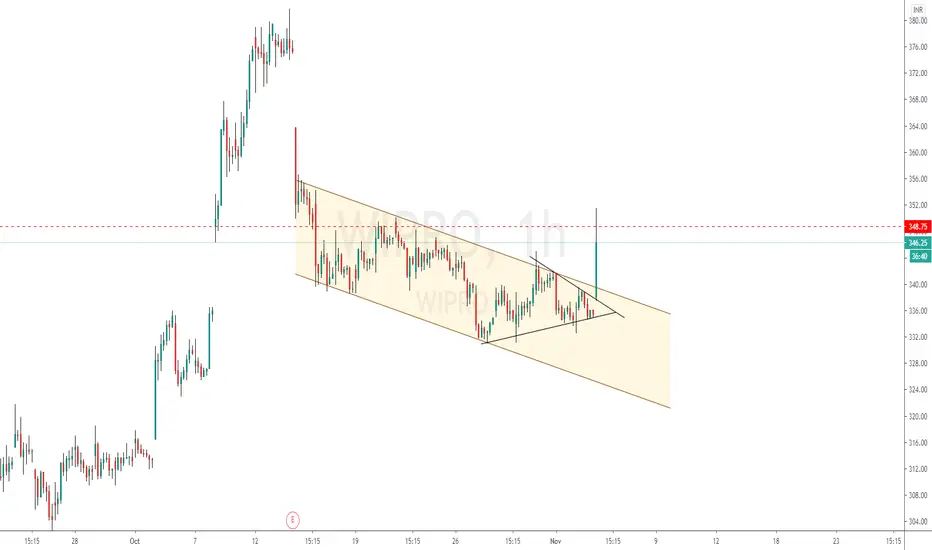
Finding this kind of patterns early is the keyPrice formed a falling channel which has the character to break up and again the second confirmation is the triangle pattern inside the channel which was broken today.
That was a big miss, easy miss, lazy miss !!!
If you find my analysis helpful . . . . . Please show your support by hitting 👍 LIKE button,
Your Support is very much 🙏 appreciated!

Nifty Outlook- Ascending Triangle (Trading Plan) (22nd Oct2020)Traditional Chart Pattern- Ascending Triangle Discussed along with trading strategies in Hindi & English both. Thanks for watching the video
Active Currently - Plan A - Sell Below 11955 for 11790-11810 target zone (Stops- 11960)
Plan B- Buy in 11790-11810 with stops below 11750/11760 for target zone 11980-12000
Plan C- Sell Below (Strictly Stops above 12025) for target zone 11870-11880
Plan D- Buy in 11850-11875 with stops below 11790 target 12025 / 12250 +

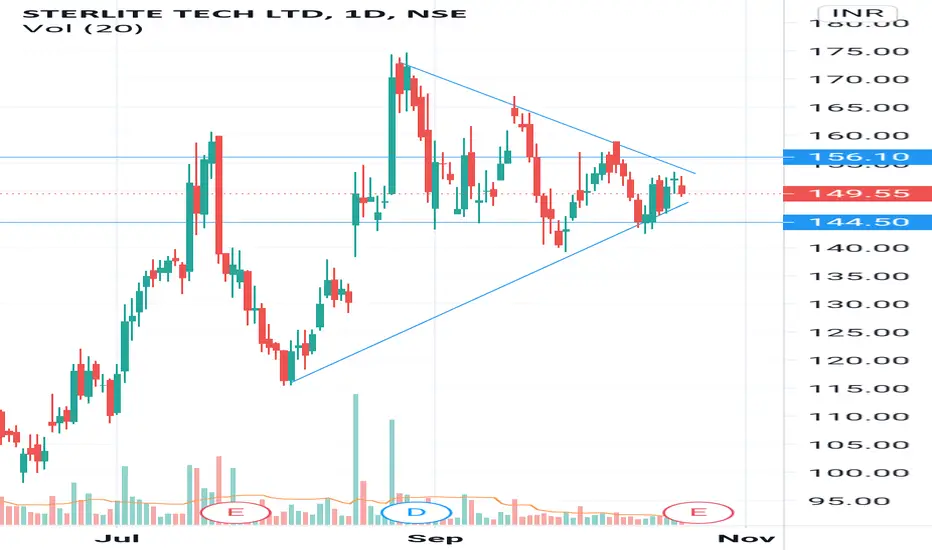
Sterlite tech Ltd - symmetric triangle formationCMP - 149.55
Bull position above - 156.1
Bear position below - 144.5
Ascending Triangular Chart Pattern, Trading is all about skill Ascending chart pattern is a type of Triangle chart patterns . Ascending chart pattern is formed when price has a resistance and is forming continuous higher lows. Adequate buy or short area would be after the price gives a breakout .Ascending pattern you can short or buy as well . Wait for the price to give a breakout and enter in which ever direction the breakout is given .
Please Share , Follow and Like if this content was useful and you gained some knowledge.

BANKNIFTY Forming a Symmetrical triangle on weeklyly As u can see bank nifty rejected from trendline again this week is down for bank nifty but it also forming an symmetrical triangle pattern lets see where it goes !
This is for educational purposes only!

