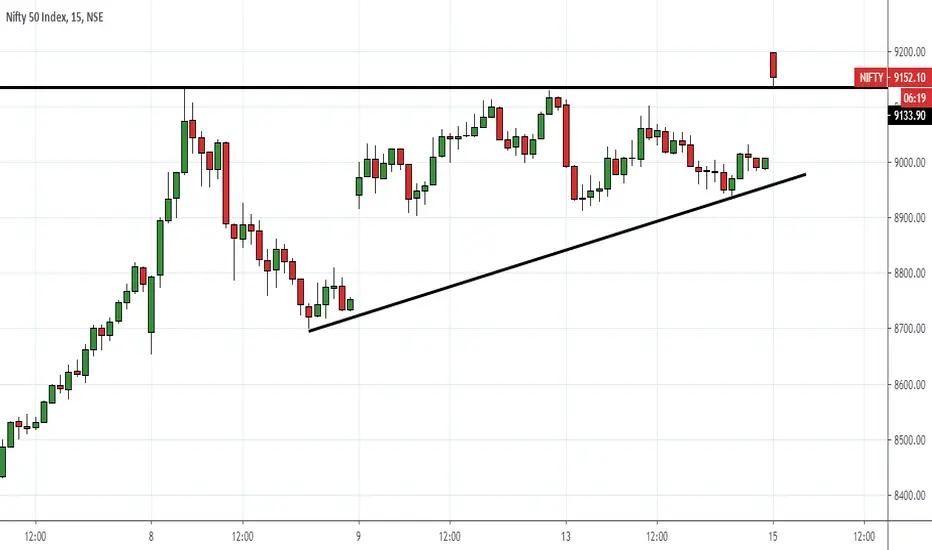
Triangle

Triangular PatternInfosys is forming higher highs and higher lows in a ascending triangular pattern. Check for break out and thank me later.
For analysis of any other stock, just drop a message.
This is just an analysis.

Missed BD in M&M, however captured 5 pointsI have selected M&M yesterday for Today session(8th June 20) since it was forming a nice pattern in 15min TF.
I missed the BD, however i have entered once price crossed the pink line(previous day low) and got 5 points. Target was the green line(day before yesterday low).
Entry - 474.9
Exit - 469.5
Please like & comment, if you learn something from this post.


Torrent PharmaUpdated earlier about the Triangle and is now working out very precisely. 2450 is the SL it seems now.

Triangle Special - CumminsIndPrice action is consolidating inside a triangle. Getting ready for the break out.

Torrent Pharma: Symmetrical TriangleStock is showing a strong momentum. It has been taking support at its 20 EMA. A formation of a Symmetrical Triangle is seen in Wave (iv) which if broken we may see a decent rally towards 2800 levels.

BHARTI AIRTELIt has given a triangle breakout which is suggesting 565-570 as long as it remains above 532


Short USDINR Downtrend Continuation Day 2Sometimes simplicity is just the key to success.
Previous Channel and Current pattern in downtrend confirmed a bearish continuation again. This post is just to encourage you that you can earn with just simple analysis.
A 'Symmetric Triangle' breaking downside in a downtrend confirms that bulls have been tired and couldn't take the price up again. This is a confirmation for Downtrend Continuation . With this knowledge and waiting for a price action on charts can give you better results. RSI also gave a confirmation which increased the probability of success. You do not need advanced knowledge about indicators and patterns for this.
Analyse the given Entry point, SL, TGT, S&R . Most importantly just try to Trail SL below your entry point whenever possible.
#Tgt1 achieved easily and RR more than 1.5
(PS: Couldn't post earlier due to technical isuues)
This explanation is only for educational purpose and isn't any kind of recommendation. Don't take any action based on this explanation itself. Consider your financial advisor before taking any trades.
Thanks for your time. Happy Trading and Learn something new Everyday.


Estimated bullish run in USD/INR As per the pattern, dollar might show a steep rise (60-85° angle) in near future. As per the known situations, in long term dollar may face a sharp fall but before that if the pattern breaks out on chart, dollar can witness a sharp bullish rally for a short term.
This explanation is only for educational purpose and isn't any kind of recommendation. Don't take any action based on this explanation itself.
Consider your financial advisor before taking any trades.
Thanks for your time. Happy Trading.

The Big fall of 2020 was predictable - Supporting Charts 1In my previous chart, I have discussed how Nifty 50 had a strong bearish breakout. Now I will be making supporting charts which could have been used to confirm the trend.
RIL is a heavyweight stock of Nifty 50 & perhaps has a high correlation.
NSE: RIL is been making beautiful triangular pattern on the daily period chart.
There was a breakout of EMA ( 200 Days ): RIL took support on 200 days EMA 3 times where it was completing its triangular pattern.
Finally, on the third, it broke its support.
(Please read " The 3-Day rule by Martin Schwartz) - This will give you a better understanding of what I am talking about.

Ascending Triangle Breakout for ASHOKLEYAshokley is trying to break 46.45 level. it closes above that level it can rally upto 51 level

