Symmetrical triangle breakdown in CANFINHOMECANFINHOMES LTD
Key highlights: 💡⚡
✅On 1 HOUR Time Frame Stock Showing Breakdown of Symmetrical triangle Pattern .
✅Strong bearish Candlestick Form on this timeframe.
✅It can give movement up to the Breakdown target of 680-.
✅Can Go short in this stock by placing a stop loss above 755+.
Triangle

Hatsun-One more Agrochem stock on verge of breakoutHatsun agro has given good volume bounce today from trendline. Above 1200, we can see this stock flying.
However, this stock forms long wicks hence it is safe to wait for weekly closing above 1200 for a safe investments.
Keep in radar. Agro stocks normally give big moves before monsoon arrives.

Oil and Gas about to break four times tested weak resistanceDTL BO (Down Trend Line Breakout)
Even Oil N Gas stocks are also setting up to move :
ONGC (being my fav with good results, check older posts), Oil Ind, HPCL, BPCL, IOC, Gulf OIl.


[Swing Trade] ALLCARGOALLCARGO - is about to give a good BO after long time..expecting it to reach 100+ in this run..
I will enter the trade once I get confirmation of BO, volume and with some retracement. I dont recommend others to trade on my views.

[Swing Trade] INDIANB BOINDIANB had nice BO with good volumes. Retracement is also done..Looking to take a position but just avoiding till elections.

ABCAPITAL - Triangle PatternABCAPITAL is making a Triangle Pattern at 2hr Chart, now 208 has become a support after the previous Resistance. Probability of going up for 240 target.
It has taken support at lower Trendline for 4-5 times. If it doesn't break the upper trendline now, then it may again touchdown 214-218 and reverse from there.
For learning and education purpose only!

PNB HOUSING - Swing Trade Analysis - 26th May #stocksPNB HOUSING (1W TF) - Swing Trade Analysis given on 26th May, 2024
Pattern: ASCENDING TRIANGLE BREAKOUT
- Trendline Support with Strong Pullback Candle - Done ✓
- Weekly Volume Buildup at Resistance - Done ✓
- Demand Zone Retest & Consolidation - In Progress
* Disclaimer

INOX WIND - TRIANGLE PATTERNINOX WIND is making a Triangle Pattern at Daily chart. It is at Resistance level, if breaks then we may see 200 soon, moving above 9EMA.
Scenario 2: If it comes down then it will take support at 150 and from there we may see reversal towards 200.
For learning and educational purpose only.

RPTECH a IPO stock's results out, what next for the stock?Results:
Decent comeback quarter with solid revenue growth which reflects well with EBITDA n PAT growing at better pace
Rev at 3002cr vs 2258cr
PBT at 45cr vs 37cr, Q3 at 33cr
PAT at 47cr vs 23cr, Q3 at 24cr
Includes 10cr one off income
OCF at -102cr vs -114cr
TA:
-Check vol on falls(red arrows) how it is decreasing means supply drying out
-DTL BO (Down Trendline Breakout) anticipation
-VCP in play
Buying area above Pivt Point (PP: least area of resistance) 336.8 (Cheat entry) with anticipation of BO.

UFLEX - Weekly AnalysisIn the Weekly Chart of UFLEX ,
we can see that, it is inside Triangle.
Also it is trying to bullish after consolidation.
Enter on breaking Candle's with Low as SL.
Expected momentum is shown in chart.


Metropolis - Breakout in 1D timeframeMetropolis gave breakout and retesting the trendline. We can expect a huge move from here.
Note: Sharing only for educational purpose

ACC - Looks good for up side in short termACC gave a break out in triangle pattern in 2 hour time frame. Expecting it will reach 2700 in short term period
Note: Sharing only for educational purpose

IRFC HAS BROKEN OUT OF A TRIANGLE. TIME TO BUYIRFC after having a stellar run from December 2023 made a high of 192.80 on 23 January and started falling from then on.
It broke the triangle formation with less than average volume on 23rd April.
The region between 148 and 152 which was the resistance zone was finally broken with good volumes on 26th April.
Safe traders can wait for a pull back between 148 -152 to initiate trade for a Target of Rs 190.

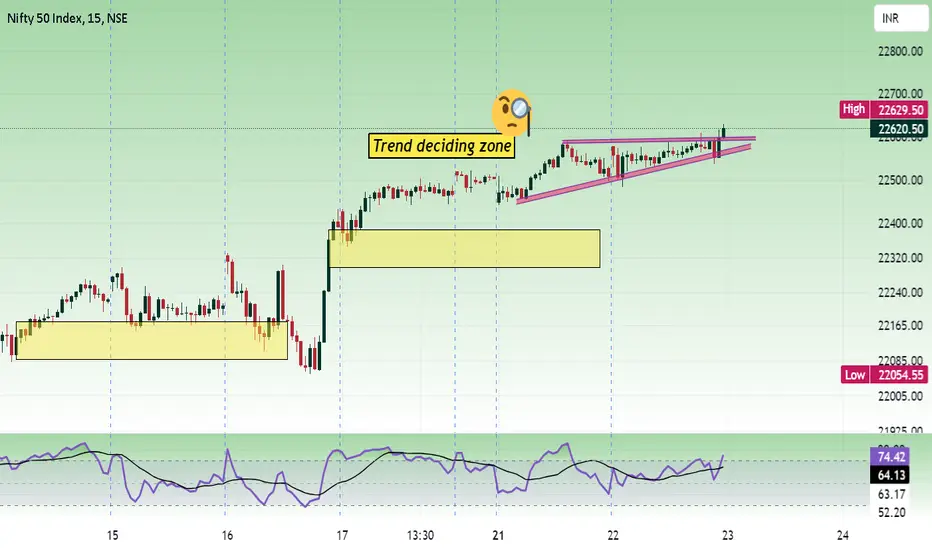
Mighty Nifty - May 23Price was consolidating in a narrow range and gave last hour break out. Will it sustain?
Pattern : Ascending triangle.
Range : Medium.
Trend strength : Normal.
Buy Above : 22600.
Stop Loss : 22560.
Targets : 22640, 22680, 22720 and 22780.
Sell below : 22480.
Stop Loss : 22520.
Targets : 22440, 22400 and 22360.
Check the live market updates.
Hit the like button to Rock !! Show some energy !!
Note : This is my pre market analysis and my trading journal. Not a suggestion to buy or sell.
You are responsible for whatever you do.
ENGINEERS INDIA - Swing Trade Analysis - 29th April #stocksENGINEERS INDIA (1D TF) - Swing Trade Analysis given on 29th April, 2024
Pattern: ASCENDING TRIANGLE
- Volume Buildup at Resistance - Done ✓
- Daily Resistance Breakout - In Progress
- Demand Zone Retest & Consolidation - In Progress
* Disclaimer

GoldPrice is consolidating and the important support is seen at 2405 - 2410. Price has formed a descending triangle pattern. If it breaks the support, then we can expect at least 20 points fall.
Buy above 2410 with the stop loss of 2404 for the targets 2418, 2430 and 2444.
Sell below 2398 with the stop loss of 2404 for the targets 2392, 2384 and 2376.
Even the price fall, remember the main trend is positive and it is a pull back. Always use stop orders to protect your capital.
Check the live market updates.
Hit the like button to Rock !! Show some energy !!
Note : This is my pre market analysis and my trading journal. Not a suggestion to buy or sell.
You are responsible for whatever you do.

GARDEN REACH Cmp 958 Triangle BOGARDEN REACH Cmp 958 dated 23-4-2024
Weekly Chart
1. Triangle BO @ 975
2. Price Rise with Volumes
Buy above 975 & dips till 900 target 1350 SL 820
it is just a view, please trade at your own risk.

IRB INFRASTRUCTURE - Swing Trade Analysis - 7th April #stocksIRB INFRASTRUCTURE (1D TF) - Swing Trade Analysis given on 7th April, 2024
Pattern: SYMMETRICAL TRIANGLE BREAKOUT
- Trendline Resistance Breakout - Done ✓
- Volume buildup at Resistance - Done ✓
- Demand Zone Retest & Consolidation - Done ✓
#IRB #INFRA #NIFTYINFRA

NMDC STEEL IN A TRIANGLE FORMATION. WAIT FOR BREAK OUTNMDC STEEL is making a Triangle formation. Wait for Breakout.

AZAD ENGINEERING - Swing Trade - 21st May #stocksAZAD ENGINEERING (1D TF) - Swing Trade Analysis given on 21st May, 2024
Pattern: ASCENDING TRIANGLE BREAKOUT
- Resistance Breakout - Done ✓
- Volume Buildup at Resistance- Done ✓
- Change of Polarity - Done ✓
* Disclaimer

BREAKOUT IN DHAN BANK 📌SWING TRADE FOR NEXT WEEK🚀
Hello Traders⚡
I am a Swing Trader by Passion i only trade on Momentum Stock's.
📌I Post Daily SWING CHARTS Analysis on My Trading view profile..
So let's Start
📌TRADE ANALYSIS OF -DHAN BANK-
• Potential Breakout Chart
• VCP Pattern
• Short Range Consolidation
• Price Can Take Retest from support Line
• Overall The Price Is Moving In HH-HL Formation
• Volume Buildup Near BO Zone
• Looks Good For 10-20% Upside Levels After The Breakout
📌 If you have any questions about any stock you can comment on post 📱
📌Disclaimer:-
This all charts analysis are only for educational purposes only
I do not provide any CALL or Tips
