XAUUSD - Flag PatternWhats your take on Guys.
#Institutions Consolidation going on - #Accumulation or #Distribution.
Kind of #Triangle #pattern in formation, ##Flagpattern. DO your analysis, Enter trade on Breakout and confirmation side. Trade with #confluence. i would say accumulate at bottom of pattern with SL and Participate in full swing before #Breakout.
Triangle

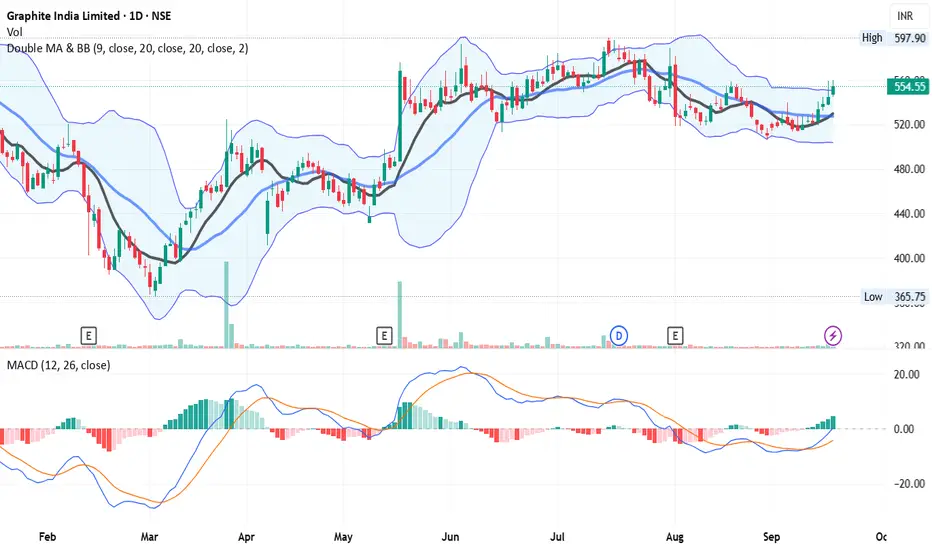
Breakout - Looks Good On Chart - GRAPHITE📊 Script: GRAPHITE
📊 Industry: Industrial Products (Electrodes & Refractories)
Key highlights: 💡⚡
📈 Script is trading at upper band of BB.
📈 MACD is giving crossover .
📈 Crossover in Double Moving Averages.
📈 Right now RSI is around 63.
📈 One can go for Swing Trade.
📈 In Monthly Chart It Script is forming Symmetrical triangle and about to give breakout, we can see good rally in future.
⏱️ C.M.P 📑💰- 555
🟢 Target 🎯🏆 - 578 / 597
⚠️ Stoploss ☠️🚫 - 539
⚠️ Important: Always maintain your Risk & Reward Ratio.
✅Like and follow to never miss a new idea!✅
Disclaimer: I am not SEBI Registered Advisor. My posts are purely for training and educational purposes.
Eat🍜 Sleep😴 TradingView📈 Repeat 🔁
Happy learning with trading. Cheers!🥂
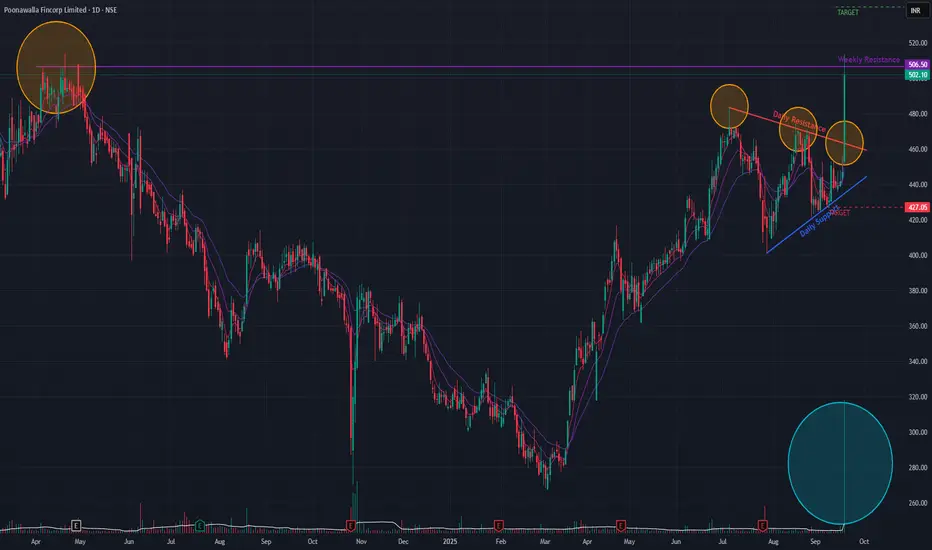
Poonawalla Fincorp (Daily) - Potential ATH ?Poonawalla Fincorp has shown a significant bullish development, decisively breaking out of a Triangle continuation pattern today. This breakout was marked by a substantial 12.30% surge in price , backed by exceptionally high trading volume.
This move signals a potential continuation of the bullish run that began in March 2025, which itself was a reversal of a downtrend initiated by a Double-Top bearish pattern in April 2024.
Bullish Confirmation Signals 👍
The positive outlook is supported by several key indicators:
- Breakout Volume: The price surge was accompanied by a massive spike in volume , indicating strong conviction and participation from buyers.
- Momentum: Short-term Exponential Moving Averages (EMAs) have formed a positive crossover , confirming the renewed bullish momentum in the immediate term.
Immediate Hurdle Ahead 🚧
Despite the strong breakout, the stock is now trading at a crucial long-term resistance level . Overcoming this barrier is essential for the upward trend to continue.
Future Outlook and Scenarios
- Bullish Case 📈: If the upward momentum is sustained and the stock successfully breaks through the current long-term resistance, it could clear the path to test its all-time high . An initial price target in this scenario would be the ₹539 level.
- Bearish Case 📉: Conversely, if the stock fails to breach this resistance, the momentum could fade, potentially leading to a price correction towards the ₹427 support level.
Watchout for the price-action in the next few sessions !!
HYUNDAI : Breakout stock (Swing pick)#HYUNDAI #swingtrade #momentumtrade #breakoutstock #trendingstock
HYUNDAI : Swing trade
>> Breakout with Volume
>> Trending Stock
>> Momentum Trade
>> Volatility contraction seen
>> Good Strength in Stock
Swing Traders can lock profit at 10% and keep Trailing
Please Boost, comment and follow us for more Learnings.
Disc : Charts shared are for learning purpose only, not a Trade recommendation. Do your own research and consult your financial advisor before taking any position.

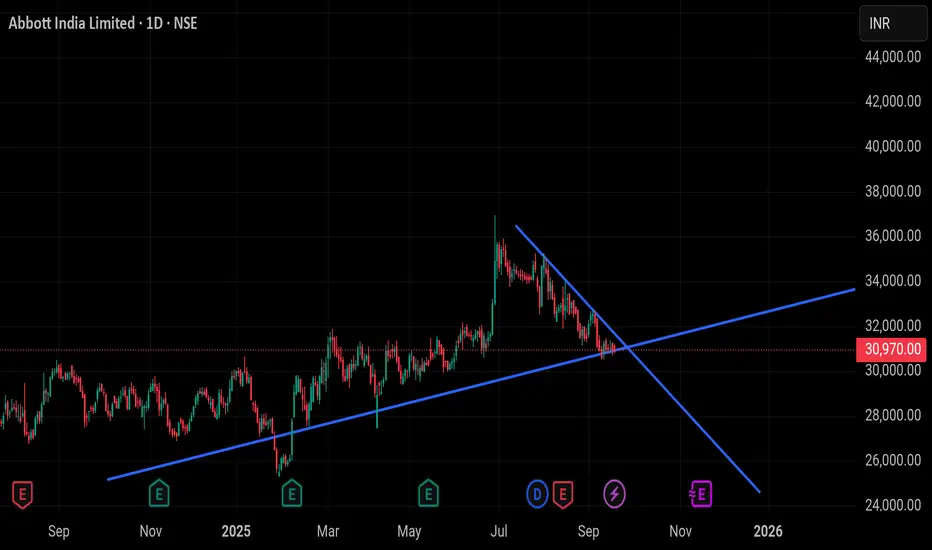
Abbott is showing strengthAbbott showing breakout of a triangle pattern. Keep it on radar.
** Not a buy/ sell recommendation just for study purpose.
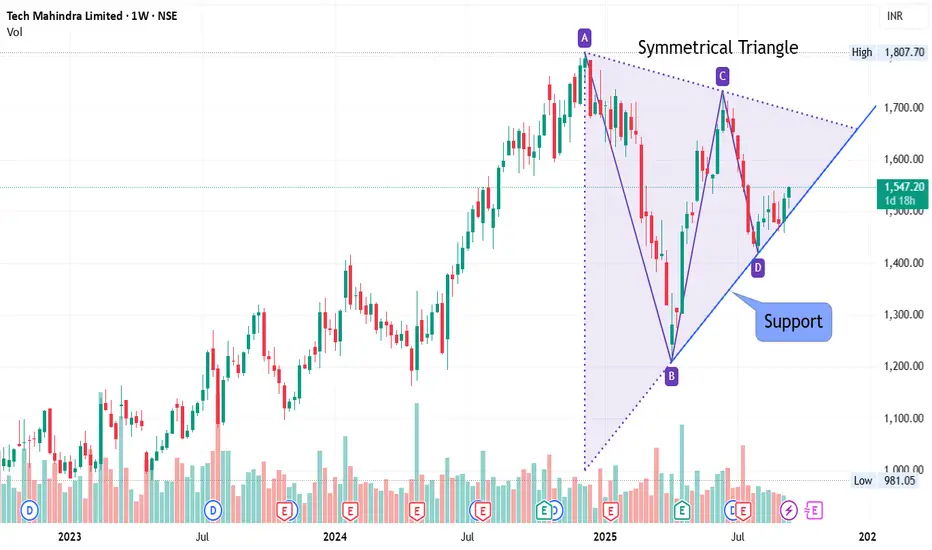
At Support - Weekly Chart - TECHM📊 Script: TECHM
📊 Industry: IT - Software (Computers - Software & Consulting)
Key highlights: 💡⚡
📈On Weekly Chart Script is forming symmetrical triangle and trading near support line.
📈 Script is trading at upper band of BB.
📈 MACD and Double Moving Averages are giving Crossover
📈 Right now RSI is around 58.
📈 One can go for Swing Trade.
⏱️ C.M.P 📑💰- 1547
🟢 Target 🎯🏆 - 1612 / 1655
⚠️ Stoploss ☠️🚫 - 1499
⚠️ Important: Always maintain your Risk & Reward Ratio.
✅Like and follow to never miss a new idea!✅
Disclaimer: I am not SEBI Registered Advisor. My posts are purely for training and educational purposes.
Eat🍜 Sleep😴 TradingView📈 Repeat 🔁
Happy learning with trading. Cheers!🥂
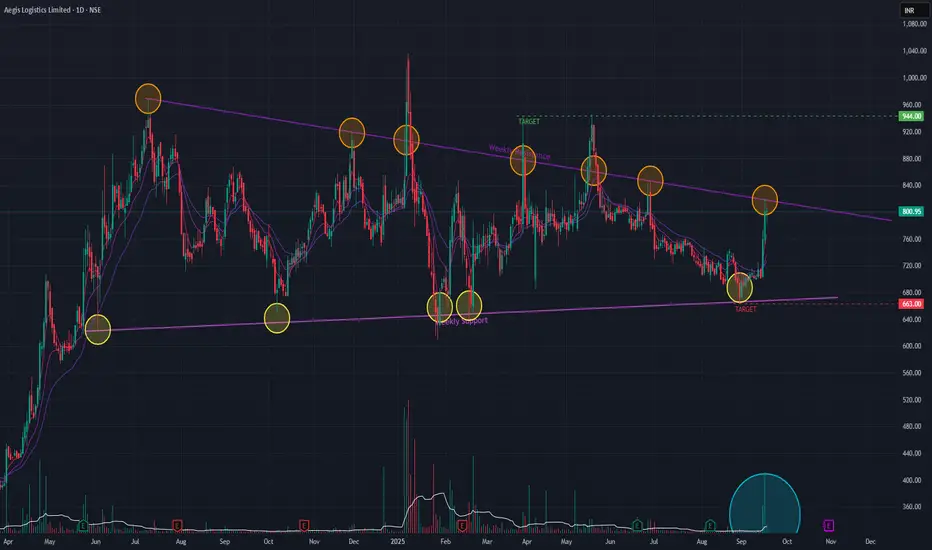
Aegis Logistics (Daily Timeframe) - Potential Breakout ??Following a strong uptrend that peaked in July 2024, Aegis Logistics entered a multi-month consolidation phase. Despite marking a new all-time high in January 2025, the stock lacked sustained upward momentum and has since formed a clear Symmetrical Triangle pattern . This pattern typically acts as a continuation signal, suggesting the prior uptrend is likely to resume.
Recent Bullish Momentum
This week, the stock has shown a significant surge in buying interest, rallying +14.05% on the back of very high trading volume. This powerful move towards the triangle's upper boundary indicates strengthening bullish sentiment and a potential impending breakout.
Indicator Analysis
On the daily chart, short-term Exponential Moving Averages (EMAs) have already registered a bullish crossover , confirming the immediate positive momentum. While the weekly EMAs are yet to confirm a similar crossover, they are aligning positively, suggesting a longer-term bullish signal may be forming.
Future Outlook & Key Levels
The direction of the next major move hinges on the resolution of this triangle pattern.
Bullish Scenario: A decisive breakout and close above the triangle's upper trendline would confirm the pattern's continuation. The primary upside target in this case is ₹944 .
Bearish Scenario: If the stock fails to break out and instead breaches the lower trendline of the triangle, the bullish thesis would be invalidated. The key support level to watch on the downside would be ₹663 .
Watchout for the Price-action !!
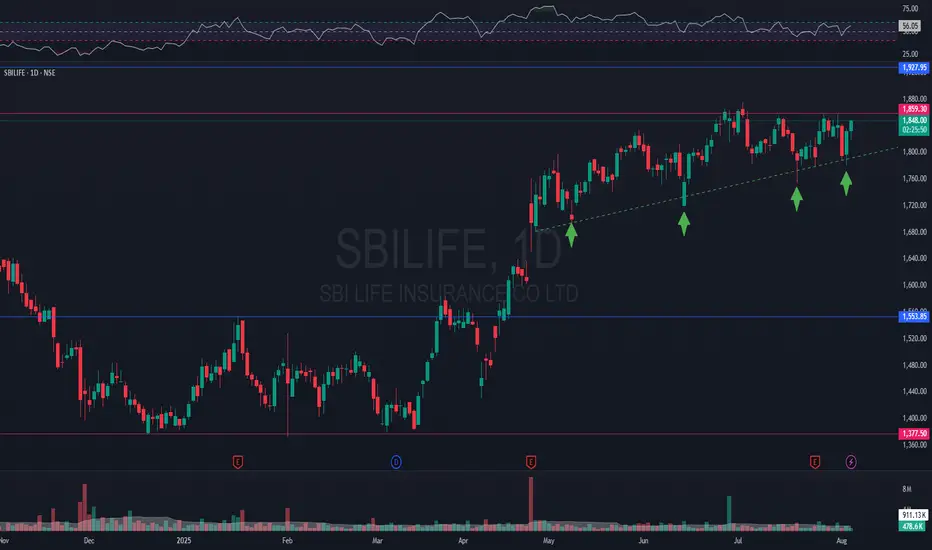
Ascending Triangle Breakout on #SBILIFE#SBILIFE is showing clear signs of a strong breakout from current levels.
The ascending trendline has supported the price since 09MAY25. The price continued to hold near the levels of 1855, with every red candle bought in.
Yesterday, i.e. 04AUG15 was a good day to initiate accumulation. In our view, price is expected to move sharply once the daily/weekly candle closes above 1860 with supporting volumes.
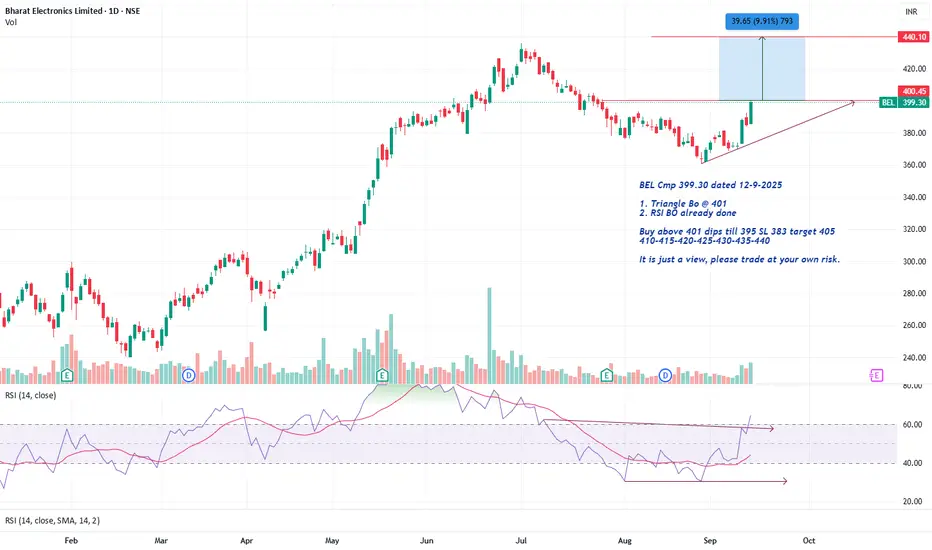
BEL Cmp 399.30 Triangle BOBEL Cmp 399.30 dated 12-9-2025
1. Triangle Bo @ 401
2. RSI BO already done
Buy above 401 dips till 395 SL 383 target 405
410-415-420-425-430-435-440
It is just a view, please trade at your own risk.
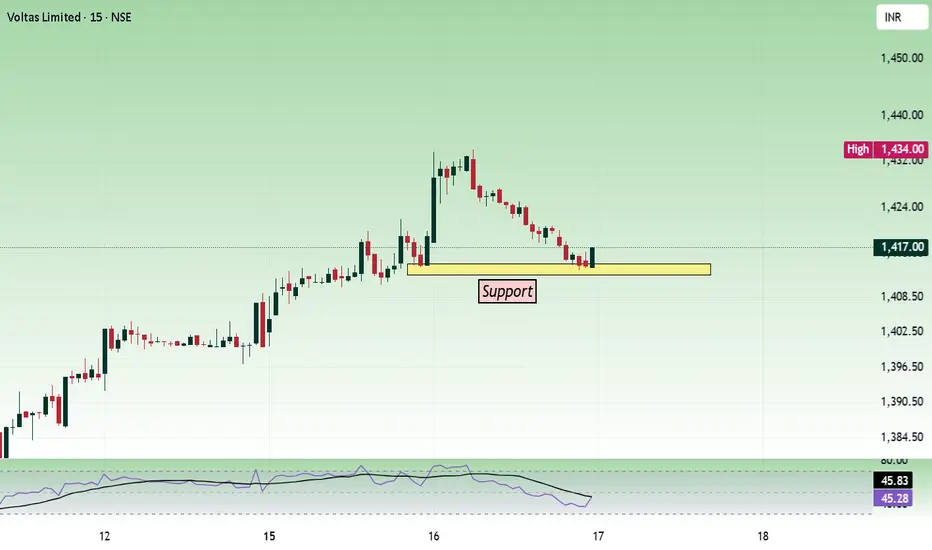
VoltasPrice is facing double top resistance at the 1434 - 1438 zone and had a pullback towards the 1410 zone. Nearby strong support is at 1400.
1400 and 1412 are buying(support) levels. Buy can be initiated depending on the price movement at these levels.
Buy above 1412 with the stop loss of 1400 for the targets 1422, 1430, 1442, 1454, and 1466.
If the price opens below 1410 and moves towards 1400, we can buy when the price shows bullish strength above 1400.
Price is bearish below 1400. Sell below 1395 with the stop loss of 1405 for the targets 1386, 1374, and 1362.
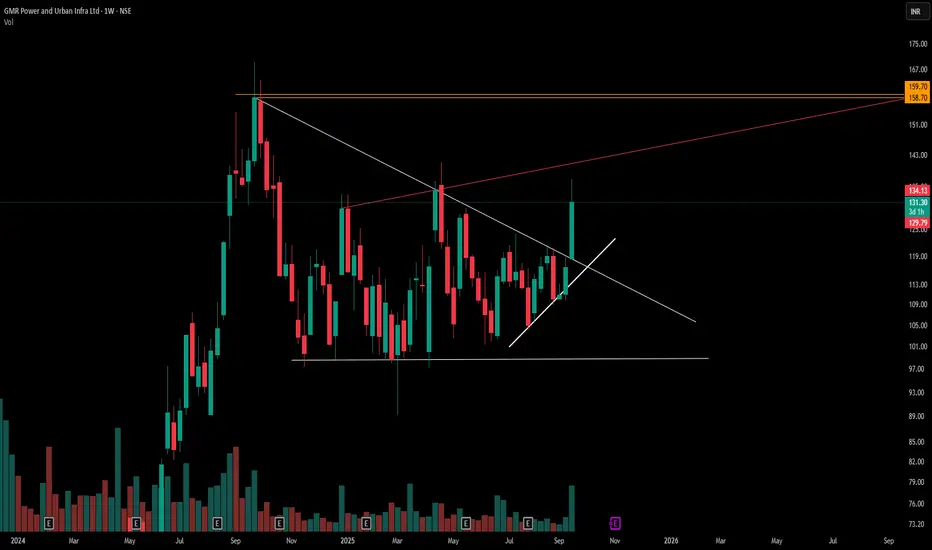
Multi-Pattern Mastery: Descending Triangle Meets Broadening FormThis chart demonstrates the power of multi-pattern recognition in technical study,showcasing how a descending triangle (white lines) can coexist with a broadening formation pattern (red ascending line with shared lower base). The descending triangle shows consistent lower highs against a stable support level, while the broadening pattern reveals expanding volatility through higher highs and the same lower boundary.
Patterns to Study :
Descending Triangles: Characterized by horizontal support and declining resistance, typically indicating bearish pressure building
Broadening Formations: Feature diverging trendlines creating a "megaphone" effect, signaling increased market volatility and indecision
Pattern Confluence: When multiple patterns share common elements (like the lower support base here), it creates stronger technical significance and potential reference points
Disclaimer: This content is for educational purposes only and does not constitute investment advice. Always conduct your own research before making any trading decisions.
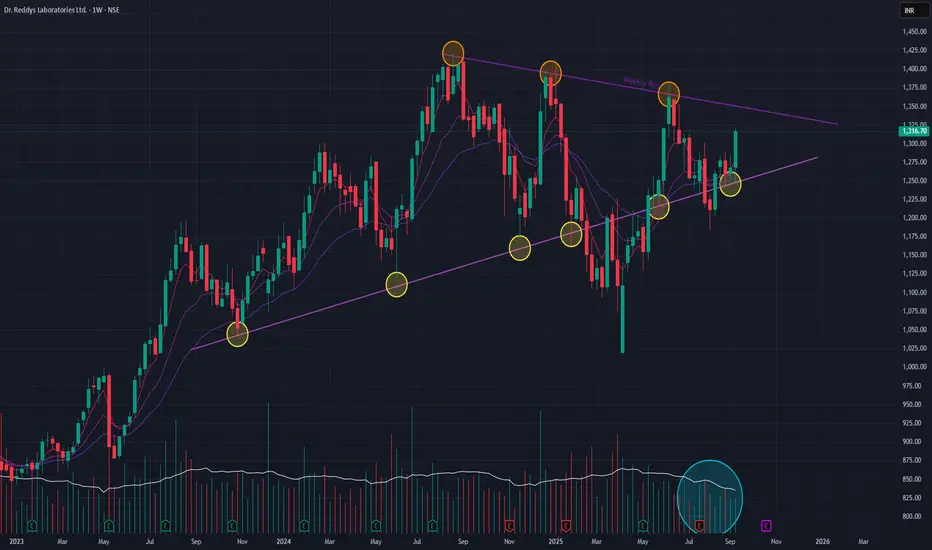
Dr. Reddy's (Weekly Timeframe) - Potential BreakOut?Dr. Reddy's Laboratories is currently in a phase of strategic consolidation. After a remarkable 93.63% uptrend that began in March 2022, the stock has settled into a well-defined triangle formation since August 2024. This pattern suggests a temporary equilibrium between buyers and sellers as the market digests previous gains.
The technical underpinnings remain constructive. The Positive Crossover (PCO) in the short-term EMAs provides a bullish undercurrent, and the resilience of key support levels indicates a solid foundation. The primary scenario we are monitoring is for a bullish continuation.
The key catalyst for the next leg up will be a volume-supported breakout above the triangle's resistance. Such a move would signal the end of the consolidation phase and could propel the stock towards retesting its All-Time High (ATH) . Investors should, however, remain watchful of the trading volume, as it will be the ultimate arbiter of the breakout's validity.
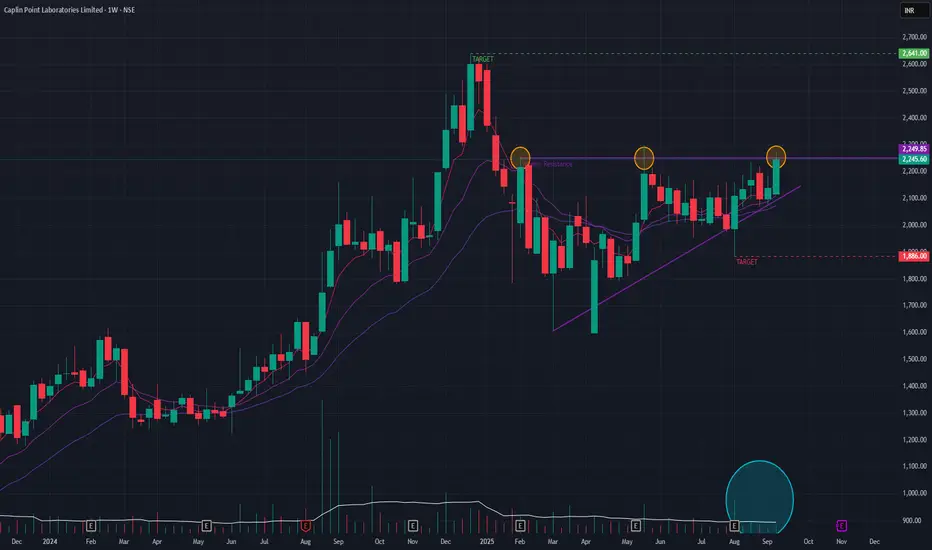
Caplin Point (Weekly Timeframe) - Will the uptrend continue ?After a brief downtrend, Caplin Point has formed a classic triangle pattern , which often acts as a continuation signal for the preceding long-term uptrend. Technical indicators are favorable, with the short-term EMAs arranged in a bullish formation that signals strong underlying momentum.
The one element of caution is that recent trading volumes have been average. Therefore, a breakout from the triangle must be accompanied by a significant increase in volume to validate buyer conviction. If such a breakout occurs, the next logical objective would be the all-time high, which also serves as a key resistance zone at ₹2640 . Conversely, if the pattern fails and momentum wanes, a pullback to the ₹1886 support level is possible.
Watchout for the price-action !!
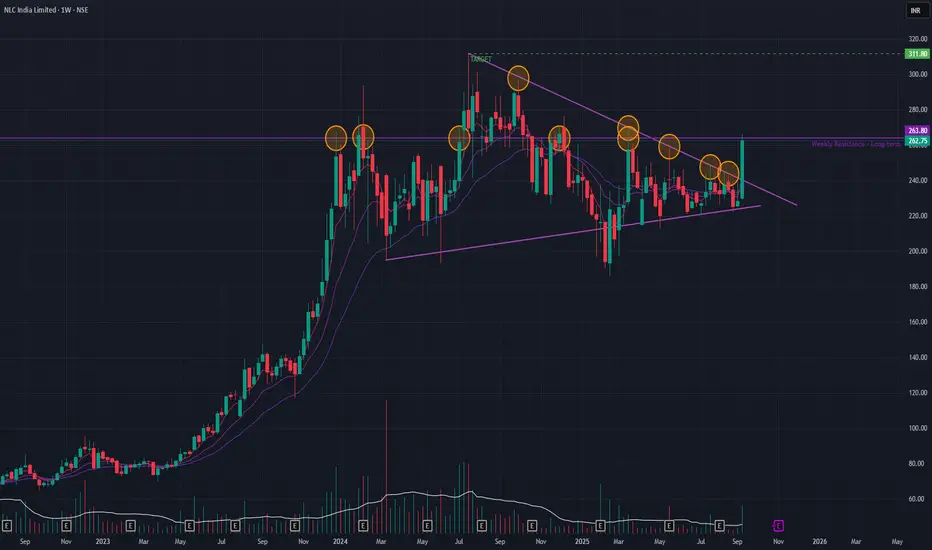
NLC India Ltd (Weekly Timeframe) - Potential BreakOut & ATH ??Following its all-time high, NLC India has been consolidating in a sideways pattern, which can be interpreted as a bullish triangle formation—often a precursor to an uptrend continuation. This thesis was strongly supported this past week by a powerful +14.97% rally on a massive volume spike, indicating a potential end to the consolidation phase.
However, the stock is now confronting a formidable, long-term horizontal resistance level that has been in place for over a decade (since December 2007). This same trendline has rejected multiple breakout attempts since December 2023. For the bullish momentum to translate into a new leg up, NLC India must decisively breach and hold above this historical barrier. A successful breakout could clear the path for a new all-time high and a near-term target of ₹311 .
Price-action will decide the way forward.
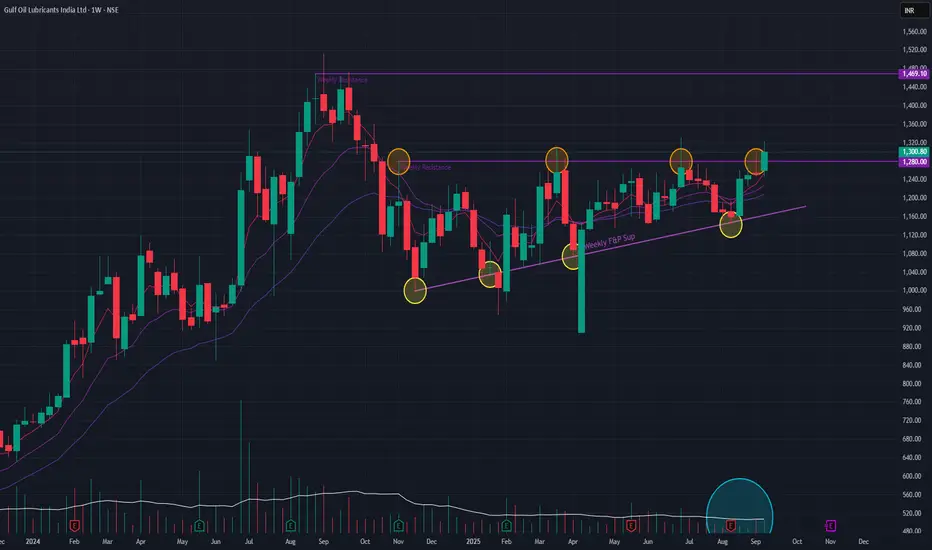
Gulf Oil (Weekly Timeframe) - Potential BreakOut & ContinuationTechnical analysis of Gulf Oil reveals a promising setup. The stock has formed a classic triangle pattern , indicating a period of consolidation before a likely continuation of its preceding uptrend. This week, we've observed a significant breakout attempt, which is notable as it follows multiple rejections from the pattern's upper trendline.
For this breakout to be considered valid, it must be accompanied by a surge in trading volume , confirming buyer conviction. If these conditions are met, the stock could challenge its all-time high of ₹1469 . Further reinforcing this positive sentiment, the short-term EMAs are in a bullish configuration, signaling that momentum is currently in favor of an upward move.
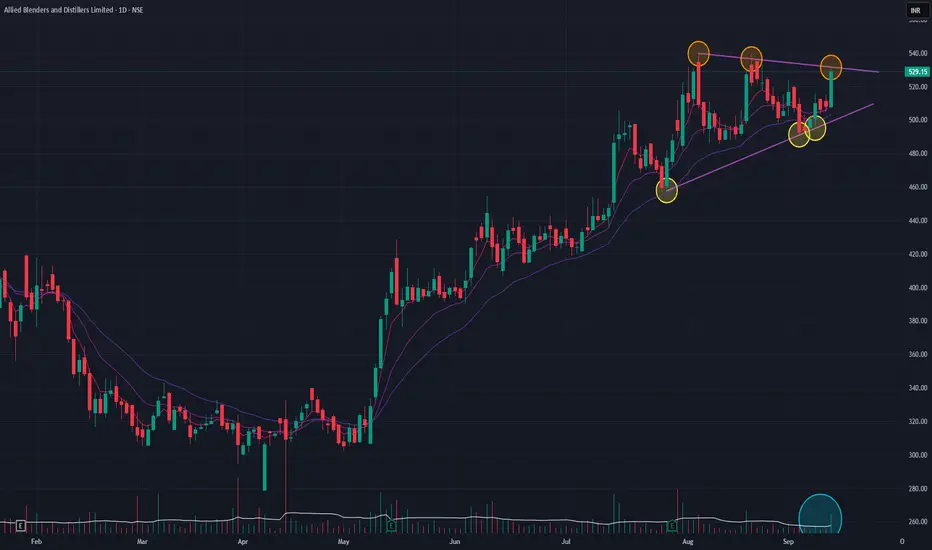
ABDL (Daily Timeframe) - Can it continue the uptrend ??ABDL is in a confirmed uptrend, having rallied over 90% since its April 2025 lows. The stock is now consolidating within a bullish triangle pattern , which typically signals a continuation of the prior trend.
This bullish outlook is supported by several key factors:
Today's significant price surge was accompanied by a massive spike in volume, confirming strong buyer interest and a potential breakout.
The short-term Exponential Moving Averages (EMAs) are in a Positive Crossover (PCO) state , indicating strong underlying momentum.
If the breakout from the triangle is sustained, the next potential price target is the ₹614 level.
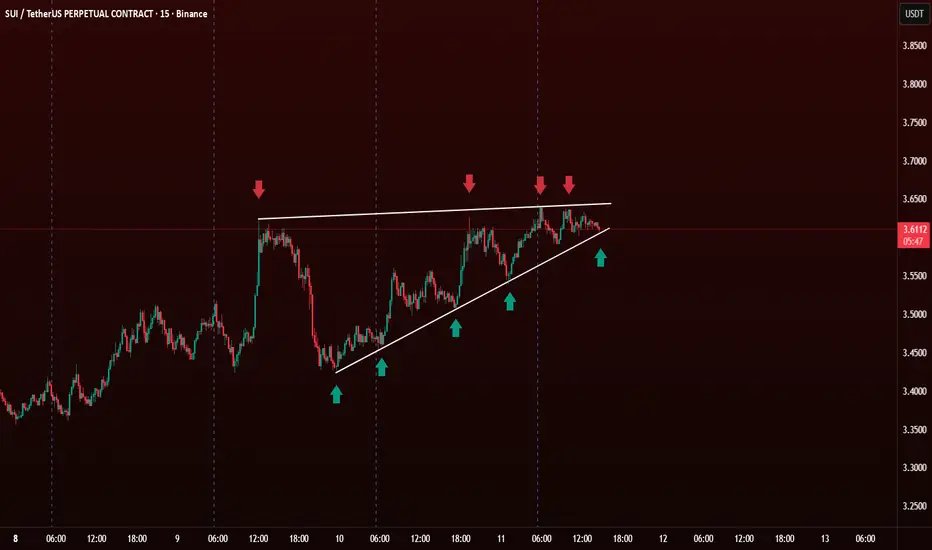
Ascending Triangle Pattern in Technical Analysis The Ascending Triangle is a bullish continuation pattern. It forms when the price creates higher lows (🔼) while facing consistent resistance at the same horizontal level (🔴).
🧐 How to Identify It
Flat Resistance Line 🔴
Price hits the same level multiple times and gets rejected.
This creates a horizontal line on top.
Rising Support Trendline 🔼
Each dip forms a higher low, indicating buying pressure.
Connect the swing lows with a rising trendline 📈.
📊 How to Trade It
Entry : Breakout Entry: Enter when price breaks and closes above the resistance line with high volume 💥.Conservative traders wait for a retest of the breakout zone (resistance becomes support).
Target : Measure the height of the triangle and project it upward from the breakout point.
Example: If triangle height = $0.30, add $0.30 above breakout.
Stop Loss : Below the last higher low 🔽 Or slightly below the triangle support trendline 📉
BINANCE:SUIUSDT.P
Eris Lifesciences Ltd: Symmetrical Triangle FormationEris Lifesciences Ltd . is currently exhibiting a Symmetrical Triangle Pattern on its daily chart. This pattern is characterized by converging trendlines formed by lower highs and higher lows, indicating a period of consolidation. While symmetrical triangles often serve as continuation patterns, they can also signal potential reversals, depending on the breakout direction.
The pattern's apex is approaching, suggesting that a breakout—either upward or downward—is imminent. It's crucial to monitor the breakout closely, as the direction will determine the subsequent trading strategy.
📉 RSI Analysis: Indicating Sideways Momentum
The RSI for Eris Lifesciences is currently below 50, indicating a neutral to bearish momentum. This suggests that the stock is in a sideways trend, with neither bulls nor bears gaining a clear advantage. Such conditions are typical during consolidation phases, reinforcing the current symmetrical triangle pattern.
🕯️ Candlestick Insight: Doji Formation
Recently, multiple doji candlestick with long legs has formed, signaling indecision in the market. A Doji occurs when the opening and closing prices are nearly identical, reflecting a balance between buying and selling pressures. The long wicks indicate that both bulls and bears attempted to take control but failed, leaving the market in a state of equilibrium.
This formation suggests that significant market participants are awaiting a catalyst to drive the next move, making it a critical point to observe for potential breakout confirmation.
🧠 Strategic Outlook: Awaiting Breakout Confirmation
Given the current technical indicators—a symmetrical triangle pattern, neutral RSI, and a doji candlestick—it's prudent to adopt a wait-and-see approach. The next significant move will depend on the breakout direction from the triangle:
Bullish Scenario: A breakout above the upper trendline, accompanied by increased volume and a rising RSI, would suggest a continuation of the uptrend. Bearish Scenario: Conversely, a breakdown below the lower trendline, with declining volume and a falling RSI, would indicate a potential reversal to the downside.
In both scenarios, it's essential to wait for confirmation through volume and momentum indicators before entering a position.
📌 Conclusion
Eris Lifesciences Ltd. is at a pivotal juncture. The formation of a symmetrical triangle, coupled with a neutral RSI and a doji candlestick, points to a period of consolidation. Traders should remain vigilant for a breakout in either direction, using volume and momentum indicators to confirm the move before making trading decisions.
As always, it's advisable to conduct thorough research and consider consulting with a financial advisor before making any investment decisions.

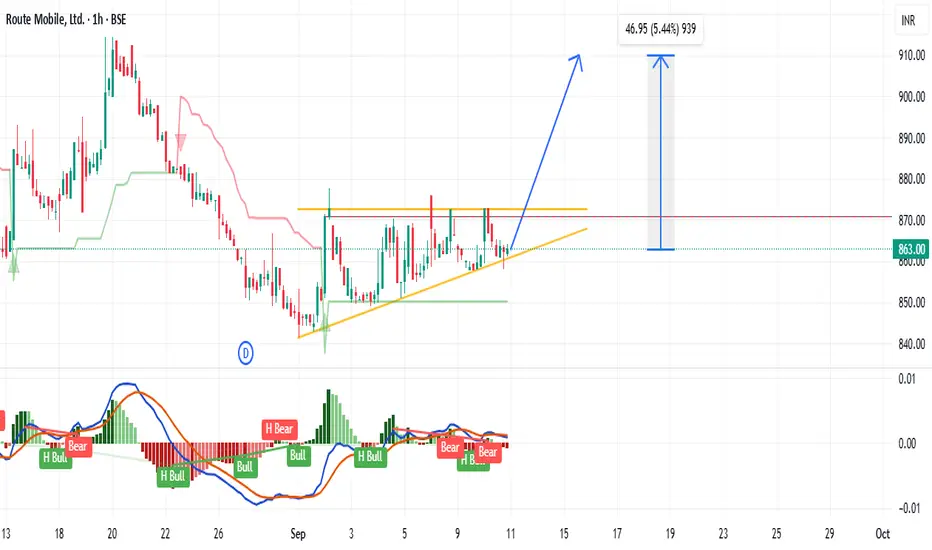
Route Mobile – Ascending Triangle Breakout Ahead on 1H timeframeRoute Mobile is showing strong technical momentum with an Ascending Triangle Breakout visible on the 1-hour chart. Price has broken above the resistance zone with notable volume support, signaling bullish strength.
Upside Potential: ~6% and possibly more if momentum sustains
Trigger Point: Breakout above resistance confirms fresh buying interest
Why this is significant:
The Ascending Triangle is a bullish continuation pattern. It forms when buyers steadily push prices higher with rising lows, while resistance holds firm. Once the resistance is decisively broken, it often unlocks strong upside potential as trapped sellers exit and fresh buyers enter with momentum.
Upside projection is based on the triangle’s height added to the breakout level, aligning with a potential 6% move. If volume sustains above breakout, there could be even more room for price appreciation.
🔎 Key takeaway: Breakout already in play, and Route Mobile looks poised for strong short-term momentum.
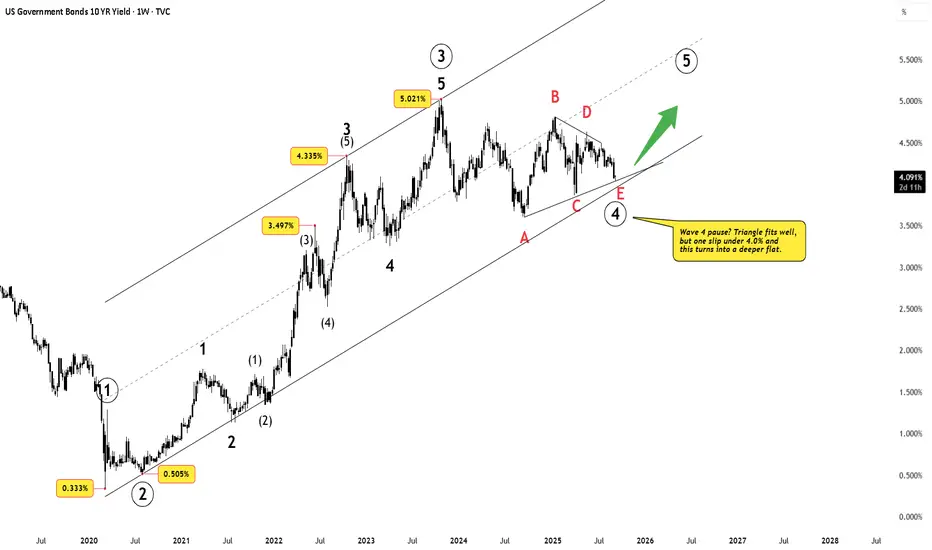
US 10Y Yield – Wave 4 Pause Before the Final SurgeDisclaimer: This analysis is for educational purposes only and does not constitute investment advice. Please do your own research (DYOR) before making any trading decisions.
The Setup
The US 10-year yield has been consolidating after topping near 5.021%. Price action since then has formed a contracting structure that looks very much like a Wave 4 triangle .
At present, yields hover near 4.0% — a crucial pivot.
Triangle view: Wave 4 is complete, setting the stage for Wave 5 higher.
Flat view: If yields break below 4.0%, Wave 4 may stretch deeper into a flat correction, potentially testing 3.6–3.7%.
Either way, the Elliott script points to one more advance: Wave 5 up .
What Wave 5 Could Mean
If the US 10-year yield really enters Wave ⑤ up, buckle up:
Bond prices tank → inverse relation, so Treasuries bleed.
Equities feel the heat → higher yields = expensive valuations, especially for growth stocks.
Dollar flexes → global FX could see USD strength.
Borrowing costs bite → mortgages, corporate loans, government debt servicing all tighten.
In short: Wave ⑤ = a macro “stress test .”
Why India Should Care
A breakout in US yields rarely stays a US-only story. For India, it means:
FII outflows as global funds chase safer US returns
INR under pressure , increasing imported inflation risks
Indian bond yields rising , even without RBI action
Equity market stress , especially in IT and rate-sensitive sectors
Final Thoughts
The triangle scenario points to an imminent breakout above 5.0%. A deeper flat only delays it. For traders and investors, this is the chart to watch — because Wave 5 in US yields isn’t just a bond market story, it’s a global macro shockwave .
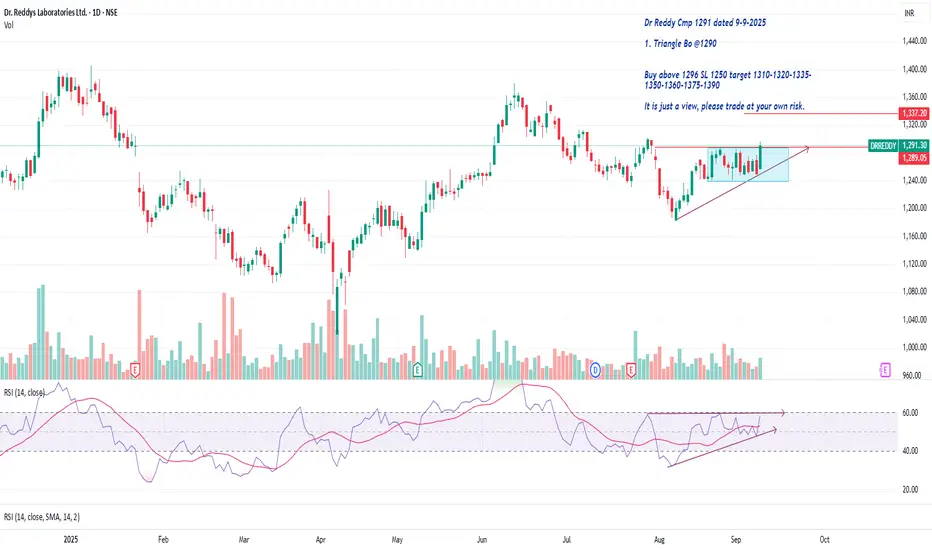
Dr Reddy Cmp 1291 Triangle BoDr Reddy Cmp 1291 dated 9-9-2025
1. Triangle Bo @1290
Buy above 1296 SL 1250 target 1310-1320-1335-
1350-1360-1375-1390
It is just a view, please trade at your own risk.
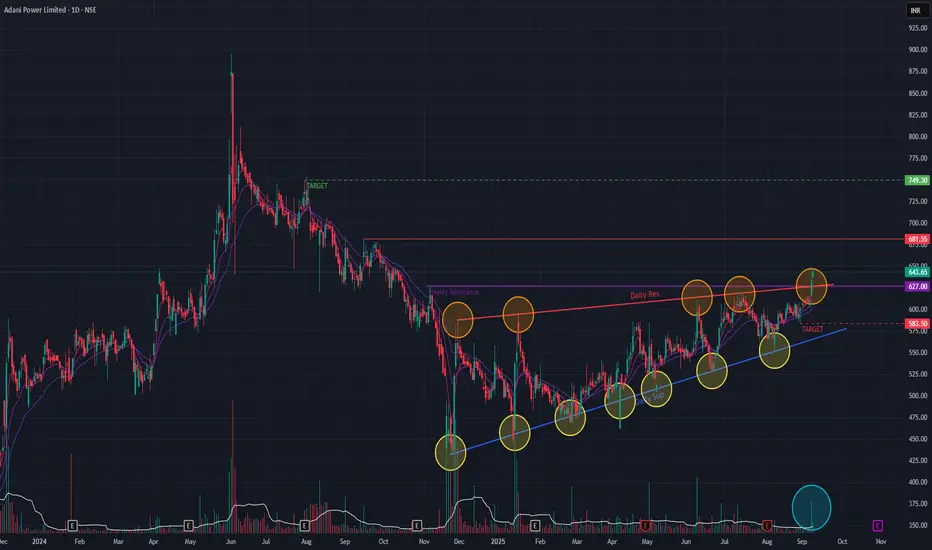
Adani Power (Daily Timeframe) - Bullish BreakOut or NotAdani Power has been in an uptrend since Nov 2024 & has formed a Triangle pattern. The past two days it has BrokenOut of the Triangle pattern with exceptionally huge volume indicating buyer interest. Short-term EMAs are in PCO state as well as the stock has breached two major resistance trendlines asserting Bullishness. A Golden Cross-over has formed since few days, indicating Bullishness
We may see levels of 749 if the momentum continues as well as a major resistance trendline is breached. It may go down to 583 levels if momentum is not sustained.
Keep monitoring the price-action !!
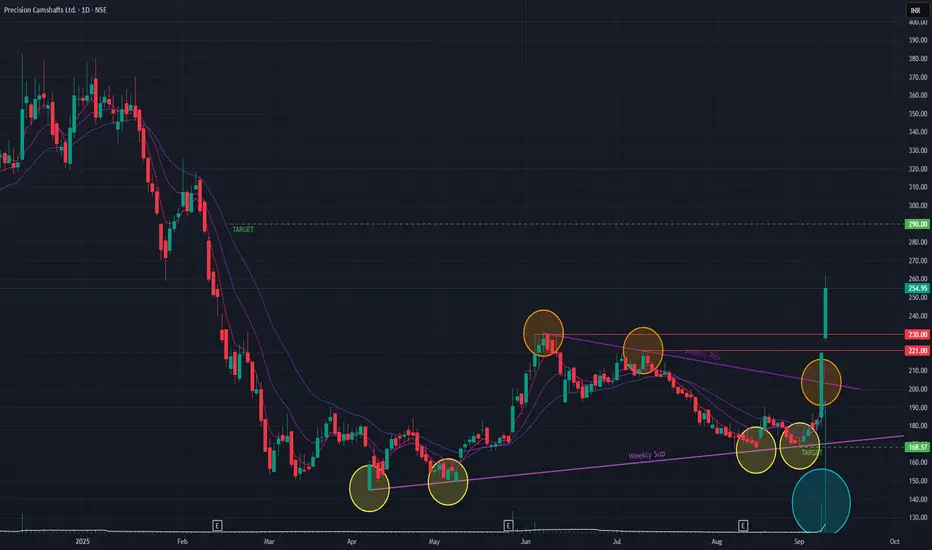
Precision Camshafts (Daily Timeframe) - Momentum Or NotPrecision Camshafts is on a bullish rally since yesterday, gaining +39.29%. Key observations to note are that since the ATH in Dec 2024, the stock was in a downtrend which has reversed since Apr 2025, as the stock been forming Higher Lows. and a Triangle pattern is formed as shown. Since the past two sessions, the stock is able to BreakOut of the Triangle pattern as well as BreakOut of the Daily resistance trendlines with huge volumes, showing buyer interest.
On an upside, if the momentum continues, we may see the stock go to 290 levels. If the stock is unable to sustain the momentum and goes down, we may see 168 levels.
Price-action in the coming days will dictate how the stock goes forward. Keep monitoring !!