Thangamayil Jewellery Triangle Breakout in Daily TFThangamayil has confirmed a triangle breakout on the daily timeframe, indicating a shift from consolidation to expansion.
🔹 Breakout Level: 3,779
🔹 Upside Target / Next Supply Zone: 4,107
🔹 Key Support (Demand Zone): 3,140
The stock spent multiple sessions compressing within a Ascending triangle, forming higher lows — a classic sign of accumulation.
The breakout came with improved participation, suggesting buyers are gaining control.
As long as price sustains above the breakout zone, the structure remains bullish, and pullbacks may be viewed as retests rather than reversals.
A close back inside the pattern would weaken the breakout setup.
Company Overview
Thangamayil Jewellery Ltd is a well-known South India–focused jewellery retailer, primarily operating in Tamil Nadu.
The company specializes in gold, diamond, and silver jewellery, catering largely to wedding and festive demand.
With a strong regional brand presence and expansion into new stores, Thangamayil benefits from:
Consistent rural & semi-urban demand
High brand trust in South India
Seasonal tailwinds during festivals and marriage seasons
For analysis of any stock, feel free to comment the stock name below.
This analysis is for educational and informational purposes only. It does not constitute investment advice or a recommendation to buy or sell any security. Market investments are subject to risk, and past performance does not guarantee future results. Please consult a SEBI-registered financial advisor before making any investment decisions. The author is not responsible for any losses or gains arising from the use of this information.
Trianglepattren

MIDCAP SELECTHappy New Year 2026
Hello & welcome to this analysis
The Midcap Select index has been sideways full December and might remain so for a few more days till it completes a triangle.
Leg D of this triangle could end near 13850-13900 followed by leg E that could retrace till 13700-650 to complete it formation (time wise correction)
The triangle structure will be invalid if either the current up move goes above 14000 without a pullback or the expected decline in leg E goes below 13575
The expected upside level post completion of triangle is approx 14300
All the best

ANGELONE Classical Textbook Elliott waveIf you don't believe, see it yourself
Classical Textbook Elliott wave forming in ANGELONE
Contracting Triangle
Descending
(Top declining, bottom flat)

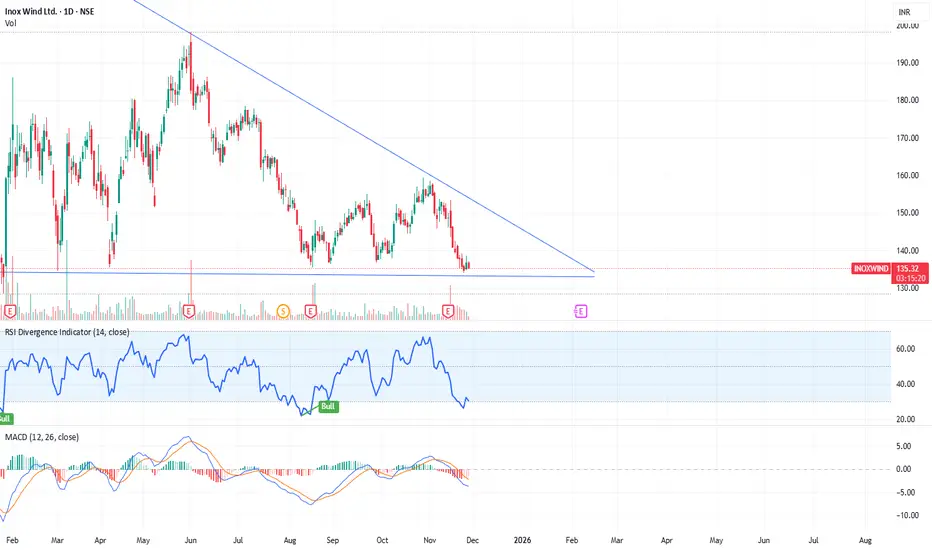
INOXWIND Accumulation Zone – High Probability Upside Reversal INOXWIND is approaching a high-probability bullish reversal zone.
Price is currently sitting at long-term horizontal support while compressing inside a falling triangle pattern. This area has previously acted as a strong demand zone.
Key Bullish Signals:
🔹 1. Price near major support + triangle apex
The price is holding above long-term support and squeezing toward the triangle’s end — a zone where breakouts or sharp reversals often happen.
🔹 2. RSI deeply oversold (near 28–30)
RSI is at levels where previous reversals occurred, showing sellers are exhausted and downside momentum is weakening.
🔹 3. MACD losing bearish strength
The MACD histogram is flattening and the lines are preparing for a potential bullish crossover, indicating the downtrend is weakening.
🔹 4. Tight price compression forming a “price pipe”
Price action is tightening, which often precedes a volatile move — and with indicators oversold, the probability favors an upside bounce.
🎯 Bullish Expectation
If the support holds, INOXWIND may show a sharp relief rally toward:
₹140
₹150 trendline
And possibly higher if volume supports a breakout.
⚠️ Risk Disclaimer
Support breakdown below ₹130 will invalidate the bullish setup.
This is a study of chart behavior and probability only — not a buy/sell recommendation. Always do your own research and manage risk.

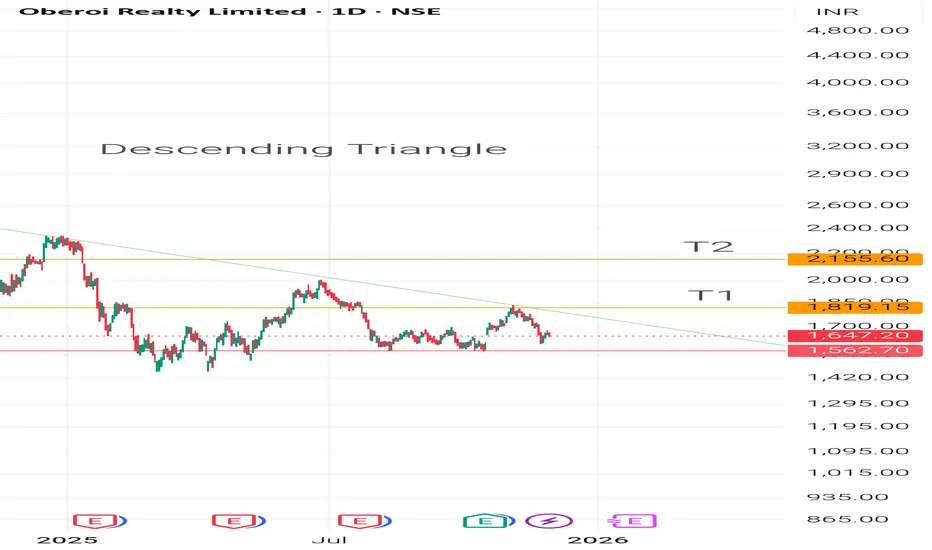
Descending Triangle BreakoutOberoi Reality is forming a Descending Triangle Pattern and can be a good Swing Trade for two reasons:
1. Descending Triangle Pattern gives a Good Breakout Movement.
2. The QOQ result of the stock has been very good with an increase of Profit in the Medium Term.
3. The stock has formed higher low in Price as Well as RSI.
I've set the targets at 38.2 and 50 levels of the fibonacci.
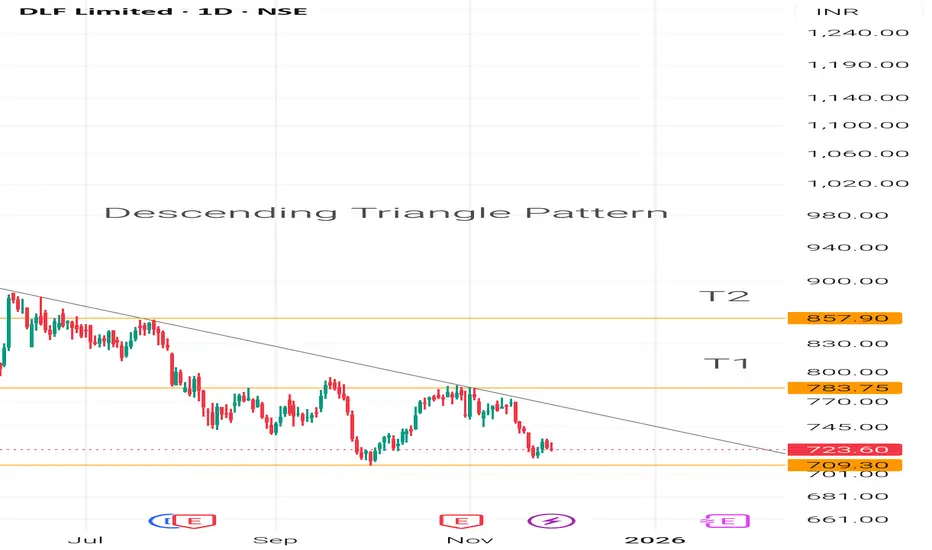
Descending Triangle PatternThis can be a profitable trade because of :
1. The stock is forming Descneding Triangle Pattern which can give potential momentum till 12-15%.
2. The stock's current low is a bit above the previous one and can be also see in the RSI.
3. DLF has given very strong QoQ resultand has shown very high profit.
The Stock's upcoming target are marked using Trend based Fibonacci Extension Tool.
SILVERHello & welcome to this analysis
Silver had a dream run from August to October before going into a sideways correction.
Just like Gold, it too is forming a triangle, now likely into its last leg.
Comex Silver an ascending triangle as long as it does not trade above $54.40 could dip down to $51.50 - 50.75 to complete the formation of the triangle provided the expected last leg down does not go below 48.63.
MCX Silver is a contracting triangle (due to $:INR) as long as it does not trade above 165818 could dip down to 157000 - 155000 to complete the formation of the triangle provided the expected last leg down does not go below 150350.
Upon completion of the triangles the upside target on resumption of uptrend are $59 / INR 186000
All the best

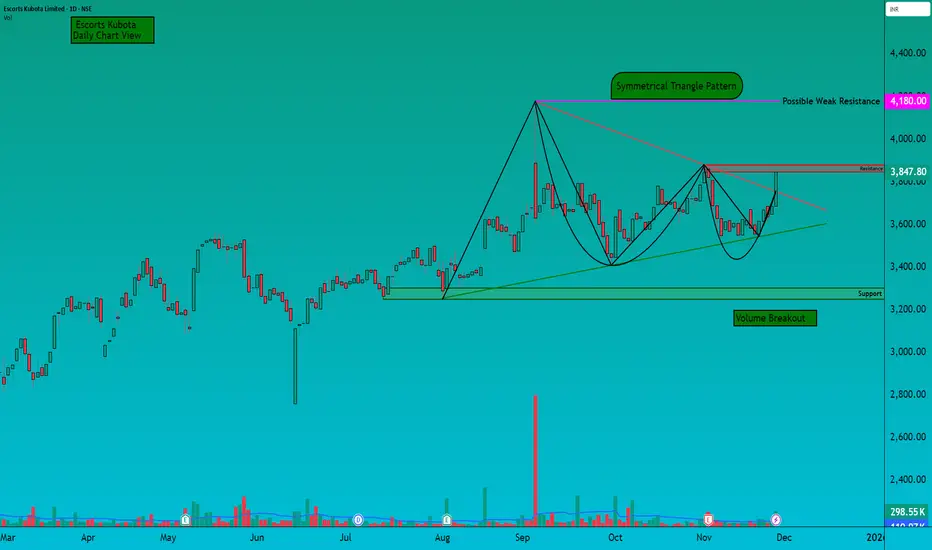
ESCORTS - Symmetrical Triangle Breakout Attempt
💹 Escorts Kubota Ltd (NSE: ESCORTS)
Sector: Machinery & Tractors | CMP: 3847.80 | View: Symmetrical Triangle Breakout Attempt
Chart Pattern: Symmetrical Triangle Pattern
Candlestick Pattern: Strong Bullish Momentum Candle
Swing High: 4180
Swing Low: 3250
STWP Trade Analysis:
Bullish Breakout Level: 3880
Stop Loss: 3535
Momentum: Strong
Volume: High institutional participation
The price has pushed strongly from the rising demand line, breaking into the upper zone of the triangle pattern with a decisive bullish candle. The surge in volume confirms institutional activity, and the structure shows a clear shift from compression into expansion. Buyers have regained dominance and are defending higher lows consistently.
Resistances:
3915 | 3982 | 4105
Supports:
3725 | 3662 | 3535
STWP Stock Analysis:
Final Outlook:
Momentum: Strong | Trend: Bullish Bias Developing | Risk: Moderate | Volume: Very High
Escorts Kubota has completed a clean coiling phase inside a symmetrical triangle and has now delivered a strong bullish candle directly into the breakout zone. Volume expansion confirms that this is not a random spike — it reflects accumulation by stronger hands.
RSI has rebounded toward the balanced zone, Stochastic has turned upward from oversold territory, and MACD is preparing for a positive signal, reflecting internal strength building beneath the price. EMA compression is easing gradually, hinting at the start of a new directional phase.
The VCP-like contractions across the last two months indicate a steady reduction in volatility, followed by today’s expansion candle — a behaviour often associated with the first ignition leg of a breakout. Sustaining above 3725–3662 keeps the bullish bias intact and allows the stock to challenge the upper resistance band near 3915 → 3982 → 4105.
Overall, Escorts Kubota stands at the edge of a potential breakout continuation, supported by strong volume, healthy structure, and a clear upshift in price behaviour. Holding the demand zones below can unlock further upside toward the higher resistance levels.
Traders should watch how the stock behaves on minor dips or pullbacks toward the 3719.60 - 3620.10 demand band. Healthy retests within this zone can strengthen the breakout structure and often act as secondary entry points in strong momentum setups
⚠️ Disclaimer
This document is strictly for educational and informational purposes. All examples, charts, levels, and option structures discussed are illustrative and are not intended as buy, sell, or hold recommendations. STWP does not provide investment advice, trading tips, signals, or personalized financial guidance of any kind, nor is it a SEBI-registered intermediary or research analyst.
The analyses, illustrations, and risk–reward structures included here are generic in nature and based on publicly available data and observed market behaviour, which may change without notice. Financial markets involve significant risk; derivatives in particular carry the potential for substantial losses. Option premiums, implied volatility, open interest, delta, and other market variables can fluctuate rapidly and unpredictably. Readers are solely responsible for their trading decisions, capital management, and risk assessment. Before making any investment or trading decision, please consult a SEBI-registered investment advisor. STWP, its representatives, and affiliates shall not be liable for any direct or indirect loss arising from the use of this material. Historical patterns or past market behaviour do not guarantee future outcomes. Nothing in this document should be interpreted as a promise of performance, accuracy, or returns.
Position Status: No active position in ESCORTS at the time of analysis.
Data Source: TradingView & NSE India .
💬 Found this useful?
🔼 Boost this post to support structured learning
✍️ Drop your thoughts or questions in the comments
🔁 Share with traders who benefit from clean technical studies
👉 Follow for disciplined, structured, STWP-style analysis.
🚀 Stay Calm. Stay Clean. Trade With Patience.
Trade Smart | Learn Zones | Be Self-Reliant 📊
INOX WIND – Testing Major Support + Falling Wedge StructureChart Overview
The price has been moving inside a descending trendline (falling wedge–like structure) since its peak earlier this year. Currently, the stock is once again testing a strong horizontal support zone around ₹132–135, which has acted as demand multiple times in the past.
This confluence of major support + wedge bottom makes this zone important for a potential bullish reversal.
🟩 Bullish Argument:
This zone offers a potential bullish opportunity because:
Price is sitting at strong demand zone (132–135).
The falling wedge structure is typically a bullish pattern.
RSI oversold → Possible reversal territory.
MACD is setting up for a future bullish crossover.
Risk–reward becomes favorable near major support.
🟧 What Bulls Want to See
A bounce from the ₹132–135 zone.
A close above the recent minor swing high on the daily.
Breakout above the descending trendline for positional upside.
🟥 Invalidity (When Idea Fails)
A daily close below ₹130 with volume would weaken the bullish case.
That would indicate breakdown from support instead of reversal.
📈 Potential Targets (if reversal occurs)
T1: ₹145
T2: ₹155
T3: Trendline breakout → ₹165+
⚠️ Disclaimer
This is not financial advice; for educational purposes only. Always manage risk.
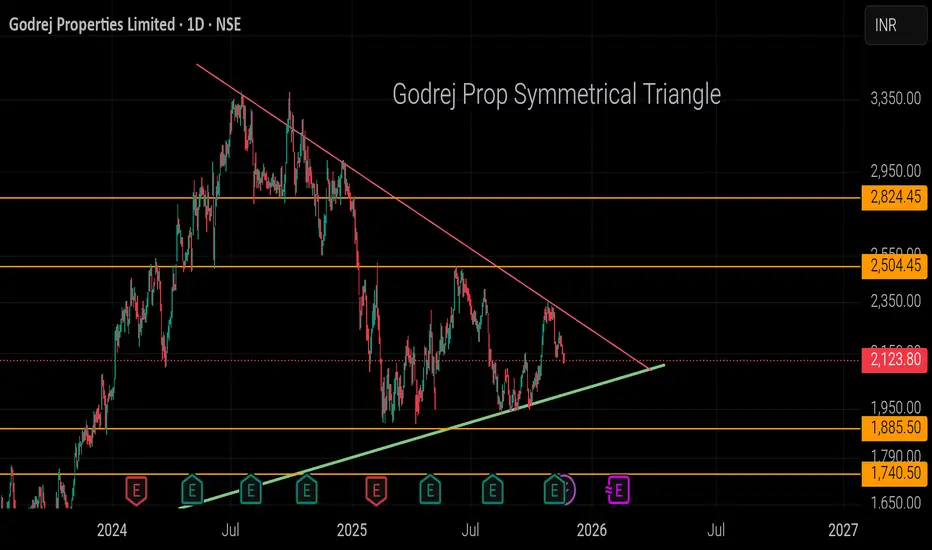
Godrej Properties Symmetrical TriangleGodrej Properties is forming a Symmetrical Triangle. The recent news signify that they have acquired land / property deal worth of 2400 Cr which can boost the stock. I've outlined 4 possible targets using the Fib Tool. Not sure if it's gonna go down or up. Let me know your opinion about it.
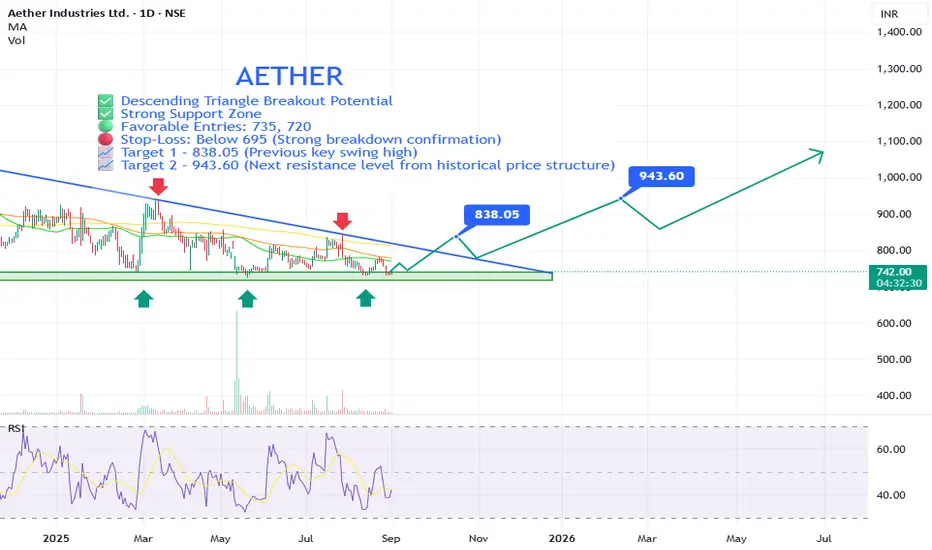
AETHER Bullish Reversal Setup with Strong Risk-Reward PotentialAether Industries Ltd is showing signs of a potential trend reversal from a well-established support zone, supported by a descending triangle breakout pattern and improving technical indicators. This setup suggests a strong risk-reward opportunity for swing traders and positional investors.
⚡ Key Technical Points:
🔵 Descending Triangle Breakout Potential: The price is nearing a breakout from a long-term descending triangle. A breakout above the trendline (~₹778–₹790) could trigger a strong uptrend.
🟢 Strong Support Zone: ₹700–₹720 has held as solid support multiple times (as marked by green arrows), indicating strong demand at these levels.
🟩 Bullish Divergence on RSI: Relative Strength Index (RSI) is showing higher lows while price remains flat or lower, indicating bullish divergence—a sign of potential reversal.
🟢 Favorable Entries: 735, 720
🔴 Stop-Loss: Below 695 (Strong breakdown confirmation)
📈 Target 1 – 838.05 (Previous key swing high)
📈 Target 2 – 943.60 (Next resistance level from historical price structure)
✅ Why This Is a Technically Strong Setup:
✅ Multiple Support Bounces: 700–720 zone has been tested at least 4 times in the last year, showing strength.
✅ Volume-Based Reactions: While volume is low now, past spikes at support zones suggest institutional interest.
✅ Clear Risk Management: Stop-loss is tight (~6–7%) with targets offering 1.5–3x risk-reward potential.
✅ Potential Trend Reversal: Break above descending trendline and moving averages could signal a shift to bullish structure.
✅ Long Base Formation: The stock has been consolidating for over a year—long base formations often lead to explosive moves.
📢 Disclaimer: This is not financial advice. Always do your own research or consult with a professional before making investment decisions.
XAUUSD Analysis - Levels and Pridiction#Gold (XAU/USD) Technical Analysis - October 27, 2025
Current Market Status: Retracement on Higher Time Frame,
Lower Timeframe Bearish Breakdown⚠️
Gold is trading at 4,033.67, having broken down from the previous #consolidation zone. The market has violated key support levels and is now showing clear bearish momentum with multiple technical confirmations.
Critical Technical Developments:
1️⃣ Triangle Pattern Breakdown (1H Chart)
The 1-hour chart reveals a confirmed triangle #pattern breakout to the downside. After breaking below the triangle support, price attempted a retest of the breakdown level around 4,093-4,144 but was rejected, confirming the pattern's validity. This is a classic bearish continuation signal.
2️⃣ Demand Zone Invalidation
A crucial demand level that previously held multiple tests has now been completely invalidated. The chart explicitly notes: "Demand Level to be invalidated to move the Price Further Down" - this condition has been met, opening the path for deeper downside movement.
3️⃣ Minor Trend Shift Level Breach
Price has broken below the **Minor Trend Shift Level** at approximately 4,093, confirming a shift from bullish to bearish short-term structure. This level now acts as resistance.
Target Zones (High Probability):
🎯 Immediate Targets:
- 3,945 - Next support cluster (current proximity)
- 3,845 - 0.5 Fibonacci retracement level (PRIMARY TARGET)
- 3,719 - 0.618 Fibonacci retracement level (EXTENDED TARGET)
The Fibonacci levels in green boxes, are the key magnetic zones for price action.
📉 Bearish Continuation (70% Probability)
Price continues lower toward 3,845, potentially extending to 3,719 if selling pressure intensifies. This move would represent a healthy correction within the broader uptrend from the yearly lows.
📈 Bullish Reversal (30% Probability)
Requires reclaiming 4,144 with strong momentum AND holding above it on daily timeframe. Only then would the bearish structure be invalidated.
Conclusion:
Gold remains in a confirmed downtrend on lower timeframes with clear downside targets visible. The invalidation of demand zones and triangle breakdown provide strong bearish confirmation. Traders should focus on the 3,845-3,719 zone as the primary area of interest for potential reversal setups. Until price reclaims 4,150+, the path of least resistance remains **DOWN**.
Risk Management: Use proper position sizing as volatility remains elevated. The 3,845 level will be crucial - watch for buyer reaction there.

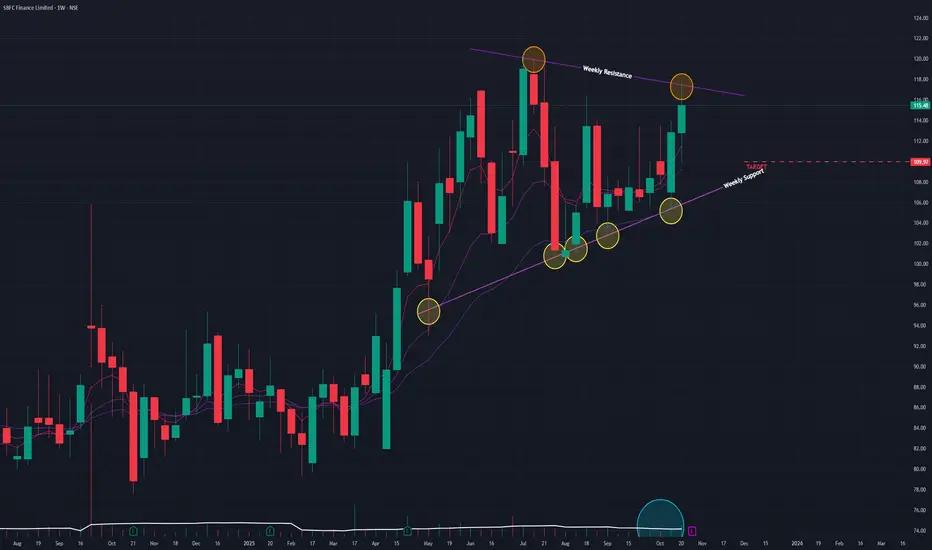
SBFC (W) - Coils in Triangle Pattern, Awaiting a Decisive BreakAfter a post-IPO sideways trend, SBFC has been consolidating within a Triangle Pattern since April 2025. The stock is currently in a state of building tension, with bullish underlying indicators running into a strong, proven resistance.
The Bullish Undertone
The technical indicators on higher timeframes are showing constructive strength, suggesting a bullish bias:
- Strong Momentum: The short-term Exponential Moving Averages (EMAs) are in a bullish Positive Crossover (PCO) state on both the Monthly and Weekly charts.
- Rising Strength: The Relative Strength Index (RSI) is also rising on both the Monthly and Weekly timeframes.
- Volume: Trading volume has remained at an average level, indicating an absence of significant selling pressure during this consolidation.
The Key Resistance
Despite these bullish indicators, the stock remains trapped below the upper resistance trendline of the triangle. The strength of this resistance was confirmed last week , when the stock attempted to break out but failed to close above the trendline , resulting in a "fakeout."
This week's action, a modest surge of +2.35% on 16.77 million in volume, is another attempt to push against this same barrier, but it has not yet succeeded.
Outlook and Key Levels
The stock is at a clear inflection point. A decisive move is required, as the price is being squeezed between rising momentum and a hard ceiling.
- Bullish Scenario: A breakout will only be confirmed with a decisive close above the upper resistance trendline on high volume . If the stock can achieve this and sustain the momentum, the next potential target is the ₹115 level.
- Bearish Scenario: If the stock is rejected from this resistance again and fails to sustain its upward momentum, it will likely fall back with a potential downside to the ₹110 level.
The price action in the coming trading sessions is critical. All eyes should be on the upper trendline of the triangle for either a confirmed breakout or another rejection.
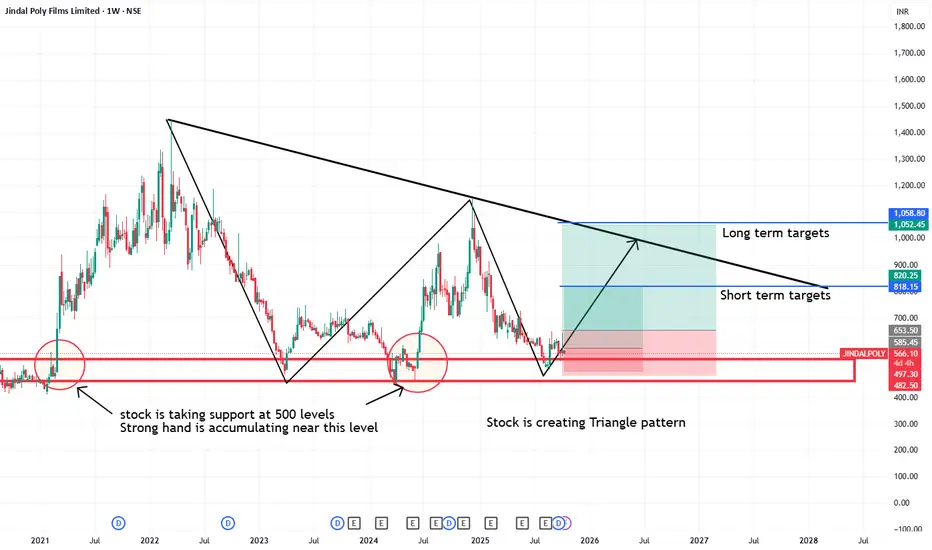
Jindal poly creating triangle pattern stock is taking support at 500 levels
Strong hand is accumulating near 500 level
Good triangle pattern is forming

Triangle Pattern Strategy for Breakout within Range | Study OnlyThis chart showcases a symmetrical triangle pattern, where the price consolidates between two converging trendlines, indicating a period of market indecision. The formation of lower highs and higher lows suggests that the price is narrowing, setting up for a potential breakout.
Technically, the RSI is showing a bullish divergence as it rises from the oversold zone, while the MACD is crossing into positive territory, further supporting the possibility of an upward move. Volume indicators also highlight increasing interest, suggesting the potential for a breakout in the near term.
This is only view of my side by analysys of chart.
Note:
This analysis is purely for educational purposes and should not be considered as financial advice or a trading recommendation. Always conduct thorough research and consult a financial professional before making any trading decisions.
SCHWSCHW has recently delivered a Triangle Pattern breakout within the context of a long-term parallel channel that has been forming over several years. This convergence of patterns suggests a potential shift in momentum and a likely resumption of the broader trend.
The breakout from the triangle indicates emerging bullish sentiment, but a decisive breakout above the 2-year high is still pending. This level is a critical resistance, and once breached, it could confirm the breakout’s strength and initiate a more sustainable upward move.
Following such a breakout, a retest of the breakout zone would be a healthy technical development and could provide an ideal entry point for long-term investors.
Looking ahead, if the breakout holds and the stock maintains its trajectory, SCHW may attempt to reach the upper boundary of the outer parallel channel over the next 2–3 years, offering a favorable risk-reward setup for position traders and long-term investors.
Summary:
Pattern Identified: Triangle breakout within a long-term parallel channel
Key Resistance: 2-year high (yet to be broken)
Potential Entry: On breakout and subsequent retest
Medium/Long-Term Target: Upper edge of the outer parallel channel
Outlook: Bullish with long-term growth potential over 2–3 years

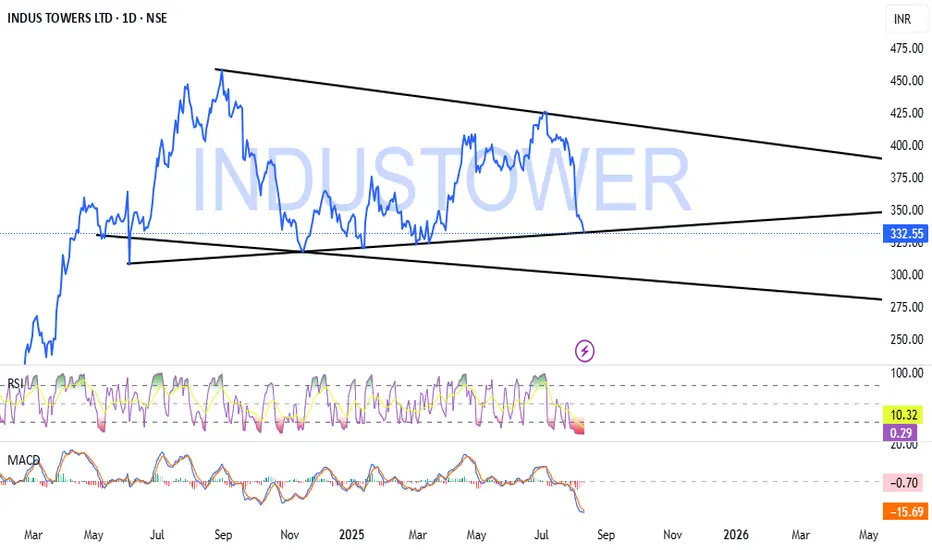
IndusTower Long - Forming Pattern & Entering into consolidationIndusTower - After the decent Breakout Forming Pattern & Entering into consolidation. Its Best buy at Bottom with Stoploss.
Righttime to enter before Breakout.
Do your own analysis before Entering into any trade. NSE:INDUSTOWER
XAUUSD - Flag PatternWhats your take on Guys.
#Institutions Consolidation going on - #Accumulation or #Distribution.
Kind of #Triangle #pattern in formation, ##Flagpattern. DO your analysis, Enter trade on Breakout and confirmation side. Trade with #confluence. i would say accumulate at bottom of pattern with SL and Participate in full swing before #Breakout.

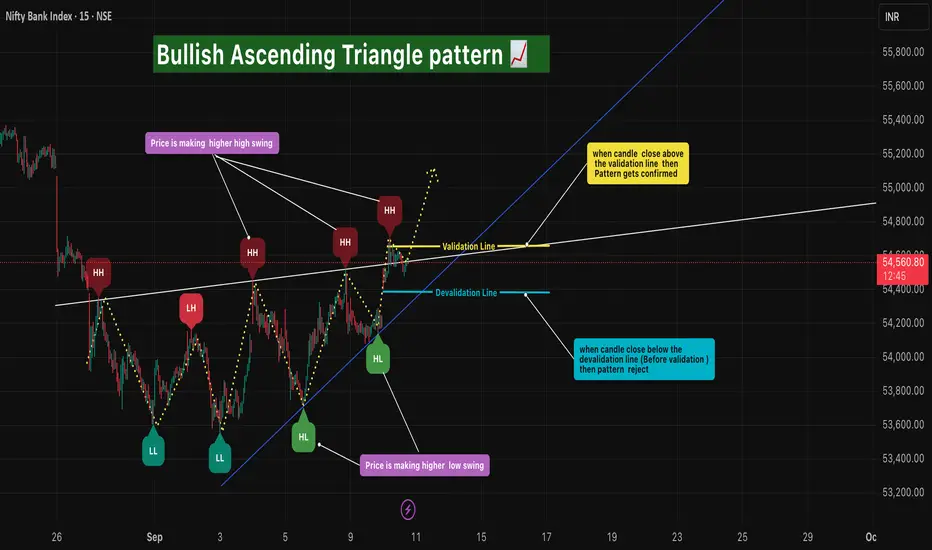
Bullish Ascending Triangle pattern🔎 Intro / Overview
The Bullish Ascending Triangle is a continuation pattern that signals strength in an uptrend 📈.
It forms as price creates Higher Highs and Higher Lows in sequence, compressing toward a breakout level.
This structure shows buyers stepping in at higher levels while sellers gradually weaken, often leading to a bullish breakout.
___________________________________________________________
📌 How to Use
Identify a prior uptrend → the base condition for Ascending Triangle.
Price consolidates by forming Higher Lows and retesting the same resistance level.
Validation → Mark the close of candle that break upper trend line
Devalidation → Swing Low ( when any candle break the upper trend line).
Entry → Confirmed only when price closes above the Validation level .
Stop Loss → Swing Low (Candle break the upper trend line ).
Target → Equal to the measured height of the triangle or 1R multiples.
___________________________________________________________
🎯 Trading Plan
Entry → On breakout close above Validation level.
Stop Loss → Swing Low (Candle break the upper trend line ).
Target → Conservative 1R, Moderate 2R,
Remaining lots → Trail using ATR, Fibonacci, or structural swing highs.
___________________________________________________________
📊 Chart Explanation
Price starts in an uptrend.
Forms a sequence of Higher Highs and Higher Lows .
Resistance holds flat at the top, forming the Ascending Triangle shape 🔺.
Breakout above the Higher High Validation line triggers entry ✅.
Swing Low = Devalidation ⛔.
Target 1 achieved 🎯, trailing used for further upside 🚀.
___________________________________________________________
👀 Observation
Works best as a continuation pattern in established uptrends.
A strong bullish breakout candle adds conviction.
Sideways/choppy markets may cause false breakouts → validation rules filter them.
Volume confirmation strengthens the setup.
___________________________________________________________
❗ Why It Matters?
Represents buyer dominance with sellers weakening over time.
Provides a clear breakout entry with strict SL and TP.
Helps traders capture trending moves while minimizing false signals.
Rule-based framework improves discipline and consistency.
___________________________________________________________
🎯 Conclusion
The Bullish Ascending Triangle Pattern is a reliable continuation signal for trend traders.
By combining Higher Highs, Higher Lows, and breakout confirmation, traders can enter with confidence, manage risk, and trail profits effectively.
🔥 Patterns don’t predict. Rules protect. 🚀
___________________________________________________________
⚠️ Disclaimer
📘 For educational purposes only.
🙅 Not SEBI registered.
❌ Not a buy/sell recommendation.
🧠 Purely a learning resource.
📊 Not Financial Advice.
GOOG📊 NASDAQ:GOOG Weekly Chart | CMP: $180
🔺 Triangle breakout still pending
🕵️♂️ Watching closely near key levels
📈 Range:
▪️High: $206.56 (Feb 2025)
▪️Low: $140.36 (Apr 2025)
📉 Stop Loss: $150
🎯 Target: $300 in 12–18 months
Breakout confirmation could open strong upside potential.
#GOOG #Alphabet #Stocks #TechnicalAnalysis #Investing

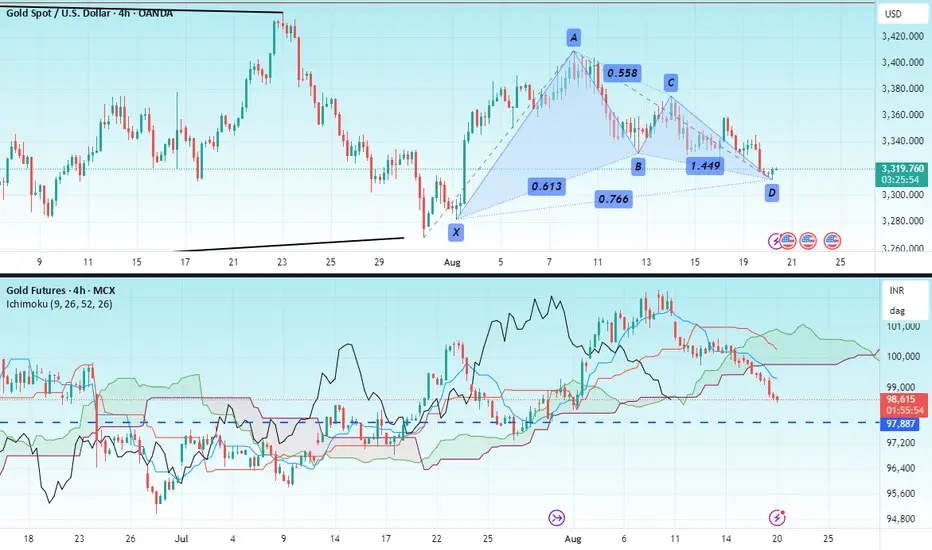
GOLDHello & welcome to this analysis
Gold at COMEX has formed a bullish Harmonic Gartley pattern in 4hr time frame suggesting a reversal in trend.
As long as it sustains above $3295 it could give a bounce/rally till $ 3345 - 3370 - 3400 - 3450.
Gold at MCX appears to be ending its pullback but due to INR $ fluctuations a bullish Harmonic pattern has not formed. One could look for bullish trades as long as its above 97900 for upside levels of 99400 - 100000 - 101000 - 102500. Keep in mind levels could alter due to forex changes
Overall GOLD is strong and has an upside triangle breakout target of $3700 open as long as it is above $3250 (refer to my earlier view published on Gold in the link)
All the best
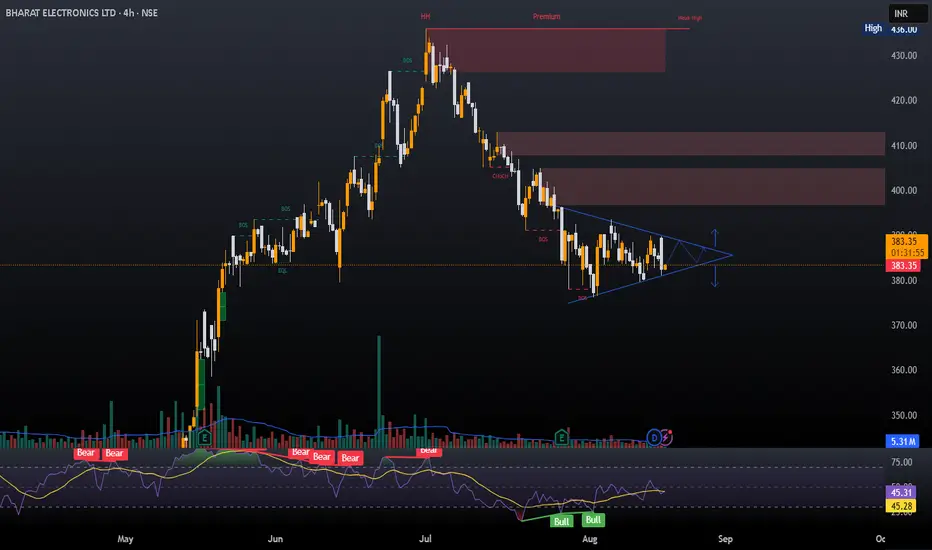
BEL Triangle PatternA long position can be taken in BEL if it breaks out this triangle pattern.
Entry- 383 - 381
Stop Loss- 377
Target- 390, 395, 400
Reason- After a good consolidation BEL has made a triangle pattern. A breakout from the pattern can give a good move.
Disclaimer- This is just for educational purpose. Please take advice before making any decision.
Jai Shree Ram.