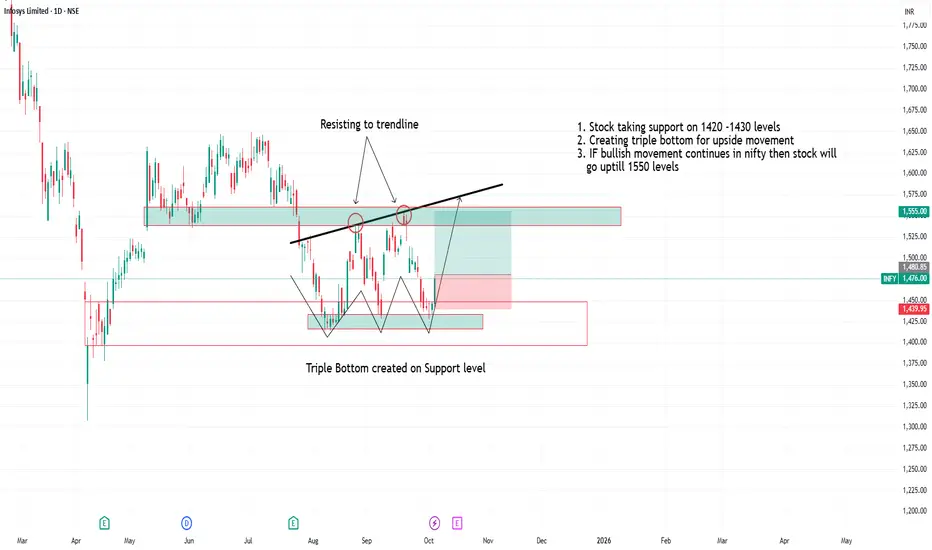
Infosys creating triple bottom on 1420-1430 level1. Stock taking support on 1420 -1430 levels
2. Creating triple bottom for upside movement
3. IF bullish movement continues in nifty then stock will
go uptill 1550 levels
Triplebottom
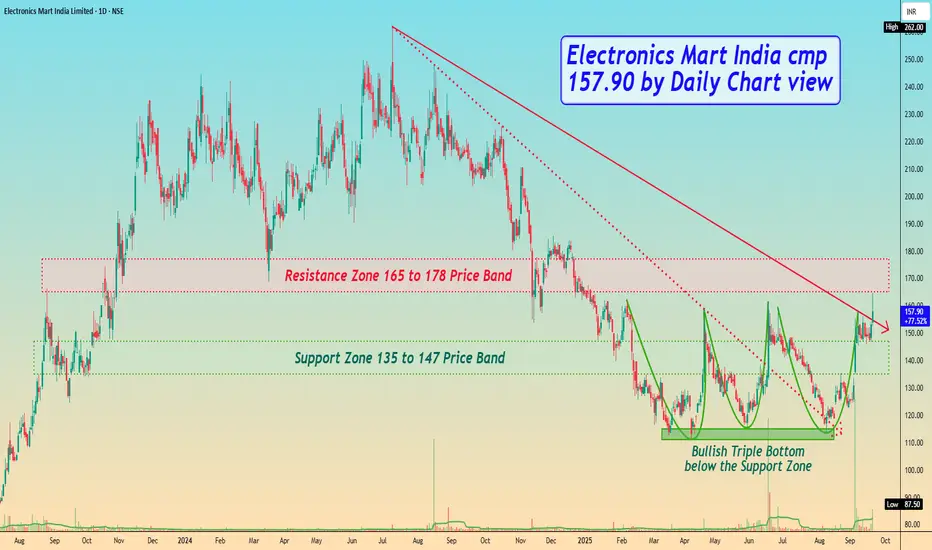
Electronics Mart India cmp 157.90 by Daily Chart viewElectronics Mart India cmp 157.90 by Daily Chart view
- Support Zone 135 to 147 Price Band
- Resistance Zone 165 to 178 Price Band
- Falling Resistance Trendlines Breakout seem sustained
- Volumes surging heavily above avg traded qty over past few days
- Bullish Triple Bottom with considerate Cup & Handle around Support Zone
- Support Zone price band is under testing retesting phase over the past 2 weeks
CHOLAFIN - ReassessmentThe last time I posted the chart, the inverted Head and Shoulder pattern was evident and it had signaled that the downward trajectory has been arrested. However, the analysis was premature and with the very close Stoploss we were safely out of the stock. That is the benefit of having a stoploss.
Since then the stock has gone on to form a nice base respecting that bottom zone the Inverted Head and Shoulder had arrested and also now it is making a more evident Triple Bottom on the Support line of the Ascending Channel.
I believe the stock is now ready for an up move.

USDT Dominance Forming Triple Bottom – Bearish SignalUSDT Dominance is showing a triple bottom formation on the daily timeframe – a pattern that historically signals a potential reversal or bounce. Each time USDT.D has tested this region in the past, we've seen a strong bounce in dominance, often followed by pullbacks in BTC and altcoins due to their inverse relationship.
Key indicators aligning:
RSI is rebounding from oversold levels
Stochastic RSI showing upward momentum
MACD also signaling a possible bullish crossover
With August traditionally being a bearish month, we may be heading into a corrective phase or even a sharp dump across the crypto market.
📉 Take profits where needed and prepare for the next opportunity. Stay cautious and trade with discipline.

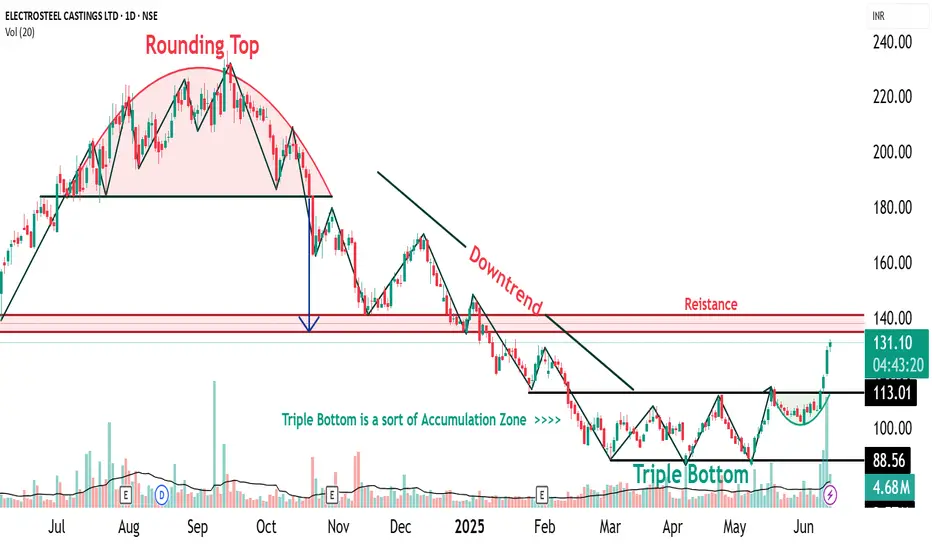
ELECTCAST Triple Bottom Pattern🔍 1. Understanding the Triple Bottom
The Triple Bottom is a classic bullish reversal pattern that typically forms after a prolonged downtrend or consolidation phase. It signifies strong buying interest at a consistent support level, leading to three distinct price lows (or “bottoms”) occurring near the same price zone.
📌 Key Characteristics:
Formation Time: Typically spans 2–6 months
Touchpoints: Three distinct lows formed at or near the same support level
Pattern Zone (for ELECTCAST): ₹87 – ₹88
Trade Entry: Entry is typically considered on a breakout above the neckline, which is the horizontal resistance connecting the interim highs between the bottoms. In this case, a breakout confirmation would be around ₹96.
Stop Loss (SL): Just below the third bottom, e.g., ₹85
Target: Based on pattern depth projection, conservative ₹104, aggressive potential up to ₹120–₹140, once momentum sustains
📉 2. Triple Bottom Formed at ₹87–₹88 Zone
Electrosteel Castings has tested the ₹87–₹88 level three times, showing that this price zone has acted as a strong accumulation support. The repeated defense of this level suggests significant buying interest by institutional players or informed investors.
1st Bottom: Initial rejection near ₹88
2nd Bottom: Retest with similar rejection zone
3rd Bottom: Confluence with bullish reversal candlestick (Morning Star)
The pattern is visually symmetric and clean, enhancing its reliability.
At the third bottom near ₹87, a Morning Star was observed, marking the first visual confirmation of bullish reversal. This adds significant strength to the pattern because the third bottom often acts as a psychological pivot point, triggering buying from traders watching for a reversal.
📈 3. Higher Top – Higher Bottom Structure Emerging
Following the Morning Star, the stock has started forming a higher bottom and higher top structure—a fundamental trait of an uptrend. However:
🟡 Caution: One more higher bottom formation is required to confirm the start of a sustainable uptrend.
Once the uptrend is firmly established, a close above ₹140 will act as a major breakout signal, potentially propelling the price toward new 52-week highs or an all-time peak.
🧠 4. Accumulation Zone and Triple Bottom – The Relationship
An Accumulation Zone is a price range where informed investors quietly accumulate shares over a period, usually when a stock is undervalued or consolidating.
🔗 Connection to Triple Bottom:
The Triple Bottom pattern often forms within the Accumulation Zone
Each dip to the support level attracts buyers, revealing hidden demand
The formation acts as a transition from accumulation to markup phase
The breakout from the Triple Bottom signals the end of accumulation and the start of an uptrend
Hence, the Triple Bottom is not just a technical pattern, but a visual representation of accumulation dynamics playing out.
📝 Disclaimer
This report is intended purely for educational and training purposes. It is not a recommendation to buy or sell securities. Always conduct your own research or consult a certified financial advisor before making trading decisions.
Anant Raj: Triple Bottom Reversal Pattern, Trendline BO.NSE:ANANTRAJ Made a Beautiful Chart Structure of a Triple Bottom reversal pattern, Sort of Inverse H&S confirmation and Trendline BO. Post Excellent Q4 Results, with Good Price and Volume action.
Price Action:
- It experienced a sharp decline in January 2025, falling from ₹950 to the ₹550 level.
- Further correction took it to lows near ₹420 in March-May 2025
- Currently showing signs of recovery at ₹514.10, up ₹40.50 (+8.55%) in today's session.
- Breaking above the descending trendline (white diagonal).
- Multiple tests of the ₹420-430 support zone created a solid base
Volume Analysis:
- Today's volume at 7.79M shares vs. average of 2.93M (over 2.5x normal volume)
- Previous support bounces (green arrows) also saw increased volume
- Strong volume accompanying the breakout indicates conviction behind the move
- Volume expansion during upward movements signals the accumulation phase
Key Support and Resistance:
- Strong support established at ₹420-430 zone (green horizontal line)
- Intermediate resistance at ₹550 level (lower red horizontal line)
- Major resistance at ₹630-640 zone (upper red horizontal line)
- Multiple rejection points at these resistance levels (red arrows)
- Historical resistance at ₹935-950 from December-January (top red line)
Technical Patterns:
1. Triple Bottom- Formed at ₹420-430 level (March, April, May - green arrows)
2. Descending Trendline Breakout- Price breaking above the multi-month downtrend line
3. Somewhat Inverse Head & Shoulders- Potentially forming with:
- Left shoulder (February-March)
- Head (April)
- Right shoulder (May)
- Neckline around ₹520-530
4. Sort of Range Breakout- Escaping from the ₹420-500 trading range
Trade Setup:
- Pattern: Trendline breakout + potential inverse H&S completion
- Confirmation: Strong price action above ₹500 with volume expansion
- Context: Reversal setup after extended downtrend and base formation
Entry Points:
1. Aggressive Entry: Current price (₹514.10) with partial position
2. Pullback Entry: On retest of breakout level ₹490-500
3. Confirmation Entry: On close above ₹550 (previous resistance level)
Exit Strategy
- Target 1: ₹550 (immediate resistance)
- Target 2: ₹630-640 (major resistance zone)
- Target 3: ₹750 (intermediate target based on pattern projection)
- Ultimate Target: ₹935-950 (previous ATH high)
- Trailing Stop: Implement a 5% trailing stop after Target 1 is achieved
Stop Loss Placement:
- Aggressive Stop: ₹480 (below recent swing low)
- Conservative Stop: ₹450 (midpoint of recent range)
- Pattern-Based Stop: ₹420 (below the triple bottom support)
Risk Management:
- Position sizing: Limit risk to 1-2% of trading capital
- Risk-reward ratio: Minimum 1:1.5 (with aggressive stop)
- Consider the pyramiding approach: add to the position as each resistance level is cleared
- Scale out: 30% at Target 1, 30% at Target 2, hold remainder with trailing stop
The stock shows a compelling technical setup with its triple bottom pattern, trendline breakout, and high-volume surge. The inverse head and shoulders pattern, if completed with a move above ₹550, would further confirm the reversal thesis. Multiple tests of support with increasing volume on the recovery suggest institutional interest is building in the stock.
Keep in the Watchlist.
NO RECO. For Buy/Sell.
📌Thank you for exploring my idea! I hope you found it valuable.
🙏FOLLOW for more
👍BOOST if you found it useful.
✍️COMMENT below with your views.
Meanwhile, check out my other stock ideas on the right side until this trade is activated. I would love your feedback.
Disclaimer: "I am not SEBI REGISTERED RESEARCH ANALYST AND INVESTMENT ADVISER."
This analysis is intended solely for informational and educational purposes and should not be interpreted as financial advice. It is advisable to consult a qualified financial advisor or conduct thorough research before making investment decisions.

Technical Analysis Report: SMS Pharmaceuticals Ltd1. Bullish Flag with Pole (June–July 2024)
Bullish Flag with Pole: A continuation pattern formed after a strong upward price move (the pole), followed by a short-term consolidation (the flag), signaling the potential for another breakout upward.
Price Action: Strong impulsive rally formed the flagpole, followed by a tight consolidation forming the flag 🚩.
Breakout: Confirmed with a high-volume breakout to the upside.
Target: Achieved a massive 40% gain in under a month.
Analysis: A textbook bullish continuation pattern; traders capitalized on early entry post-breakout.
2. Distribution Phase (August–October 2024)
Distribution Phase: A sideways trading range after an uptrend where smart money or institutions start offloading their holdings. Typically a precursor to a market reversal or downtrend.
Market Structure: After the sharp uptrend, price entered into a horizontal range.
Phase Characteristics: Low volatility, repeated rejections at resistance, high volume on down days—signs of distribution.
Interpretation: Institutions likely booking profits, signaling a potential trend reversal.
Trader Sentiment: Shifted from bullish to neutral/bearish.
3. Triple Top Formation (Within Distribution Phase)
Triple Top Pattern: A bearish reversal pattern marked by three failed attempts to break above a resistance level, indicating weakening momentum and a potential downtrend.
Resistance Level: Same peak tested three times without breaking.
Breakdown: Confirmed after the third top with a decisive drop.
Target: Achieved a "30% downside" move via "short selling", all within a month.
Insight: Classic reversal pattern, effectively timed with distribution.
4. Bearish Flag with Pole (During Triple Top Breakdown)
Bearish Flag with Pole: A continuation pattern during a downtrend. It starts with a sharp decline (pole), followed by a minor upward consolidation (flag), suggesting further downside.
Formation: Sharp decline (pole) followed by a brief upward consolidation (flag).
Breakdown: Continuation to the downside, achieving projected target.
Target: Fully achieved within the same downtrend cycle.
Conclusion: Reinforced the bearish sentiment and amplified the down move.
---
5. Accumulation Phase + Triple Bottom (December 2024–April 2025)
Accumulation Phase: A market phase where a stock trades in a range after a downtrend, as buyers (often smart money) gradually build positions, typically leading to a bullish reversal.
A Triple Bottom is a bullish reversal chart pattern that forms after a downtrend, marked by three equal lows indicating strong support and a potential trend reversal to the upside.
Phase: 5-month Accumulation Phase
Pattern: Triple Bottom during this period indicated strong support and buyer presence.
Breakout: Occurred with a bullish breakout post third bottom.
Target: 20% upside achieved within a month post-breakout.
Observation: Long-term investors and smart money potentially entering positions.
6. Rounding Bottom in Progress (May 2025)
Pattern: Rounding Bottom (Still Forming)
Current Price Action: Gradual curve formation with decreasing volume on the left and increasing volume near the neckline— a bullish sign.
Expectation: Anticipated upside breakout in the coming days.
Outlook: If confirmed, this could mark the start of a new bullish cycle.
📌 Summary:
SMS Pharmaceuticals Ltd. has shown a textbook series of technical patterns—from trend continuations to reversals, distribution to accumulation, and now a potential new uptrend. Each phase was actionable, with clear breakout/breakdown points and well-achieved targets.

USHA MARTIN BREAKS OUT! 7.5% SURGE SIGNALS MASSIVE RALLY AHEADNSE:USHAMART Made Beautiful Chart Structure of Kinda Triple Bottom Reversal Pattern today after Q4 Results with Good Price and Volume action and Breaking the Trendline.
Price Action:
- The stock has been in a downtrend since November 2024, forming a clear descending resistance line (white diagonal Trendline)
- Currently showing strong breakout momentum at ₹334.85, up ₹23.75 (+7.46%) in today's session
- Successfully broken above both the downtrend line and horizontal resistance at ₹320-325
- Multiple tests of support at the ₹290 level have created a solid base for the current rally
- Higher lows forming since March indicate increasing buying pressure
Volume Analysis:
- Today's volume at 4.98M shares vs. average of 688.65K (over 7x normal volume)
- Previous support bounces (green arrows) also occurred with increased volume
- Extremely high volume on today's breakout confirms strong institutional interest
- Volume profile shows healthy accumulation during support tests
Key Support and Resistance Levels:
- Strong support established at ₹290 level (green horizontal line)
- Intermediate resistance/support at ₹320-325 (lower red horizontal line)
- Major resistance at ₹350 level (upper red horizontal line)
- The previous rejection point at ₹350 (red arrow) now becomes the next target
- Long-term resistance from October to December 2024 around ₹420
Technical Patterns:
1. Downtrend Line Breakout*- Price has decisively broken above the multi-month downtrend line
2. Kinda Triple Bottom- Formed at ₹290 level (February-May), creating a solid foundation
3. Ascending Triangle- Recent price action shows higher lows against horizontal resistance
4. Volume Confirmation- Massive volume spike validates the technical breakout
5. Bullish Engulfing Candle- Today's price action engulfs previous bearish candles
Trade Setup:
- Pattern: Downtrend line breakout + horizontal resistance break
- Confirmation: Strong price action with 7x normal volume
- Context: Potential trend reversal after extended downtrend and base formation
Entry Points:
1. Aggressive Entry: Current price (₹334.85) with partial position
2. Pullback Entry: On retest of breakout level ₹320-325
3. Confirmation Entry: Add positions on close above ₹350 (previous resistance)
Exit Strategy:
- Target 1: ₹350 (immediate resistance)
- Target 2: ₹380 (intermediate resistance based on prior support level)
- Target 3: ₹420 (major resistance from December 2024)
- Trailing Stop: Implement a 5% trailing stop after Target 1 is achieved
Stop Loss Placement:
- Aggressive Stop: ₹315 (below breakout level)
- Conservative Stop: ₹305 (midpoint between support and breakout)
- Pattern-Based Stop: ₹290 (below the triple bottom support)
Risk Management:
- Position sizing: Limit risk to 1-2% of trading capital
- Risk-reward ratio: Maintain at least 1:1.5 (with aggressive stop)
- Consider scaling in: 50% at current level, 25% on pullback, 25% on further confirmation
- Scale out: 30% at Target 1, 40% at Target 2, hold remainder with trailing stop
Today's powerful breakout on record volume after forming a kinda triple bottom pattern suggests a potential trend reversal. The breakout above both the descending trendline and horizontal resistance provides a compelling technical case for upside continuation. If the stock can maintain momentum above the ₹325 level, it could target the next resistance at ₹350 quickly, with potential for a move toward ₹380-420 in the coming weeks.
Keep in the Watchlist.
NO RECO. For Buy/Sell.
📌Thank you for exploring my idea! I hope you found it valuable.
🙏FLLOW for more
👍BOOST if useful
✍️COMMENT below with your views.
Meanwhile, check out my other stock ideas on the right side until this trade is activated. I would love your feedback.
Disclaimer: "I am not a SEBI REGISTERED RESEARCH ANALYST AND INVESTMENT ADVISER."
This analysis is intended solely for informational and educational purposes and should not be interpreted as financial advice. It is advisable to consult a qualified financial advisor or conduct thorough research before making investment decisions.

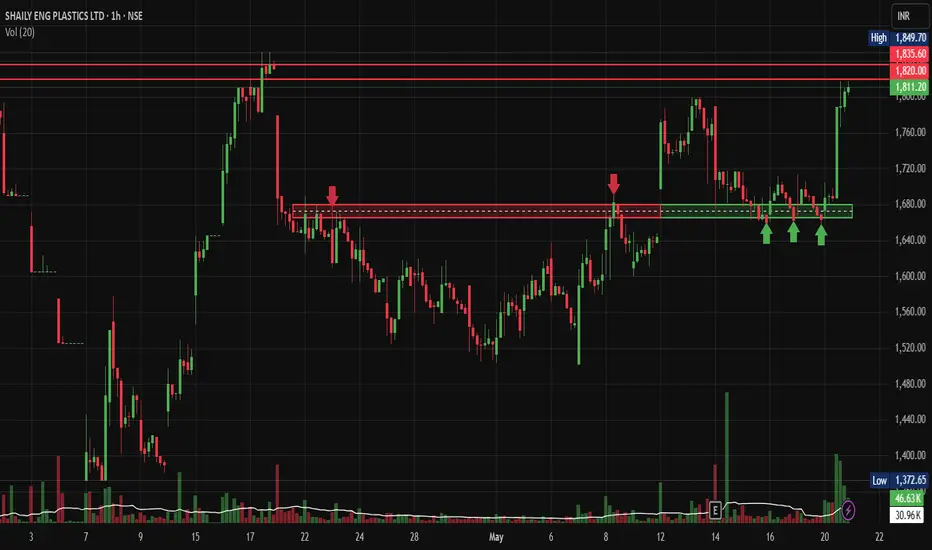
Shaily Eng Plastics Makes a Power MoveNSE:SHAILY Makes a Power Move on Hourly Charts after Q4 Results.
Price Action Analysis:
The stock is currently trading at ₹1,811.20. After consolidating near the ₹1,650-1,680 support zone for several days, SHAILY has broken out strongly to the upside, reclaiming previous highs near ₹1,820. The price action shows a series of higher lows since the early May bottom, indicating increasing bullish momentum.
Volume Analysis:
Volume has been healthy at 46.63K shares, significantly above the 30.96K average volume. This confirms genuine buying interest supporting the recent breakout. The volume spikes align with key price movements, particularly during the recent bullish moves, which validates the strength of the current uptrend.
Support & Resistance Levels:
- Key Resistance: ₹1,835-1,850 zone (previous high)
- Immediate Breakout Level: ₹1,820 (now acting as support)
- Major Support: ₹1,650-1,680 zone (multiple tests with green arrows)
- Base Formation: A solid base was formed between ₹1,650-1,680 after the pullback from April highs
Technical Patterns:
1. Rectangle Pattern: The stock formed a rectangular consolidation pattern between mid-April and mid-May (₹1,650-1,680 range)
2. Triple Bottom: Three distinct touches at the ₹1,650-1,680 support zone (marked with green arrows)
3. Bull Flag: The recent consolidation after the strong upward move from early May represents a bull flag pattern that has now resolved to the upside
Trade Setup:
- Entry Point: ₹1,815-1,820 on a pullback to the breakout level
- Stop Loss: ₹1,765 (below the recent swing low)
- First Target: ₹1,850 (previous resistance)
- Second Target: ₹1,920 (measured move from the rectangle pattern)
- Final Target: ₹2,000 (psychological level and potential measured move target)
Risk Management:
- Position sizing: Limit exposure to 2-3% of trading capital
- Risk-Reward Ratio: Approximately 1:1.5 based on the stop loss and the second target
- Trailing stop: Move stop loss to breakeven after the price reaches the first target
NSE:SHAILY showed exceptional technical strength with the recent breakout above resistance after forming a solid base. The increased volume confirms buyer interest, and the prior triple bottom pattern adds confidence to the bullish outlook. Traders should watch for the continuation of the breakout with the mentioned targets, while protecting capital with the defined stop loss.
Keep in the Watchlist.
NO RECO. For Buy/Sell.
📌Thank you for exploring my idea! I hope you found it valuable.
🙏FOLLOW for more
👍BOOST if you found it useful.
✍️COMMENT below with your views.
Meanwhile, check out my other stock ideas on the right side until this trade is activated. I would love your feedback.
Disclaimer: "I am not a SEBI REGISTERED RESEARCH ANALYST AND INVESTMENT ADVISER."
This analysis is intended solely for informational and educational purposes and should not be interpreted as financial advice. It is advisable to consult a qualified financial advisor or conduct thorough research before making investment decisions.
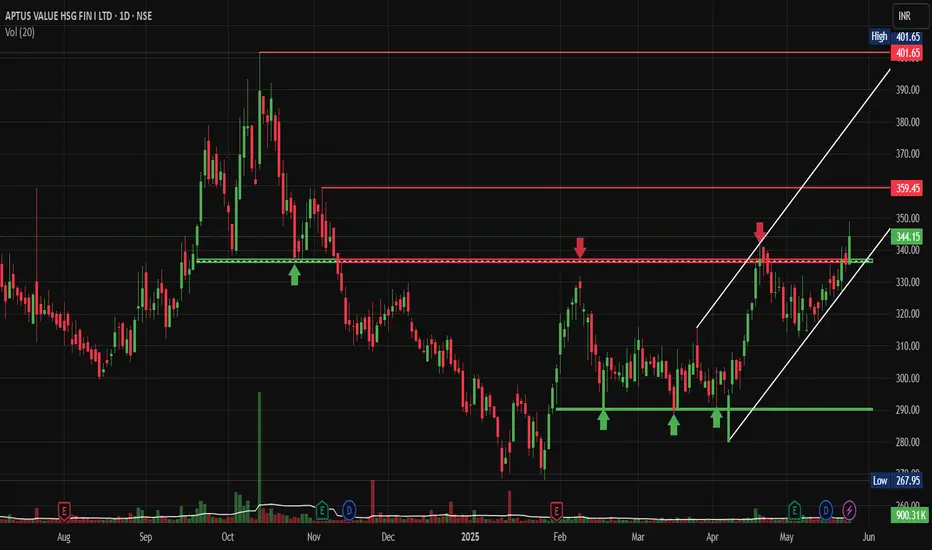
Aptus Rising Channel Pattern with Prior Triple Bottom PatternNSE:APTUS : Rising Channel Pattern with Prior Triple Bottom Pattern Signals Major Reversal - Could This Be the Next Multi-Bagger?
Pattern Recognition & Base Formation:
NSE:APTUS presents a compelling technical setup with a Triple Bottom reversal pattern formed at the ₹267-275 support zone. This pattern, completed over several months from late 2024 to early 2025, represents one of the most reliable bullish reversal formations in technical analysis.
The stock has also carved out a distinct ascending triangle pattern with the upper trendline acting as dynamic resistance around ₹340-350 levels. The recent breakout above this consolidation zone, accompanied by increased volume participation, signals a potential trend change from the prolonged correction phase.
Key Technical Levels Analysis:
Critical Support Levels:
- Immediate Support: ₹330-335 (recent breakout consolidation)
- Major Support: ₹290-295 (triple bottom neckline and 50% retracement)
- Ultimate Support: ₹267-275 (triple bottom base - absolute floor)
Resistance Levels:
- Immediate Resistance: ₹359 (marked horizontal resistance zone)
- Next Target: ₹380-385 (psychological resistance before ATH)
- Ultimate Target: ₹401.65 (all-time high retest)
- Extension Target: ₹420-430 (measured move from triple bottom pattern)
Volume Profile Assessment:
The volume pattern shows significant improvement during the recent bounce from the triple bottom lows. Today's volume at 900.31K represents a 44% increase from the 20-day average, indicating institutional interest returning to the stock.
The volume during the formation of the triple bottom showed classic accumulation characteristics - high volume on declines (smart money buying) and lower volume on any bounces, until the recent breakout attempt.
Technical Pattern Breakdown:
Primary Pattern: Triple Bottom Reversal
- Formation Period: December 2024 - February 2025
- Support Base: ₹267-275
- Neckline: ₹290-295
- Measured Target: ₹350+ (already achieved), next target ₹420-430
Secondary Pattern: Ascending Triangle
- Formation Period: February 2025 - Present
- Base: Rising support from ₹275 to ₹330
- Apex: ₹340-350 resistance zone
- Breakout Status: In progress with volume confirmation pending
Trade Setup Strategy:
Setup Classification: Reversal Play with Pattern Confirmation
Entry Approaches:
- Aggressive Entry: ₹340-345 (current levels on any minor dip)
- Conservative Entry: ₹330-335 (on pullback to breakout support)
- Value Entry: ₹290-295 (if neckline retest occurs - lower probability)
Position Management:
- Initial Position: 1-1.5% portfolio allocation
- Add-on Levels: ₹330-335 (if pullback materialises)
Profit Booking Strategy:
- Target 1: ₹365-370 (6-8% upside) - Book 25% position
- Target 2: ₹385-390 (12-15% upside) - Book 40% position
- Target 3: ₹410-420 (20-25% upside) - Book remaining 35%
Risk Management:
- Tight Stop: ₹325 (5-6% downside for aggressive traders)
- Swing Stop: ₹310 (10% downside for position traders)
- Pattern Stop: ₹285 (below neckline - invalidates bullish thesis)
Sector & Fundamental Backdrop:
Housing finance companies are experiencing renewed interest due to:
- Improving real estate cycle momentum
- Regulatory clarity on lending norms
- Credit growth revival in retail segments
- Government policy support for affordable housing
Risk-Reward Assessment:
Bullish Catalysts:
- Triple bottom completion - highly reliable reversal signal
- Volume expansion during the recent bounce
- Sector tailwinds supporting fundamentals
- Technical breakout from months of consolidation
- Strong support base established at ₹270 levels
Risk Factors:
- Overall market volatility could impact momentum
- NBFC sector sensitivity to interest rate changes
- Need to sustain above ₹340 to confirm breakout
- High beta nature amplifies market moves
Bottom Line:
NSE:APTUS offers an attractive risk-adjusted opportunity with the completion of a triple bottom reversal pattern. The stock appears to be in the early stages of a potential trend reversal after months of base building.
The most prudent approach would be to initiate positions around current levels (₹340-345) with a tight stop below ₹325, targeting the ₹365-370 zone initially. Any pullback to the ₹330-335 support area would present an even better entry opportunity.
The key technical milestone will be a decisive break and hold above ₹350, which would likely trigger the next leg of the move toward the ₹380-400 zone. Until then, trade with defined risk parameters and respect the established support levels.
Keep in the Watchlist.
NO RECO. For Buy/Sell.
📌Thank you for exploring my idea! I hope you found it valuable.
🙏FOLLOW for more
👍BOOST if you found it useful.
✍️COMMENT below with your views.
Meanwhile, check out my other stock ideas on the right side until this trade is activated. I would love your feedback.
Disclaimer: "I am not SEBI REGISTERED RESEARCH ANALYST AND INVESTMENT ADVISER."
This analysis is intended solely for informational and educational purposes and should not be interpreted as financial advice. It is advisable to consult a qualified financial advisor or conduct thorough research before making investment decisions.
Multi-Month Triangle Breakout Can Signal Move to ₹750+NSE:TIPSMUSIC Made a Beautiful Chart Structure Today and Breaks Free of Multi-Month Triangle Breakout and Could Signal Explosive Move to ₹750+
Price Action Analysis:
NSE:TIPSMUSIC is currently trading at ₹676.80, up 3.68% (₹24.00) today. The stock has been consolidating in a narrowing range since January 2025, forming a classic symmetrical triangle pattern. After testing the lower support multiple times around ₹580-600, the stock is now approaching the apex of the triangle and showing signs of a potential upside breakout. The recent price action shows higher lows being formed, indicating growing buying interest at lower levels.
Volume Analysis:
Volume is healthy at 319.61K shares, significantly above the average of 192.25 K. The increased participation suggests growing interest as the stock approaches a crucial decision point. Volume patterns show consistent buying support during dips to the triangle's lower boundary, while recent sessions have seen upticks in volume accompanying the move higher.
Key Support & Resistance Levels:
- Immediate Resistance: ₹720-730 zone (upper triangle boundary and previous resistance)
- Major Resistance: ₹750-760 (prior swing high from December)
- Triangle Support: ₹580-600 zone (marked with green arrows - multiple successful tests)
- Key Support: ₹560-570 (breakdown level that would invalidate the pattern)
- Dynamic Resistance: Descending trendline from November highs
Technical Patterns:
1. Symmetrical Triangle: Well-defined triangle formation since January, with converging trendlines
2. Triple Bottom: Multiple successful tests of the ₹580-600 support zone (green arrows)
3. Ascending Triangle Element: The recent higher lows suggest buyers are becoming more aggressive
4. Compression Pattern: Decreasing volatility as price approaches the triangle apex, typically before significant moves
Trade Setup - Breakout Play:
Entry Strategy:
- Primary Entry: ₹695-700 on confirmed breakout above triangle resistance with volume
- Secondary Entry: ₹680-685 on any pullback to current levels (anticipatory entry)
Targets:
- First Target: ₹730-735 (immediate resistance)
- Second Target: ₹760-770 (measured move from triangle base)
- Final Target: ₹800-820 (extension target based on triangle height)
Risk Management:
- Stop Loss: ₹640 (below recent swing low and triangle support)
- Tight Stop: ₹660 for aggressive traders
- Position Size: Maximum 2% of portfolio at risk
Alternative Setup - Continuation Play
For conservative traders waiting for confirmation:
- Entry: ₹735-740 (after clearing first resistance zone)
- Stop Loss: ₹695 (below breakout level)
- Targets: ₹780, ₹820, ₹860
Risk-Reward Analysis:
- Primary Setup R:R = 1:2.5 (Entry ₹690, Stop ₹640, Target ₹770)
- The triangle pattern suggests a potential 15-20% move upon breakout
- A failed breakout risk exists if volume doesn't confirm the move
Key Catalysts to Watch:
The stock appears to be in the final stages of its triangle consolidation. A breakout above ₹720 with strong volume (above 400K shares) would confirm the pattern and likely trigger momentum buying. Conversely, a breakdown below ₹640 would invalidate the bullish setup and could lead to a test of ₹560-570 levels.
The decreasing volatility and tightening price range suggest a significant move is imminent. Given the multiple successful tests of support and the overall market context, the probability favours an upside resolution, making this an attractive risk-reward setup for both swing and position traders.
Traders should monitor volume closely on any breakout attempt, as genuine breakouts from triangle patterns typically require volume confirmation to sustain the move.
Keep in the Watchlist.
NO RECO. For Buy/Sell.
📌Thank you for exploring my idea! I hope you found it valuable.
🙏FOLLOW for more
👍BOOST if you found it useful.
✍️COMMENT below with your views.
Meanwhile, check out my other stock ideas on the right side until this trade is activated. I would love your feedback.
Disclaimer: "I am not a SEBI REGISTERED RESEARCH ANALYST AND INVESTMENT ADVISER."
This analysis is intended solely for informational and educational purposes and should not be interpreted as financial advice. It is advisable to consult a qualified financial advisor or conduct thorough research before making investment decisions.

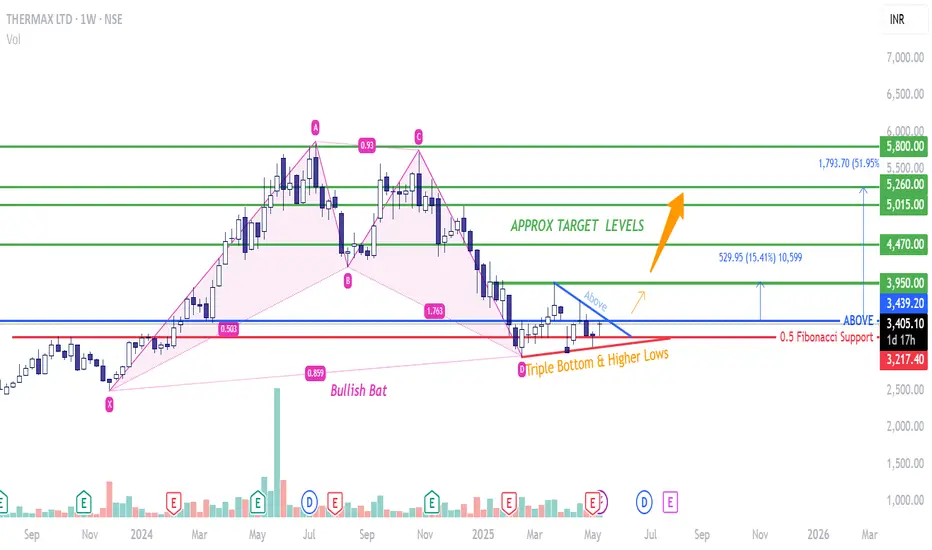
THERMAX - Bullish Bat -Bullish Bat is a harmonic pattern as shown in pink.
-Usually, during the base formation post making a Bullish bat pattern, a lot of big players accumulate which is then followed by a sudden spurt in prices.
- I see a triple bottom being made in an upward trend line suggesting Higher Lows.
- The base length can vary depending on the market scenarios. Patience is required in this kind of bamboo shoot stories.
- Here the base pattern suggests a symmetrical triangle is being formed. Too early to claim but so far looks like one. Hoping for a supersonic breakout from a symmetrical triangle pattern and a harmonic pattern.
PCBL Daily Chart- LONGHere’s a detailed analysis of PCBL on Daily Chart
1. Trendline
A downward sloping trendline is drawn from previous swing highs, indicating a resistance zone. The recent price action shows that the stock has broken above this trendline with strong momentum, suggesting a potential trend reversal or breakout.
2. Volume
The chart highlights rising volumes as the price breaks out of the trendline. Increasing volume during a breakout adds strength to the move, confirming that buyers are stepping in.
3.Price Pattern
A Triple Double Bottom pattern is visible at the bottom, marked by three distinct touches at the same support level. A triple bottom is a bullish reversal pattern, and the breakout above the trendline validates the pattern, indicating a potential upward move.
4. 20 EMA (Exponential Moving Average)
The price is trading above the 20 EMA, which shows short-term bullish momentum. Sustained trading above this level confirms that the stock is in an uptrend.
5.Suggested Trade Setup:
Entry: After a retest of the trendline around ₹400–405 or on a continuation above the breakout candle high of ₹419.40.
Stop Loss (SL): Below the recent swing low or the 20 EMA, around ₹385.
Target: First target: ₹450 (psychological level and prior resistance).
Second target: ₹475 (previous supply zone).
Educational Disclaimer:
This analysis is for educational purposes only and should not be considered financial advice. Please conduct your own research or consult a professional advisor before making any trading decisions.

Pearl Global Industries Ltd – Stock Worth Watching!🔹 Why is it Interesting?
✅ Uptrend Intact – Stock continues to move higher.
✅ Higher Highs & Higher Lows (HH-HL) Structure – Bullish price action remains strong.
✅ Respecting Trend Channel – Trading within an ascending channel, bouncing off key levels.
✅ Above Key Moving Averages (DMAs) – Staying strong above critical supports.
✅ Bullish Patterns Forming –
📍 Triple Bottom – A strong base for a potential breakout.
📍 VCP (Volatility Contraction Pattern) & Cup & Handle – Classic bullish setups on the daily timeframe.
🎯 Trading Plan
🔹 Entry: Small test position above ₹1500 on a daily close.
🔹 Safer Entry: Wait for a weekly close above ₹1500 for confirmation.
🔹 Stop-Loss (SL): ₹1162 (closing basis)
🔹 Risk per Trade: ₹1500 - ₹1162 = ₹338 (~22.53%)
🔹 Key Condition: Volume should improve—wait for a clean breakout.
📊 Key Fundamentals
💰 Market Cap: ₹6,842 Cr
📈 Stock P/E: 31.8
📊 ROCE: 21.4% | ROE: 21.9%
📊 Sales & EPS Improving YoY – Strong growth trend
⚠️ Why Small Position?
🚨 Market is in a downtrend – We are trading against the broader trend.
🚨 Deep SL (~22.53%) – If the market falls further, stop-loss might get hit.
🔥 Why Consider It?
👉 Stocks like these can be potential winners once the market stabilizes. Keeping it on the watchlist is worthwhile!
📊 Monitor price action closely before committing fully!

$BTC Forms Triple Bottom Pattern - Key Levels to Watch!#Bitcoin has formed a triple bottom pattern. To validate this pattern, BTC needs to hold the $91,500 level. A potential scenario is a bounce from the oversold RSI area, which could lead to a retest of $101,750 or even a breakout toward the $115,000 region. However, if BTC loses the $91,500 level, the next major support is at $90,000. A breakdown below that could see BTC dipping to $85,000, $80,000, or even $75,000. Let's see how the price action unfolds!
long - 93000$
short - 90000$


Multipattern Analysis on IDFC First Bank!NSE:IDFCFIRSTB Analysis!
Multipattern Analysis on $NSE:IDFCFIRSTB!
Analysis on a Weekly Timeframe!
Analysis:
I have done the overfall analysis of IDFCFIRSTB since its inception. It looks very complicated but if you know all the patterns it is just like anything. I have combined all the patterns with the Support and Resistance Trendline. Don't get confused. Read the chart thoroughly and you'll get a better idea of where to enter and where to exit. As you can see in Chart 3 most important reversal patterns are there.
1) Triple Bottom Pattern 2) Double Bottom Pattern 3) Inverted Head and Shoulders Pattern
Now the price is moving in a parallel channel but we can see the Flag and Pole Pattern Formation is going on. Aggressive investors can enter at current price levels as the price is above 50EMA. But my suggestion would be to enter only after the upside channel breakout.
Trade Setup:
Entry= Current levels are good for aggressive investors. Conservative investors can enter after Flag/upper channel breakout
Target= Nearest Possible Target would be 100.70(New All-Time High Level)
Stop Loss= Below 75.66
Disclaimer = Consider my analysis for Educational Purposes only.
Before entering into any trade -
1) Educate Yourself
2) Do your research and analysis
3) Define your Risk to Reward ratio
4) Don't trade with full capital

Epigral-DO NOT MISS!Logic:-RSI positive divergence near trendline support followed by Consolidation breakout
Epigral is yet another chemical stock showing reversal signs. It has got decent return ratios (ROE , ROCE above 30% ) and PE ratio of 18 at CMP.
Relatively safer stock to bet as technofundamentals are strong together.
Happy trading!

#MATIC/USDT Technical Outlook: Bullish Trend Ahead#MATIC/USDT has shown a triple bottom pattern and is currently attempting to break out of a falling channel. If it successfully breaks out, we could potentially see a target price of $1.20.

Keep An Eye - Triple Bottom - HINDPETRO📊 Script: HINDPETRO
📊 Sector: Refineries
📊 Industry: Refineries
Key highlights: 💡⚡
📈 Script is forming Triple Bottom on Weekly Chart, it has given breakout once and again it retested.
📈 Script is trading near neck line of Triple Bottom which is around 492.
📈 Keep an eye on stock, we may see breakout of it and some good rally into the stock.
📈 One can go for Swing Trade.
⏱️ C.M.P 📑💰- 492
🟢 Target 🎯🏆 - 534/555
⚠️ Important: Always maintain your Risk & Reward Ratio.
✅Like and follow to never miss a new idea!✅
Disclaimer: I am not SEBI Registered Advisor. My posts are purely for training and educational purposes.
Eat🍜 Sleep😴 TradingView📈 Repeat 🔁
Happy learning with trading. Cheers!🥂

Syngene-A pre breakout trade for good returns!Sygene is a pharma stock which is consolidating from few months now.
Stock has formed triple bottom pattern near its strong support and now showing signs of reversal
Confirmation is when stock gives weekly closing above 750.
Risky traders can keep this stock in watchlist

USDT.D FORMED TRIPLE BOTTOM USDT.D formed bullish which is going to cross resistance trendline makes more bleed in btc and altcoins.

ANTONY WASTE seems right for my investing TASTEPE Ratio is 15.4 vs Industry PE ratio of 82.6.
- Annual Revenue rose 32%, in the last year to Rs 876.6 Crores. Its sector's average revenue growth for the last fiscal year was 26%.
- Annual Net Profit rose 0.3% in the last year to Rs 68.1 Crores. Its sector's average net profit growth for the last fiscal year was 49%.
- Quarterly Revenue fell 5.6% YoY to Rs 227.3 Crores. Its sector's average revenue growth YoY for the quarter was -16.5%.
- Quarterly Net profit fell 21.3% YoY to Rs 18.3 Crores. Its sector's average net profit growth YoY for the quarter was -16.7%.
It is one of the top five players in the Indian municipal waste management industry with a track record of 20 years.
Antony Waste Handling Cell Ltd is engaged in the business of mechanical power sweeping of roads, collection and transportation of waste, waste to energy project and undertake the designing, construction, operation and maintenance of the integrated waste management facility in Kanjurmarg, Mumbai.
During FY22, the Co. increased activity from its new contracts in Varanasi, Noida, Jhansi, New Delhi Municipal Corporation, increasing its geographical presence in 9 states in India through ongoing and completed projects. The Co. is the 2nd largest player in India.
