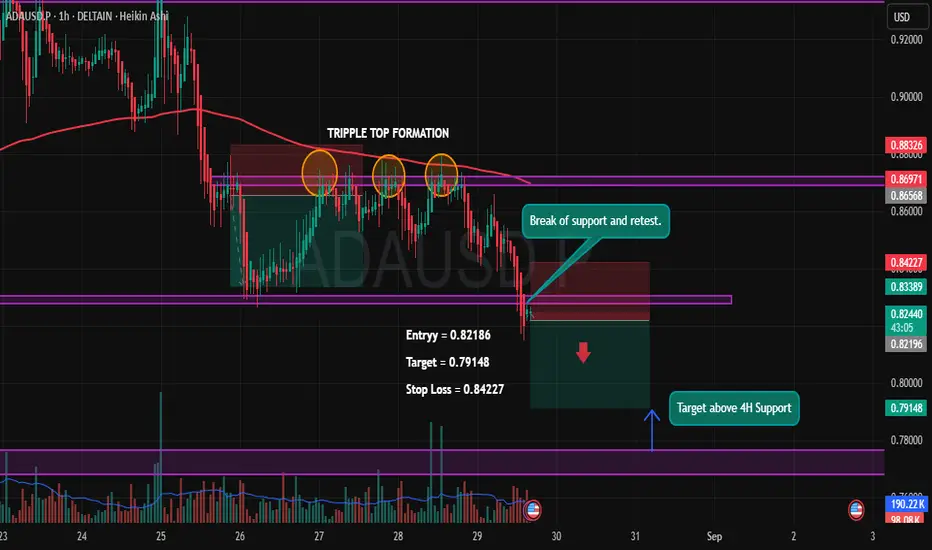
ADA/USDT – Triple Top Breakdown Play🔎 Setup Insight:
ADA has formed a Triple Top pattern near the 0.869 zone, confirming strong rejection from resistance. After multiple failed attempts to break higher, price finally broke down key support and is now retesting it, giving a clean short opportunity.
✨ Trade Plan:
Entry: 0.82186
Target: 0.79148 (Above 4H support zone)
Stop Loss: 0.84227
✅ Reasons for Short Bias:
Triple Top Formation ➝ Strong bearish reversal signal.
Break & Retest of Support ➝ Previous demand now acting as supply.
Confluence with 200 EMA rejection ➝ Trend remains bearish.
Volume Confirmation ➝ Selling volume stronger than buying.
🎯 Targeting the next major support on the 4H timeframe, with a favorable Risk-Reward setup.
⚠️ Disclaimer: This analysis is for educational purposes only and not financial advice. Always manage your risk before entering any trade.
Trippletop
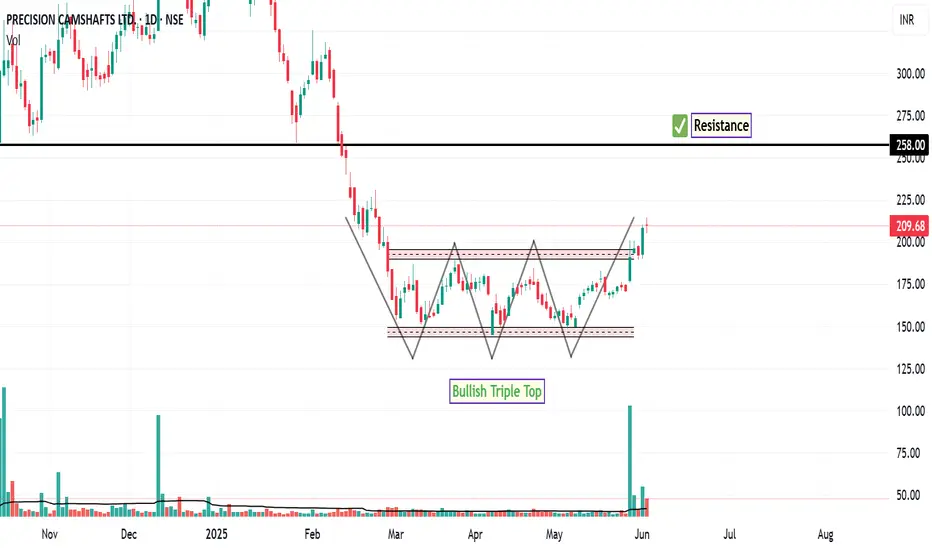
PRECAM: Next Level InsightThe daily chart of PRECAM is currently displaying a technically constructive setup. Notably, the price structure resembles a bullish triple top formation, which, in this context, appears to be acting as a continuation pattern rather than a reversal. This is further supported by a breakout above the recent consolidation range.
Importantly, this breakout has been accompanied by a noticeable increase in trading volume over the past five sessions, which may suggest growing market participation and interest in the stock at current levels.
Key technical indicators are aligned with this bullish momentum:
RSI is trading above the 70 mark , indicating strong upward momentum.
MACD is positioned above the zero line , with the signal line maintaining a positive crossover.
MACD Histogram remains in positive territory, reinforcing the prevailing bullish sentiment.
Based on this setup, the next potential area of price interest or resistance could emerge near the ₹258 level. On the downside, the immediate support lies just below the prior consolidation zone near ₹145 . A sustained move below this level could act as a technical invalidation point for short-term bullish setups and may prompt risk management actions.
Disclaimer:
This analysis is intended solely for informational and educational purposes. It does not constitute investment advice, a recommendation, or an offer to buy or sell any financial instrument. All investments carry risk, and past performance is not indicative of future results. Individuals should conduct their own due diligence or consult with a qualified financial advisor before making any investment decisions.
tripple top in m&m weekly 1. tripple top formed
2. inverse flag formation
3. with min sl one can go for short with strict sl (trail)

Will NIfty break 18200?Nifty 50 continuously trading in bullish momentum from the past week after getting the breakout of the parallel channel now moving toward the 18200 level.
18200 Level is a very important resistance zone 18200-18250 thus if this level breaks out we can see a very high probability to reach up to previous high.
17600 is acting as a great support for nifty.

MASTEK TRIPPLE TOP BREAKDOWNMASTEK (W), perfect tripple top formation breakdown happening at 2450 range. Tripple top formation done at 3350 range. Next buying range evolving at 1550 range as tripple top breakdown target plus 200ema (weekly). Invalid if mastek reclaims 2550 plus range.

Tripple Top Pattern BEARISH At Nifty50Tripple Top Pattern Formed At Nifty 50 Daily Chart.
A triple top formation is a bearish pattern since the pattern interrupts an uptrend and results in a trend change to the downside.
Global Signals Huge Down Fall in Stock Mkt soon
*For Education purpose

IIFL will reach All-time high levels?IIFL recently broke out from the W pattern(Tripple Top) and retested the same levels within a few days. It bounced back from the previous resistance levels and looks like it's gonna reach the all-time high level which is around 440.
Cheers! This is as per my Analysis. Feel free to share your view about this. Please do your analysis before trading/Investing.
Happy Trading

Nifty: High risk tradersNifty
Consider selling Nifty for target of 17080 / 17030 till expiry
SL : Exit if closing is above 17450
High risk traders may consider buying 30 Sept expiry 17200 Put option currently around 90
The view could be biased because of previous update
Previously had suggested selling 17500 Call option at 100
Overall we now have synthetic short (giving us protection for a rise up to 17510 till 30 Sept expiry)
Take care & safe trading...!!!
Disclaimer
- The view expressed here is my personal view
- Past performance is not a guarantee for future predictions
- Use this for educational purpose
- Any decision you take, you need to take responsibility for the same
- It's your hard earned money. Treat it wisely
- Trade / Invest keeping in mind your trading style, goals and objectives, time horizon & risk tolerance
- if trading in F&O, understand that F&O trading involves risk
- Do take proper risk management measures
- Do your own analysis and consult your financial adviser if need be

Nifty: Would it continue or are the legs getting tired???Nifty
On rise, one may look to sell Nifty.
T1 and T2 are highlighted in charts
SL one may keep a SL at 17442 for Nifty
Disclaimer
- The view expressed here is my personal view
- Past performance is not a guarantee for future predictions
- Use this for educational purpose
- Any decision you take, you need to take responsibility for the same
- It's your hard earned money. Treat it wisely
- Trade / Invest keeping in mind your trading style, goals and objectives, time horizon & risk tolerance
- if trading in F&O, understand that F&O trading involves risk
- Do take proper risk management measures
- Do your own analysis and consult your financial adviser if need be

GOOD FOR SHORT ASIANPAINT INTRA IDEATRIPPLE TOP PATTERN A GOOD SUPPORT AND TRENDLINE GIVES US GOOD CONFIDENCE SHORT BELOW 2540

CIPLA TRIPPLE TOPCIPLA has given breakdown as well as made a tripple top. Seems weak for 724/706/686/652
Regards

AUDUSD Bearish triple topAUDUSD is showing the formation of a Bearish triple top pattern in M30, H1, and H4. Possible short opportunity.

GNFC... will bottom fish later on if fundamentals are intactDisclaimer.. not invested..
not an investing/trading recommendation

Potential Short opportunity for EurJpy ??133.00 is the key resistance which can be seen on Daily chart.
A double top was formed during the past two days trading session.
Price has since trying it's last push higher.
I am anticipating a triple top to form, press the price lower.
My position :
Entry : 132.65
SL : 133.15
TP : 131.90
** This is not a Buy/Sell recommendation **'
** Please do your own due diligence **
