$TRX PRICE FORECAST | IS $5 POSSIBLE? | ANALYSIS BY CRYPTOPATELCRYPTOCAP:TRX PRICE FORECAST | IS $5 POSSIBLE? | ANALYSIS BY CRYPTOPATEL
#TRX Is Quietly Building A Massive Multi-Year Base On The 2W Chart.
Price Has Respected The Same Rising HTF Trendline Since 2020 — A Clear Sign Of Long-Term Strength.
Technical Highlights:
✅ Clean Higher Highs & Higher Lows
✅ Multi-Year Ascending HTF Trendline Holding
✅ Strong HTF Demand Zone Holding At ~$0.25
✅ Extended Consolidation → Expansion Setup
✅ Macro Trend Bias Remains Bullish
CryptoPatel Targets: $1 → $2 → $5+
Invalidation: ❌ Weekly Close Below ~$0.20
As Long As TRX/USDT Holds Above $0.25, The Bullish Structure Remains Intact.
A Loss Of This Level Would Break The Macro Thesis.
Cycle Outlook:
2025 = Compression Phase
2026–2027 = Potential Parabolic Expansion
TA Only | DYOR | Not Financial Advice
TRON

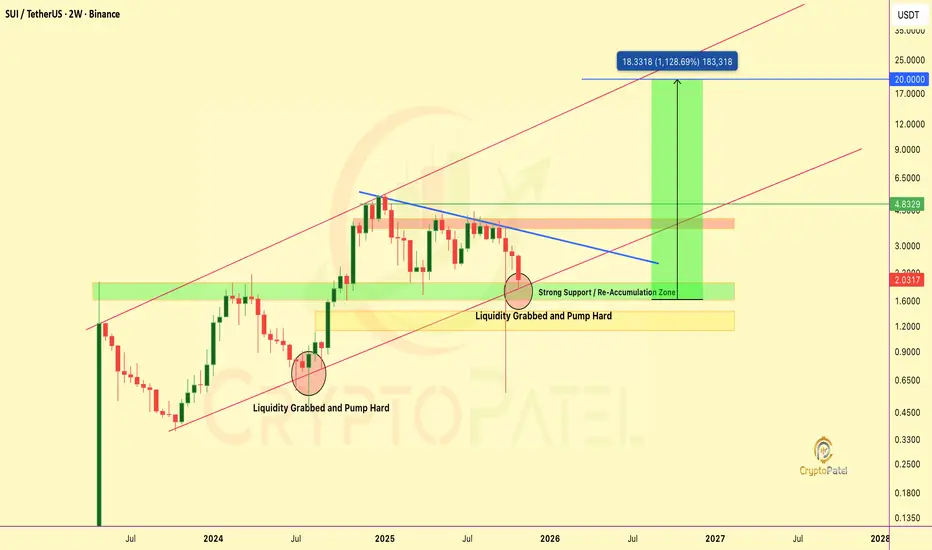
SUI– Breakout Setup Forming, Bulls Eyeing a Move Toward $20SUI/USDT – Breakout Setup Forming, Bulls Eyeing a Move Toward $20
SUI is building a strong re-accumulation base after months of correction. The $1.6–$2 demand zone continues to attract heavy buying interest, the same zone that triggered the last major rally.
Technical Highlights:
✅ Multiple liquidity grabs with strong rebounds
✅ $1.6–$2 zone acting as key accumulation area
✅ Descending trendline compression nearing breakout
✅ Structure remains bullish above $1.6
A confirmed breakout above the descending trendline could launch SUI into a high-momentum phase, targeting higher resistances.
Upside Levels: $4.8 / $10 / $20 – Macro channel target
Accumulation View:
Smart money is active below $2, positioning early before expansion. As long as $1.6 holds, the structure favors a bullish continuation.
High compression. Low noise. When this trendline breaks, volatility will speak loud. NFA & DYOR
Will TRON hit $2 in this bull run?If CRYPTOCAP:TRX loses $0.26 I'm deleting this tweet. If it holds? We're going to $2 💎
Currently: $0.26 ✅
Target: $2.00 🔜
Upside: 600%
Bulls in full control and NOT losing this level 💪
Screenshot this tweet
NFA & DYOR

TRON $TRX WILL BOUNCE BACK HARDCRYPTOCAP:TRX 💰4H Analysis
Right now, the price is testing a buy zone around $0.2926–$0.2982. If there’s a quick bounce from this area, it could be a good spot to open long positions 🐬. The main idea is to catch the reversal and target a move back up to the highlighted POI zone.
🚀Long targets: $0.3135, $0.3250, $0.3330 for Scalping.

Will TRON hit $1 Club?TRON rise has been nothing short of epic.
From $0.0068 at launch to $0.36 today, over 50x growth.
$1 isn’t a dream anymore… it’s getting closer every day.
Who’s ready for CRYPTOCAP:TRX to crash into the $1 club? 🚀
NFA & DYOR

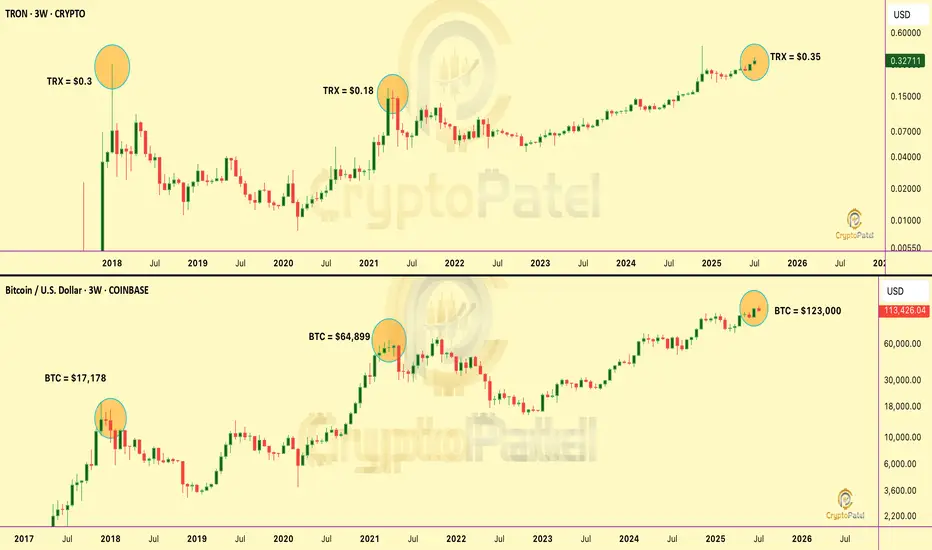
$TRX is the most slept-on asset in crypto. Here’s why🚨 CRYPTOCAP:TRX is the most slept-on asset in crypto. Here’s why 👇
📌 In Jan 2018, TRX hit $0.30 when #Bitcoin was only $17,178
📌 In 2021, TRX was $0.18 with BTC at $64,899
📌 Today BTC is $113,000, but TRX is still just $0.32
How is TRX still lagging… despite tech, adoption, and ecosystem growth?
It’s time to rewrite the narrative.
It’s time to Make TRON Great Again. #MTGA 🔺
Much respect to justinsuntron & trondao
Builders never stop. The community stands with you. 💪
NFA & DYOR
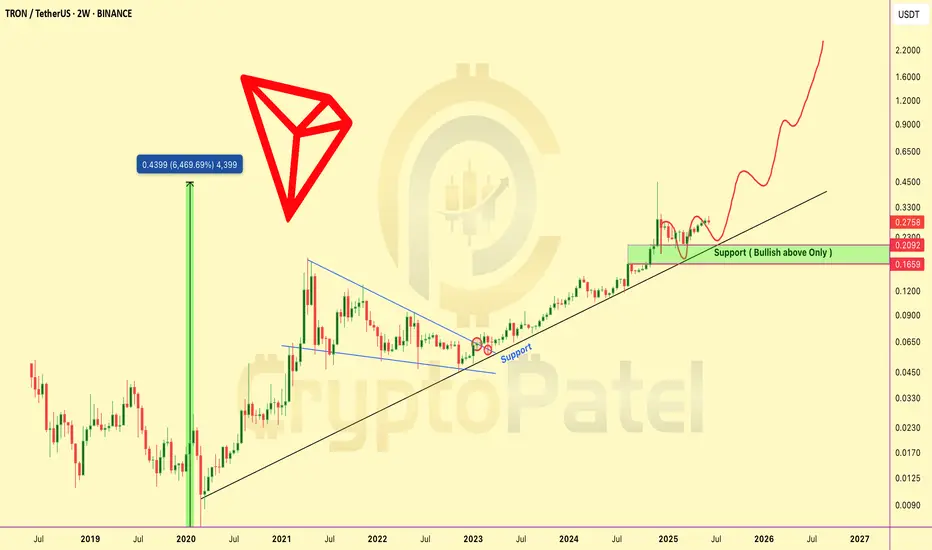
TRX NEXT EXPLOSION INCOMING? TRX NEXT EXPLOSION INCOMING?
TRX is showing a strong bullish setup after breaking out of a long-term consolidation pattern.
🔹 Price has cleanly broken out of a multi-year descending structure
🔹 Retested the key support zone around $0.21–$0.23
🔹 Still respecting the long-term ascending trendline from 2020
🔹 Historical move: 6,469% rally in the previous cycle — current structure suggests similar potential
Key Technical Levels to Watch:
🟩 Support Zone: $0.209–$0.230
🟩 As long as TRX holds above this level, bias remains bullish
🟩 This is a breakout + retest scenario.
🟩 Potential Upside Targets: $0.65 → $1.20 → $2.20+
The chart structure is indicating the possibility of a strong uptrend continuation, with bullish momentum building on higher timeframes.
TRX is technically strong and could be gearing up for a major leg higher if key support holds.
Add it to your watchlist. NFA & DYOR
BTC/USDT – 30-Min Chart Technical BreakdownBTC/USDT – 30-Min Chart Technical Breakdown
🔺 Pattern Formation:
Price action is currently developing a rising wedge, generally considered a bearish continuation pattern. However, the ongoing Higher High (HH) and Higher Low (HL) structure suggests short-term bullish momentum is still intact.
Key Resistance Levels:
* $84,700 – Major horizontal resistance
* $83,600 – Local supply zone / recent rejection point
Key Support Levels:
* $81,200 – Trendline + structure support (wedge base)
* $78,400 – Secondary structural support
* $74,900 – High-confluence demand zone
Long Setup (High-Risk Trade – Counter to Pattern Bias):
* Entry Zone: $82,500 – $83,000 (wedge support retest zone)
* TP1: $83,900
* TP2: $85,200
* TP3: $87,000 (upper wedge boundary)
* SL: Below $81,100 (wedge break + structural invalidation)
Confirmation Needed:
Watch for bullish engulfing or a strong bounce from the wedge support (red dashed trendline) with solid volume influx.
Risk Note:
Despite current bullish flow, wedge patterns often resolve bearishly. If price breaches below $81,100, invalidate longs and reassess for possible shorting opportunity.

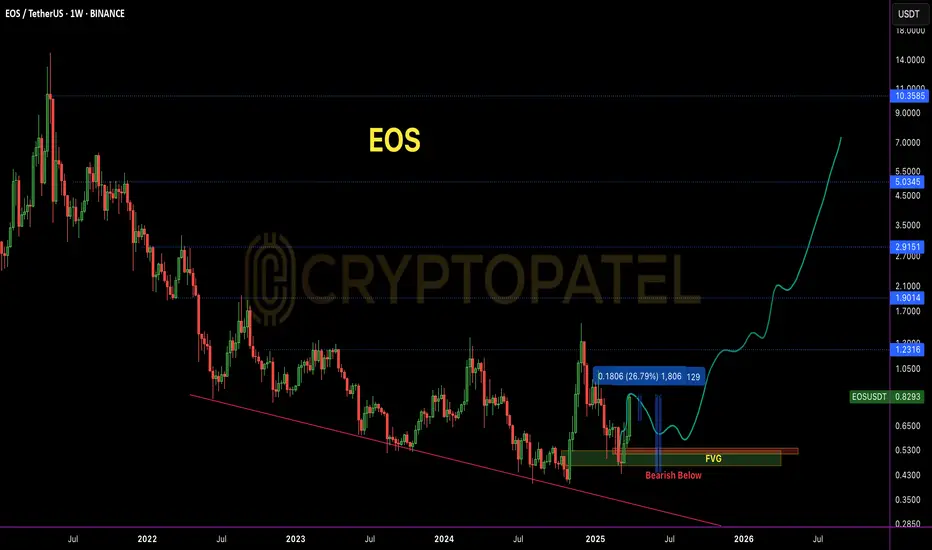
EOS Broke Out After Months — But Is This Just the Beginning?NYSE:EOS Broke Out After Months — But Is This Just the Beginning?
#EOS was once a top-tier asset, trading above $15. However, due to consistent development delays and unmet commitments, the price structure gradually broke down, eventually bottoming near the $0.40 zone — a key historical demand area.
Recent Development: EOS witnessed a sharp rally of +94% in the last month, with a strong +26% daily candle, backed by bullish news:
✅ Formation of Vaulta Banking Advisory Council (includes ex-Binance Canada CEO)
✅ CMO Tristan Dickinson teased a major upcoming announcement
Current Market Structure:
▶️ Price broke out of a long-term accumulation range
▶️ Volume spike confirms genuine interest
▶️ However, one FVG (Fair Value Gap) is still unfilled between $0.60–$0.50 zone on the 4H chart
Ideal Entry Zone (Pullback Play):
▶️ Watch for a retest near $0.60–$0.50
▶️ FVG fill + potential bullish OB (Order Block) = Confluence zone for long setups
🛑 Invalidation / Stop-Loss:
▶️ Breakdown below $0.43 on high volume will invalidate the structure
▶️ SL is wide, but RR (Risk-Reward) setup is favorable for swing traders
Long-Term Upside Targets:
First target: $0.95–$1.10 (range high breakout)
Mid-term target: $1.45+
Long-term potential if fundamentals sustain
⚠️ Manage your position size. NFA | DYOR | Risk Management is Key
Ethereum Accumulation Alert! 🚀 Ethereum Accumulation Alert! 🔥
Ethereum is entering a potential spring accumulation zone, presenting a solid long-term opportunity.
📉 Buy Zone: $1,900 – $1,550
🎯 Targets: $5,000 / $7,500 / $10,000
🔹 Key Support: $1,550 – Holding above this level keeps the bullish structure intact.
🔹 Breakdown Risk: If ETH loses $1,550, expect further downside toward sub-$1,000, where the next strong entry lies.
📊 Smart money is accumulating—don’t miss the dip!
#Ethereum #CryptoTrading #Accumulation #ETH #NFA #DYOR

#TRON to $1? Highly Possible! But Gold Entry is Key #TRON to $1? Highly Possible! But Gold Entry is Key 🚀
📉 Best Accumulation Zone for CRYPTOCAP:TRX : $0.140 - $0.10
🏆 Patience & Strategy Win the Game!
NFA. DYOR!
CRYPTOCAP:TRX #Altcoins

$TRX hit our 200% target as predicted! 🚀 CRYPTOCAP:TRX hit our 200% target as predicted!
Tron is showing strong momentum, and I still believe $1 is possible this bull run!
📉 Best buy zone: $0.180 - $0.160 (if we get it).
Who’s holding TRX to $1?
RT & Like if you’re bullish! 🔄

Trx offering good opportunity to grab.Tron chart showing clear breakdown in 4hr candle and have a 10% upside potential.

TRON Bull Market Performance Over the Years:#TRON Bull Market Performance Over the Years:
2017 Bull Market: 🚀 +23,800%
2021 Bull Market: 🚀 +1,650%
2025 Bull Market: +900% till now
My Take: TRX/USDT is $1 Potential But CRYPTOCAP:TRX has likely delivered most of its returns already. While it may pump again, don't expect massive gains in this cycle.
📊 IMO, $0.60 is a good exit range. Anything above $0.6 would be a bonus!
NFA & DYOR
#TRX #Crypto

TRON bullish toward $0.5 ?#TRON is looking bullish!
All resistance levels have been broken, and it's now heading toward $0.30-$0.50. I'm expecting a 200-300% upward move from here.
Strong support at $0.140

Tron is gaining movement in bullish wedge and heading to 0.15$Tron is continuously trading in long time bullish wedge and now it's gaining momentum after touch the bottom of this wedge if it's true it can touch 0.150 mark very soon.

TRX’s price has pumped by 0.57% in the last 24 hours.1) TRX could hit $0.088 in 2023
2) TRON’s price prediction for the most bearish scenario will value TRX at $0.057 in 2023
3) TRON’s previous All Time High was on 5th January 2018 where TRX was priced at $0.23
4) To simplify the latest TRX price prediction, we have divided up the prediction by short term TRON price prediction and long term TRON price prediction.
5) TRX had a trading volume of $288,753,858. TRON has gone up by 3.94% in the past 30 days.
6) According to our analysis in the short term, TRON price prediction for August 2023 shows the average price of TRX at $0.068 and the highest possible price for August 2023 would be $0.072.
7) Further, according to our analysis in the long term, TRON price prediction for December 2023 shows the average price of TRX at $0.073 and the highest possible price for December 2023 would be $0.078.

Tron weekly chartTrx is forming a triangle pattern in weekly timeframe
And has shown no move since months
I hope it will give good move once came out of this cage

TRX USDT Movement pattern by OnlineBeetlebuy red sell green go green/
that's all I have to say trade at your own risk this is not financial advice this is my personal opinion.

TRX/USDT #CRYPTOCURRENCIES HIGH RISK TRX Long Idea.
DYOR, however TRX has been highly bullish over last few weeks, as total locked value crossed 6 billion.
Expecting a successful quick scalp.

TRON BULLISH CUP AND HANDLETRON BURNS MORE THAN GENERATED.. bullish cup and handle formed and retest completed.. long here

TRXUSDT SHORTTron had tried to balance its price in recent days but now it is going tank. It can drop to .55$ in my view.

SUN- uniswap of tronTron gaining momentum, might benefit sun as well. Waiting on breakout in volume, personally.
