Gold ATH Is Not Random – It’s a War to Defend the USDBombs and bullets are just smoke screens.
The real war is about who still controls the world’s money.
And that’s why Trump appears at the right time.
This is not a shooting war.
It’s a war to protect the US dollar.
If you look at US actions separately, everything feels messy:
Pressure on Iran
Sanctions and control over Venezuela
Tough stance with Russia, yet still talking
For new traders → it looks chaotic.
But once you put everything on one chessboard, there’s only one objective:
👉 Make sure the world still needs USD.
Not oil.
Not Iran.
Not Venezuela.
👉 Settlement currency.
Why is USD so important?
The US today:
Doesn’t compete on cheap labor
Doesn’t mass-produce low-cost goods
Doesn’t live off exports
👉 The US lives on money and the financial system.
If USD loses its central role:
Printing money becomes hard
National debt becomes a real burden
Military power loses its “credit-backed” strength
👉 Lose USD = lose superpower status.
Where does the real problem start?
Some countries sell oil to China without using USD, instead using:
Chinese yuan
Bilateral swaps
Systems outside US control
👉 For the US, this is a direct attack on the foundation of its power,
without firing a single bullet.
So what is Trump doing?
Not fighting to seize oil.
Not fighting to take land.
👉 Trump is making non-USD oil trading risky.
Very pragmatic moves:
Creating controlled instability
Disrupting “off-system” oil flows
Forcing countries back to USD because… it’s safer
A simple example for traders
Imagine a market where only one currency is accepted.
You want to buy anything?
You must use that currency.
One day, some stalls say:
“We’ll accept another currency. It’s cheaper.”
The market owner doesn’t shut them down.
He just:
Makes selling harder
Increases delivery risks
Tightens inspections
👉 Eventually, those stalls go back to the old currency to avoid headaches.
That’s exactly how USD and oil work.
Putting it all together – the trader’s view
Iran – Venezuela – Middle East
These are not random events.
👉 This is a war to maintain the monetary order.
Trump:
Isn’t fighting for oil
Isn’t fighting for morality
👉 He’s fighting for the settlement currency.
Anyone who makes the world less dependent on USD
automatically becomes a target.
CONCLUSION – trader style, slightly sarcastic 😄
Gold ATH is not the market being crazy.
👉 It’s the result of a war to protect the global “toll currency.”
If you understand this:
Charts feel less “stupid”
You stop wanting to short every high candle
Your account suffers less heart attacks
But wait 😄
The real question is:
If the big players are fighting a monetary chess game,
where should retail traders stand to avoid getting wiped out?
In the next part, I’ll talk about:
Why SELLING gold at ATH is extremely hard to survive
When chasing BUYs is stupid – and when it’s actually right
How traders can protect their rice bowl when the chart runs like it’s being chased
👉 If this hits home, drop a 🚀
Enough 🚀 and I’ll continue – no secrets 😏
Trump

Nifty ATH vs. Trump’s War: Monday Levels to watchNifty just hit a historic All-Time High of 26,340 on Friday. But over the weekend, Donald Trump sent shockwaves through the world—attacking Venezuela and capturing Maduro. This Monday, we aren't just trading charts; we are trading geopolitics. Is this the end of the rally or a massive 'Buy the Dip' opportunity? Let’s look at the pre-market levels.

$TRUMP TOKEN: A 92% MASSACRE IN JUST 316 DAYS$TRUMP TOKEN: A 92% MASSACRE IN JUST 316 DAYS: WHAT THE HELL JUST HAPPENED? 😡
Let’s talk about the BRUTAL reality of celebrity/president tokens:
THE NUMBERS DON’T LIE:
🔹 ATH: $79.70 (January 19, 2025)
🔹 TODAY: $5.69 (December 1, 2025)
🔹 DOWN 92.58% IN LESS THAN A YEAR
316 DAYS: Not even a full year and your portfolio is DESTROYED.
THE REALITY CHECK:
If you bought $1,000 at ATH → Your bag is worth only ~$71 TODAY 💀
WHO PROFITED?
✅ Early insiders who dumped on retail
✅ VCs who got free or discounted tokens
✅ Influencers who promoted and then silently exited
WHO GOT REKT?
❌ Retail investors who FOMO’d at the top
❌ Newbies who trusted the hype
❌ Anyone who didn’t take profits
MY REPEATED WARNING:
NEVER INVEST IN INFLUENCER/PRESIDENT TOKENS!
This is exactly why I keep saying:
🔹 Don’t chase celebrity coins
🔹 Your money is HARD-EARNED
🔹 These are pump & dump schemes disguised as “movements”
Is this crypto or a 3rd class memecoin casino? YOU DECIDE.
LESSON: Hype doesn’t pay bills. Due diligence does.
STAY SAFE. TRADE SMART. PROTECT YOUR CAPITAL.
NFA & DYOR

XAU/USD – 15-Minute Timeframe Analysis (Short Bias)Market Overview
Following the latest round of China–U.S. trade negotiations, market sentiment has shifted toward a more risk-on environment, reducing demand for safe-haven assets such as gold. As optimism surrounding the talks strengthens the U.S. dollar, gold prices have continued to decline during the Asian and early European sessions.
Technical Outlook
On the 15-minute timeframe, XAU/USD maintains a clear short-term bearish structure, characterized by consecutive lower highs and lower lows. The pair is currently trading below key moving averages, reinforcing the prevailing downward momentum.
A potential retracement toward intraday resistance could present a favorable opportunity for short positions, provided that bearish price action confirms rejection at that level.
Key Resistance: 2360 – 2365 zone (previous support turned resistance)
Immediate Support: 2348 – 2350 zone
Extended Support Target: 2338 – 2340
$TRUMP MEMECOIN: -98% DRAWDOWN ANALYSIS$TRUMP MEMECOIN: -98% DRAWDOWN ANALYSIS
TECHNICAL BREAKDOWN:
▶️ ATH Distribution: $70 (Exit signal executed)
▶️v Current Price Action: 98% retracement from peak
▶️ Market Structure: Parabolic blow-off → capitulation phase complete
▶️ Performance validates early exit thesis.
CURRENT MARKET STRUCTURE:
▶️ Bias: Bearish continuation
▶️ Key Resistance: $8.00 (structural pivot)
▶️ Invalidation Level: Sustained break above $8 with volume
▶️ Breakout scenario → $50 measured move target
▶️ Probability: Low (requires liquidity catalyst)
SPECULATIVE OPPORTUNITY (HIGH RISK):
▶️ Asset Class: Extreme volatility / lottery ticket
▶️ Entry Thesis: 92% discount from ATH = asymmetric R/R
▶️ Position Allocation: 1-2% max portfolio weight
▶️ Time Horizon: 12-24 month hold
▶️ Stop Loss: Total loss acceptable
▶️ This is binary outcome speculation, not investing.
INSTITUTIONAL PERSPECTIVE:
▶️ Celebrity token = coordinated distribution to retail
▶️ Tokenomics favor insiders
▶️ Liquidity profile indicates exit event completed
▶️ Capital preservation >> speculative moonshots
Risk Disclosure: Speculative asset. Trade accordingly.
⚠️ NOTE: Never invest hard-earned money in celebrity/influencer tokens. These are engineered liquidity extraction schemes, not legitimate projects.
Capital preservation > moonshot gambling.
NFa & DYOR

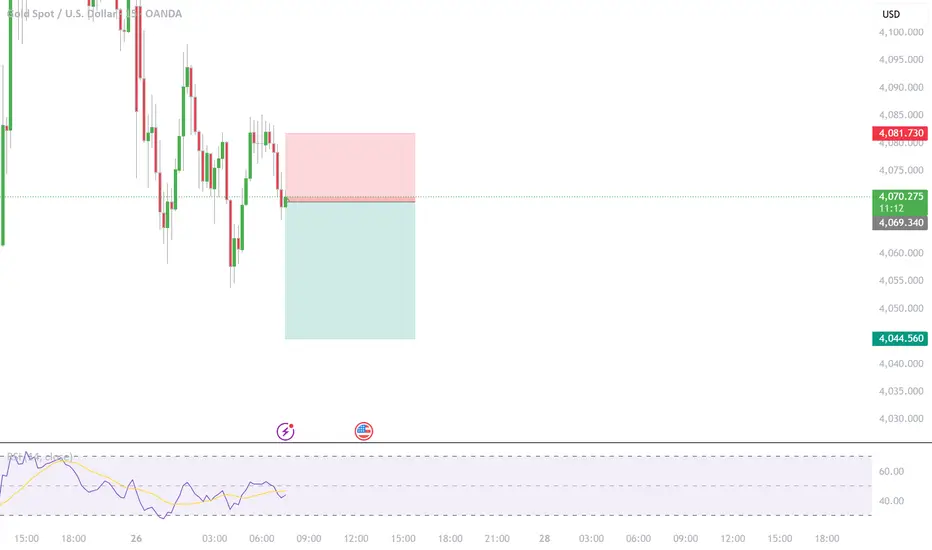
XAUUSD HIT MY STOP LOSSGold just broke above our previous OB/Liquidity resistance around 4040–4055, taking out the short-side liquidity and confirming a bullish market structure shift (MSB) on 15M and 1H timeframes.
🔹 Previous plan: Sell-limit at resistance — invalidated as price made a new high.
🔹 Current bias: Bullish continuation towards 4078 → 4095 → 4120.
🔹 Pullback zones to watch:
• 4035–4045 (OB retest / liquidity grab area)
• 4005–4020 (golden pocket confluence)
🧠 Trading Plan:
Wait for price to retrace into key support zones.
Look for bullish rejection / confirmation before entering long.
First TP near 4078, extended targets 4095+
SL below 4020 zone (structure invalidation).
💬 Price action respected structure beautifully. Remember — the market doesn’t care about our limits, only about liquidity.
Trade what’s visible, not what’s emotional.
#XAUUSD #GoldForecast #ForexTrader #SmartMoneyConcepts #LuxAlgo #OrderBlockTrading #LiquiditySweep #PriceAction #GoldAnalysis #TradingStrategy #TechnicalAnalysis #ForexSetup #DayTrading #ChartAnalysis #TradingView #alphatechfinances

POSITIVE Vision!IF Prices stands over 3406! We can expect a bullish months ahead.
Else in a big TF we are in super over bought conditions. We can see a big free fall at any times. Happy Monday folks!

Choas! FEDvsJust think! There is a possibility to price reach 3406 region by fake news and fall hard !...
WW1 111 years completion.
9th of av ahead.
September needs some drama too.
Don't be bullish until price set new high in XAUUSD.

$SEI to $2? Trump-backed + Institutional Buys = Next Altcoin NYSE:SEI to $2? Trump-backed + Institutional Buys = Next Altcoin Rocket!
#SEI already pumped +100% from our entry! Hope you enjoyed the ride.
But I’m still massively bullish on this setup.
▶️ Price is consolidating near strong support at $0.20–$0.14
▶️ This is a golden accumulation zone for the next leg up!
▶️ Backed by Trump’s Liberty Financial & multiple institutional buys
▶️ My targets for this bull run: $1 → $2 → $3 → $4
Still early. Still bullish. Still time.
Note: Not Financial Advice so Do your Own Research before investing.
#Altcoins

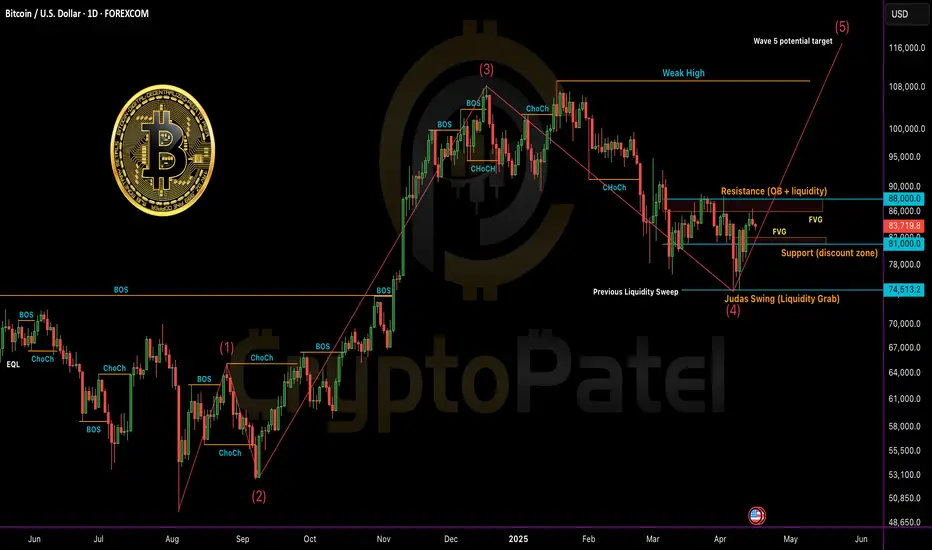
Bitcoin (BTC/USDT) – Full Technical Breakdown - Timeframe: 1DBitcoin (BTC/USDT) – Full Technical Breakdown - Timeframe: 1D
Market Structure & SMC (Smart Money Concepts)
✅ CHoCH (Change of Character) confirmed from $105K top → current lower high around FWB:88K zone.
📉 Break of Structure (BOS) to the downside occurred at $91K.
🟠 Bearish Order Block (OB): $86K– FWB:88K (price currently reacting here).
Liquidity Levels:
Sell-side: Swept at $76K
Buy-side: Sitting above FWB:88K
Fair Value Gap (FVG): Unfilled zone between $81K– GETTEX:82K may act as magnet for price.
ICT Model Alignment
Judas Swing: Sharp liquidity grab below $76K → followed by rebound — classic manipulation before real move.
PD Array Setup:
Resistance: FWB:88K (bearish OB + buy-side liquidity)
Support: $81K (discount zone + FVG)
Elliott Wave Outlook
Wave 1: July–Sept 2024
Wave 3: Nov–Feb rally to $105K (extended wave)
Wave 4: Correction to $76K likely complete
Wave 5 Target: Potential $115K+ if structure holds
Fractal Observation
🔹 Current price structure is mimicking Nov 2023–Jan 2024 pattern
🔹 If history rhymes: consolidation → breakout → retest → parabolic rally
Key Levels to Watch
🔼 Bullish Confirmation: Daily close above FWB:88K → targeting GETTEX:92K –$100K
🔽 Bearish Rejection: Drop below $81K → next support at $74K–$76K
Strategy Summary
🔹 Short-Term Bias: Cautiously Bullish
🔹 Entry Zone: Retest near GETTEX:82K (FVG + OB)
🔹 SL: Below $79.5K
🔹 TP Zones: FWB:88K → GETTEX:92K → GETTEX:98K
📈 R:R = Minimum 1:5 (High confluence)
Keep your eyes on HTF closures and manage risk. Liquidity traps are in play.
Everyone’s yelling “Rugpull!” over $OM because -90%+ But $TRUMP?🚨 Everyone’s yelling “Rugpull!” over CRYPTOCAP:OM because it's down 90%+…
But no one’s talking about the Official Donald Trump token $TRUMP — which also crashed over -90% from its ATH in just 3 months. 🤯
Isn’t that the same thing?
Seriously, what happens to the trader who aped in at $70+?
➡️ Just imagine the bag they're holding now. 😬
➡️ Not every memecoin with a “name tag” is safe.
➡️ Hype isn’t utility. Hype isn’t protection.
Feels scammy or just bad tokenomics?
You tell me. 💬

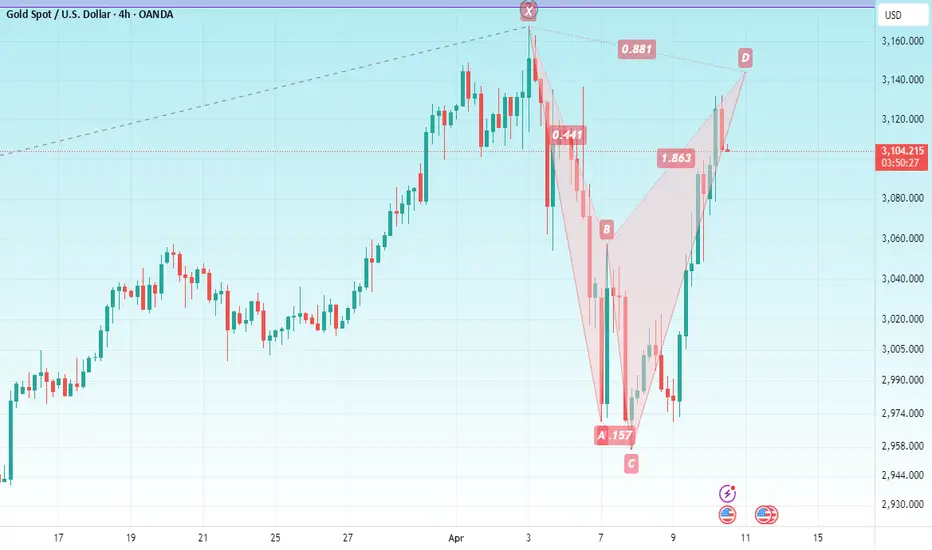
GOLDHello & welcome to this analysis
GOLD (Comex) 4hrs is going to enter the potential reversal zone of a bearish Harmonic Shark pattern between $3135 - $3155. Pattern negates above $3167.
Probable retracement levels $3100 / $ 3075 / $3025 / 2950
If it sustains above $3170-$3200 it gets v strong and will attempt $3300
The Market Looks Brutal Right Now... But Stay With MeThe Market Looks Brutal Right Now... But Stay With Me
It feels like a bloodbath out there… but here’s the truth:
A fast and brutal dump is honestly better than a slow, painful bleed. It shakes out the weak hands quickly—and sets the stage for stronger recoveries.
We've seen this movie before:
▪️ The Covid flash crash
▪️ War shocks like Russia vs Ukraine
▪️ Black swan events like FTX blowing up
▪️ The chaos of the LUNA death spiral
➡️ Each time, fear dominated the feed.
➡️ Each time, the "This time it's different!" crowd got louder.
➡️ And each time, those who stayed calm and DCA’d into real projects walked away with massive wins.
So why should this time—just because of tariffs or macro FUD—be any different?
It’s not.
Zoom out.
The long-term trend is built on strong fundamentals, not headlines.
Stick to the plan: accumulate multi-cycle, high-cap coins. Ride the wave.
The short-term noise fades, but smart strategy compounds.

Market Insights: Will #Nifty's Bottom Be Shaped by Recent News?As they say, history always rhymes. Will this time again be a repeat of history, repeating some pattern in #Nifty charts?
Let's study the past. Back in October 2021, when Nifty made a top around 18600, it went into a price and time-wise correction, taking over 35 weeks to form a major bottom in June 2022. This bottom was formed amid extreme negative sentiments due to the Russia-Ukraine crisis. During this bottom formation, the market broke down below the major consolidation zone of May 2021 to August 2021 and also closed below the weekly clouds. However, just prior to that, the market took support around cloud lows and rallied swiftly by 8-12% in May 2022. After forming the June 2022 bottom, Nifty went on to make a new high in November 2022, which was around 55 weeks from October 2021.
Now, let's see where we are. Nifty made a recent ATH back in September 2024, and since then, this correction is close to 27 weeks old. The market recently took support exactly at weekly cloud lows and rallied swiftly by 8-10%. As of now, it risks breaking down below the weekly cloud and may test or break below the major consolidation zone of December 2023 to June 2024.
The tariff war is an uncertain event in the history of markets, but markets, as they say, are always forward-looking and smarter than what an individual can think. Most of the time, bottoms are formed with extreme negative sentiments. Will this be a repeat of the past, or will this time be different?
Will Nifty attempt a new high or test the old high after about 55 weeks from September 2024, coinciding with Diwali 2025, giving investors a good time around Diwali? Or will this Diwali be different?
Only time can answer this, but I'm sharing these observations from my limited experience.
This post is not a recommendation for any buy or sell but purely an educational post to observe and learn from history.

GOLD CRASHES HARD — BUT THE BIG SHORT VIEW WAS ALREADY 🟡 GOLD CRASHES HARD — BUT THE BIG SHORT VIEW WAS ALREADY IN PLAY
Gold dropped — and dropped even harder than expected.
But for those following closely, this wasn’t a surprise.
From the start of April, we had been watching for signs of reversal after gold kept printing new ATHs. The candlestick behavior on the higher timeframes was already hinting at exhaustion — and today’s move validated that broader view.
🔍 Why I’ve Been Calling for a BIG SHORT — Not Just in Gold
This isn’t just about XAUUSD.
Zoom out and you’ll see the signs across the board:
US, EU, and Asian stock markets are in a steep decline
Crypto is stagnant, with no new capital inflow and little investor interest
And gold — after a historic run — is now facing intense profit-taking pressure, especially under growing geopolitical and global trade risks
In this environment, many investors are moving to cash and staying on the sidelines.
📉 DXY: A Potential Comeback?
The USD Index (DXY) has been heavily sold off in recent months.
But if you look closely — it's now testing a multi-year support zone that's held strong for nearly 3 years.
AD’s view?
If this level holds — and if recent tariff policies + international pressure from Trump continue — we could see a real USD recovery in the coming weeks.
Trump appears to be playing hardball — not just for his own benefit, but strategically for the U.S.
His aggressive trade moves are forcing nations to reconsider tariff terms. And in the short term, that puts Trump in a position of power — globally.
🤔 The Fed’s Dilemma
Even as Trump escalates trade pressure, the Fed remains cautious.
They’ve held back from rate cuts — waiting for clearer outcomes from these global negotiations.
All eyes are now on Trump’s next moves — and how other major economies will respond.
🔮 Strategy Moving Forward
Many investors are still in risk-off mode, hoarding cash and waiting for further declines.
AD still expects further downside in gold next week, alongside a potential short-term bounce in DXY.
→ After that, once the trade talk dust settles, we could very well see Gold resume its climb, while USD retests major supports on the D1 timeframe.
📌 I’ll be back with a full weekly outlook tomorrow, but for now — absorb this Gold/USD landscape and build your strategy for the new week.
Stay sharp & protect your capital.
— AD | Money Market Flow

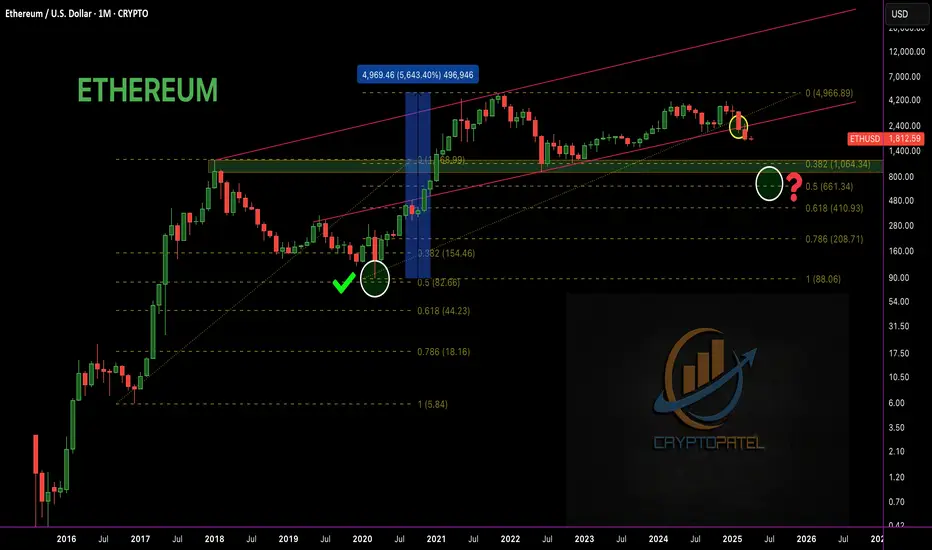
Will $ETH Drop Below $1,000 Before Heading to $7,000+? Will CRYPTOCAP:ETH Drop Below $1,000 Before Heading to $7,000+?
🟣 Historically, #ETH respected the 0.5 Fib retracement in bull markets – In the last bull run, ETH retraced to 0.5 Fib at $89 — then exploded to $4,867
🟣 That’s +56,000% in just 1.5 years!
This cycle, the 0.5 Fib level sits around $661. With the monthly trendline breakdown, the big question is:
Will #Ethereum dip below $1,000 and test $700 before making a new ATH?
If ETH reaches sub-$1,000 zones, I'm personally buying heavy and holding for 1–2 years. No FA – just Fib, patience & conviction.
ETH will reward those who ride the wave, not fear the dip.
Hold strong. Next 1–2 years = massive opportunity.
Bitcoin Short played out perfectly and Down 7%Bitcoin Short played out perfectly.
Price respected the SMC chart structure — 4H candle failed to close above FVG + -OB zone.
Post Trump Tariff news, market triggered high-leverage stop hunts with a fake pump before a sharp dump.
📉 Entry: $88,440 ✅
📈 Exit: $82,200 ✅
✅ ~7% move captured. Trade closed in profit.

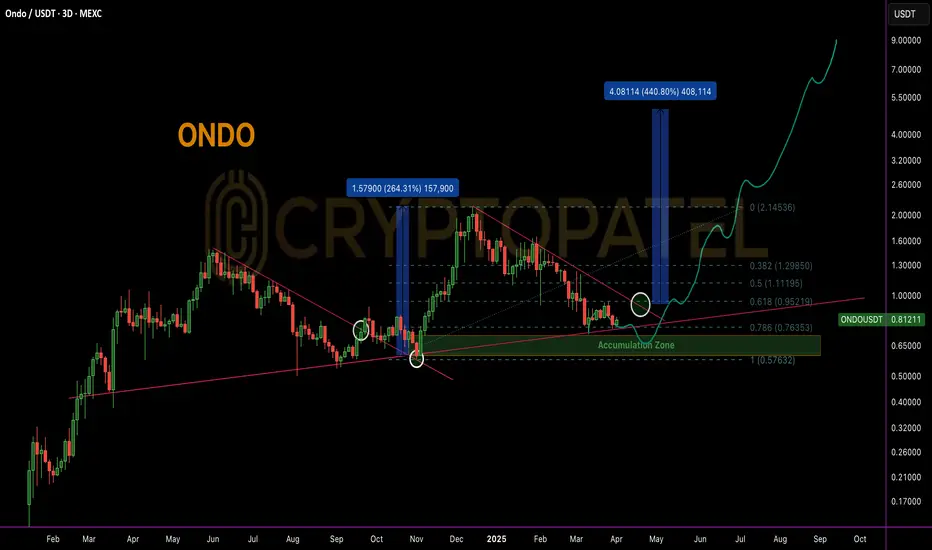
$ONDO Near Golden Entry Zone: Is $ONDO Ready for a 5x Move?LSE:ONDO Technical Analysis & Bull Market Outlook
LSE:ONDO is currently trading near a key accumulation zone, aligning with the 0.786 Fibonacci retracement level, which historically signals a high-probability bounce area in strong trending markets.
Accumulation Strategy
Ideal accumulation zone lies between $0.80 - $0.60. DCA (Dollar-Cost Averaging) approach recommended on major dips for optimal positioning before the breakout confirmation.
Historical Breakout Behavior
In the last HTF (High Time Frame) breakout, ONDO delivered a +200% move post-breakout. Based on current consolidation and market structure, a potential 400%-500% upside is anticipated if similar breakout structure plays out.
Upside Targets in Bull Case: $2/$5/$10
Why Still Bullish?
* Clean structure on daily and 4H TFs.
* Strong demand near 0.786 FIB.
* Institutional interest confirmed:
Trump’s World Liberty Finance acquired 342,002 LSE:ONDO , investing $505,218 at an average entry of ~$1.47 — current price is trading ~45% lower, indicating strong long-term conviction.
Not financial advice. Strictly TA-based view. Manage risk accordingly.
Nifty 50 potential structure It seems nifty 50 complete correction for upside . Now it's time to hold investment. It might break once more impulse to downside potential. Do your analysis. The idea is only I got.

BitcoinBitcoin rising from $85,189 to $88,000 today implies an anticipated increase of about 3.3%. Given the current market conditions and recent price movements, such a rise is within the realm of possibility, though it would require a reversal of the current downward trend.
It's important to note that Bitcoin's price has experienced significant fluctuations recently. Following President Donald Trump's announcement of a U.S. strategic crypto reserve, Bitcoin's value surged by over 11%, reaching a high of $95,136. However, it remains below its record high of $109,135 achieved in January 2025.

BTC#19: “Cryptocurrency Reserves” and trading plants💎 💎 💎 After Trump posted about his plan to put BTC into the national cryptocurrency reserve, BINANCE:BTCUSDT BINANCE:BTCUSD had a meteoric rise back to 93~95x. Let's plan to trade BTC: 💎 💎 💎
1️⃣ **Fundamental Analysis:**
📊 The current market is dominated by “US crypto assets”.
🚀 Trump: Will put BTC into the national reserve, this will help the crypto sector break out. However, it is also important to note that the US lacks budget support and crypto reserves are just empty words at present.
📌 The probability of the Fed keeping interest rates unchanged in March is 93%.
It can be seen that the current cash flow injected into the market is not really significant because interest rates have not yet decreased and the US tariff policy is still waiting to cause an economic war. Current news plays a role in restraining the downward momentum and fear in the recent past.
2️⃣ **Technical analysis:**
🔹 **Frame D**: it can be seen that the price is looking for an important resistance area. Note that the current price structure is decreasing, so the price can still turn around at any time when it touches the diagonal resistance zone.
🔹 **Frame H4**: It is clear that yesterday's increase has not yet had any technical recovery to be able to break through the current resistance zone.
🔹 **Frame H1**: Temporarily, the price is still in an upward trend influenced by yesterday's positive news. The previously broken trendline will act as an important support for the price to break out in the near future
3️⃣ **Trading plan:*
⛔ The current area is no longer ideal for establishing a trading position, if the price still has no recovery, we can consider looking for a SELL position when the price reaches the diagonal resistance area when a price structure appears on a smaller time frame. BUY should only be made if the price recovers and accumulates in the old resistance area and an increasing price structure appears on a smaller time frame.
✅ On the D and H4 time frames, the price structure is still bearish, besides, H1 has increased strongly without any technical recovery due to the influence of positive news. So we can completely wait for a trading opportunity when the price finds an important resistance and support zone.
💪 **Wishing you success in achieving profits!**

Trump's Tariffs and GoldSo it seems like gold is moving against my expectation for a pullback/consolidation (Black arrow path ) a correction before continuing its bullish trend.
The price broke through monthly R1(2871)in Today's bull run and now testing the weekly resistance R1 (2907), indicating a strong bullish sentiment in the market. If this momentum keeps up, we could see gold testing or even surpassing this resistance level, with a potential aim towards 2945.843(Monthly R2).
However, looking at the broader picture, there's a chance we might see some profit-taking(As price is at psychological level of 2900) or a market reaction to upcoming events like Fed Chair Powell's speech or the release of January's inflation data, which could lead to a temporary pullback to around 2850-70 area (Last week base) , where previous resistance might now act as support and at that zone we have to decide the next path.
Trump's tariff plan, especially the concept of reciprocal tariffs, adds another layer of uncertainty, potentially boosting gold further as everyone look for safety against trade war fears.
As expected in previous posts overall view remain bullish as per current price action and I am still holding my buy trade (from 2660 and Silver from 30.40) , yes in last week closing I was expecting a pullback and was waiting to add more near to 2800, Now we have to wait gold price action in this data packed week before making any decision.

Will TRUM coin hit ATH $77 again ?🚨 $TRUMP Coin crashed 79% from its $77 ATH in just 15 days! 🚨
It's now holding at $16, and I expect a bounce to at least $30 soon.
When do you think $TRUMP will hit $77 again?
