Breakout or Trap? Nifty & Bank Nifty Surge Ahead - Be Cautious!!Nifty and Bank Nifty are showing some strength!! We may see new ATH looking at the charts,
till the time Nifty does not clear 25300 we are in trouble waters!!
Above that level we should see a strong upside movement!!
All i can say is stay cautious till tht time, lets see a strong breakout rather then fall in a trap!!
Upside

City Union Bank - Cup and Handle Breakout CUB is breakout above 169 price after an year along with cup and handle pattern.
CUB also has good high volumes along with price action.
While achieving the target of this cup and handle it will also complete another rounding bottom. which will open doors for higher targets !!
Cup Height : 50 points
Breakout Zone : 168
Target : 222-256-275++

KAVAUSDT ON LAST SUPPORT STOPKAVA/USDT is currently trading on the last known order block. If the price bounces from here, we could see a huge upside potential. Given that the risk-to-reward ratio is at least 1:10, this seems to be a perfect opportunity to go long.

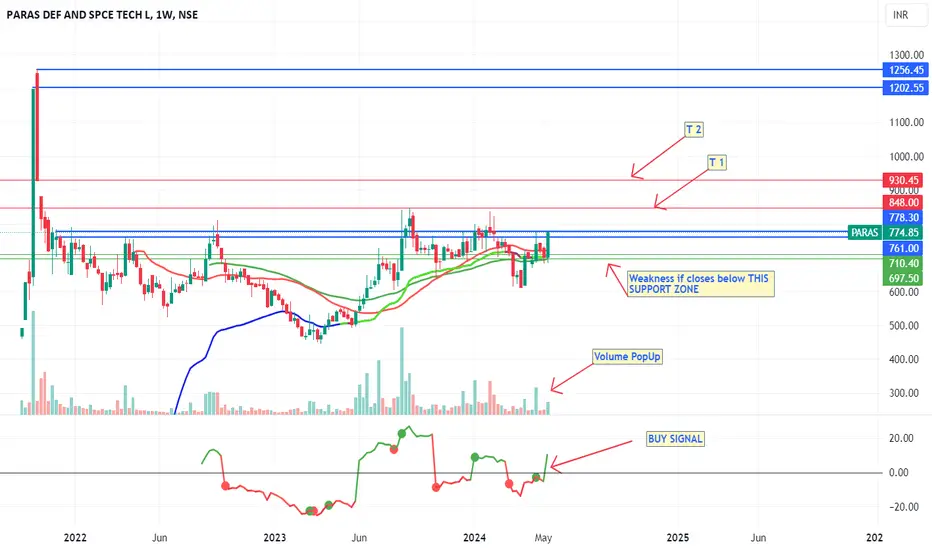
Paras Defence : Defence industry
#parasdefence
Moving out of longrange BO as well.
Parasdefence big potential for coming months.
Keep in Radar.
Disclaimer :consult your financial advisor.
#technicals #StocksToBuy #stocks #StockMarkets #investing #Index #Nifty #Breakout #BreakoutStock
#Defence
JAYNECOIND - Ready for the next swingJAYNECOIND - Has been trading in the channel for the last 6+ months, the stock has taken support at the bottom of the channel yet again and is showing clear signs of going for its next swing. I see an upside of up to 27%
I checked the fundamentals and they look decent.

DMart at strong supportDmart at oversold point with strong support at 3515. Can be a good accumulation point with a profit margin of 20% and 5% stoploss

Harsha Engineers againHarsha engineers again at strong support. Trading at very strong support and may show some good upside in short term

FinNifty about to give big bucksFInNifty looking bullish!
Expecting a big upside move before expiry this tuesday i.e. 20th of June.
Good volumes on monday will take it beyond 19600 hopefully.
Very hopeful here! Expecting support from all retailers' sentiment.
Fingers crossed

KOTAK MAHINDRA BANK ready to blastready with entry and stop loss
Good volumes may trigger further buying, all banks already bullish

HAPPSTMNDSHAPPSTMNDS:- The stock has broken its lower high lower low pattern and may have also broken the trendline and also given a breakout of the trendline. Keep an eye on the stock.
Hello traders,
As always, simple and neat charts so everyone can understand and not make it too complicated.
rest details mentioned in the chart.
will be posting more such ideas like this. Until that, like share and follow :)
check my other ideas to get to know about all the successful trades based on price action.
Thanks,
Ajay.
keep learning and keep earning.

bank nifty on 10 may 23 sideway marketHello ,
Bank Nifty 10 May 23 first seccion sideway & then after go upside.
bank nifty has Major Support 43037 & Resistance 43305 if any break then go for it.

KEI Industries LimitedKEI:- If the stock sustains the upside, then we may see an upside movement.
Hello traders,
As always, simple and neat charts so everyone can understand and not make it too complicated.
rest details mentioned in the chart.
will be posting more such ideas like this. Until that, like share and follow :)
check my other ideas to get to know about all the successful trades based on price action.
Thanks,
Ajay.
keep learning and keep earning.

Pidilite - Pattern (Bullish)Pidilite can give short term long opportunity with upto 9% upside move.
Very interesting to see how market behaves.
The above view is just for educational purposes, It's not buying or selling recommendation.

BANKNIFTY TOMORROW PREDICTION...#banknifty is consolidation so wait for breakout market is still holding their level may be the market making some exhaustion for big
move... If the market break upside so first target =42379,42455,42512,42645. if the market break downside first target = 41971,41876,41803,41696.

GO LONG ON APPLE "NASDAQ:AAPL"]NASDAQ:AAPL
There is great support zone in apple
Also R SI is at 20 which act as support
On a daily time frame there is demand zone from july 2021
This is for educational purpose

FCPO | End of downsideFCPO has been on the downside for an extended period, corrected huge.
now we are looking for upside movement.
as one can see RSI is also supportive, it may turn upside anytime soon.

Upside 10 %
Good Day ,
Hello Traders,
Ease My Trip is showing some strength as the triangle is getting squeezed n weekly basis , can give 10 % Upside. With 376 as strict Stop Loss on can enter and aim for the target of 430 and 440
Chart Self explanatory
Time Frame : Weekly
Disclaimer : I am not SEBI registered analyst, this is for educational purposes.
Please trade as per your risk and do consult with your financial advisor before taking any
trading decisions..
If you really like the analysis , please do comments, LIKE and Follow me.

BTCUSDT - Chart Upside Breakout | Consolidating BTCUSDT - Binance Chart
Upside Breakout
Price is Consolidating and the Volume is Rising.

Analysis on 29-07-2022This is the Anaylsis for the trade on 29-07-2022 So Just Try to To Place Accordingly As per our Anaylsis

Amar Raja Battries bullish divergence.self explanatory.bullish divergence seen on chart. trend reversal can be seen.

INDIAMARTdiscount % get buy this stock at one or more for huge return . my prediction is stock move to our ATH .....
IF YOU LIKE MY IDEA …PLEASE .FOLLOW ME
Disclosure : I am not SEBI registered. The information provided here is for Education Purposes only. Consult your financial advisor before taking any decisions

Info Edge is again coming in buy range?As you can see, stock made strong base and is facing resistance.
Therefore, you can buy in range of Rs 4400-4420. Once it goes below support area then immediately sell otherwise keep with you and wait for the good upside.

SILVERSilver Looks good for upside
silver face resistance at 64400, after break resistance we enter,
its my view only
