SPX SP500 Trade Idea Setup - SPX looks over extended to me
- All US Indices look over extended to me but you can't short it anyways
- The whole playout here is based on catching retracements and not shorting anything
- IMO trade less unless you find an A+ setup
Us500

US500 SELL SELL SELL!!!!bearish divergence followed by a break and retest of downward structure. entry was at retest and i will be riding this down to the previous structure level at 4482 area.

US500 BUY BUY BUY!!!Anticipating a buy after the retest of this zone. I will be taking tp at the zone marked but I expect price to push higher to form a new ATH because from the daily, price hit a strong support and resistance level and then bounced off of starting this new uptrend. I will link the daily chart below.
NB: this is not financial advice. please always do your own analysis.


US 500 Weekly. #KissBulls have a tough Friday to reclaim their dominance. Or the domino will come tumbling down.


INTC Triple Top formation Weekly looks bearish and on lower time frames we can see a clear triple top formation
its a good opportunity for a short after resistance breakout
MACD & RSI showing a big divergence on the tops making lower highs instead

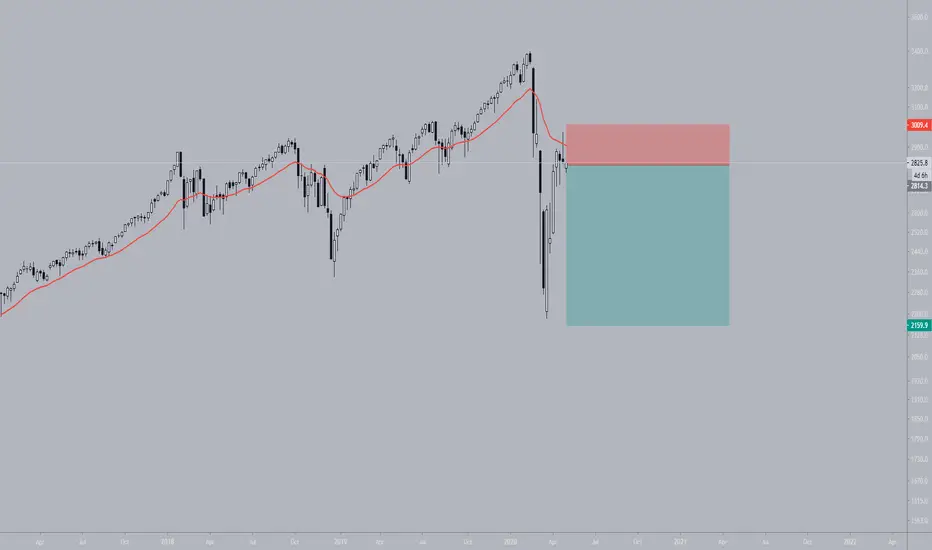
Markets at an edgeBoth SP500 and NIFTY have displayed a similar pattern in the past 1 year and now both are at the edge of the previous tops. combine this with the fact that VIX is at near lows, we are all set for potential volatility in the weeks ahead.

Short the upper end of the range?Because my trading can not catch up, please allow me to write it briefly.
<< tactics >>
When judging that 2800.0 functioned as a resistance line, I will short.
The first limit is on MPP (R1)
The second limit is on WePP (S2)
I would be grateful if you like it idea,give me follow or agrees!
------------------------- --------------------------
Brown thick line: Yearly Pivot Points (YPP in the text)
Light blue thick line: Monthly Pivot Points (MPP in the text)
Green thin line: Weekly Pivot Points (WePP in the text)
Indigo thick line: Horizontal line or Trend line seen by weekly or monthly
Indigo thin line: Horizontal line or Trend line seen by 4hourly or daily
Indigo dotted line: outstanding round number.
Red thick line: Untrustworthy line for me
Red curve: EMA 20 close
Indigo curve: EMA 200 close
Green curve: EMA 800 close
Black curve: EMA 1600 close
x mark: Line which may not function
------------------------- --------------------------

Has the uptrend ended?It was a story of five months ago when I made a move towards 2900.0.
Currently, it can be seen from the daily story that 2800.0 acts as a strong resistance, preventing up trend persistence.
Daily
I assume that this symbol is not considered an uptrend already.
However, most recently it is likely to consider trading using a support line from Double Zero 2700.0.
<>
1) Double Zero Judged that 2700.0 functioned as a resistance line.
long entry.
The first limit is under thin horizontal line 2738.6.
The second limit is under WePP (P) 2756.0.
2) It can not be determined that double zero 2700.0 functions as a resistance line.
There is MPP (P) 2678.0 under Double Zero 2700.0, so I do not think of a short. I will observe.
Finally, WePP and MPP will be updated on Monday as weekend and monthend are approaching.
Flexible response is required.
It is a good choice not to enter if you feel difficult.
I would be grateful if you like it idea,give me follow or agrees!
------------------------- --------------------------
Brown thick line: Yearly Pivot Points (YPP in the text)
Light blue thick line: Monthly Pivot Points (MPP in the text)
Green thin line: Weekly Pivot Points (WePP in the text)
Indigo thickLine: Horizontal line or Trend line seen by weekly or monthly
Indigo thin line: Horizontal line or Trend line seen by 4hourly or daily
Indigo dotted line: outstanding double zero
Red curve: EMA 20 close
Indigo curve: EMA 200 close
Green curve: EMA 800 close
Black curve: EMA 1600 close
x mark: Line which may not function
------------------------- --------------------------
