24 May 2019 Long EUR/USD24 May 2019 Long EUR/USD @1.11896
StopLoss 20 Pips @1.11696
TakeProfit 20 Pips @1.12096
USDINR

23 May 2019 Short EUR/USD 23 May 2019 Short EUR/USD @1.11422
StopLoss 20 Pips @1.11622
TakeProfit 20 Pips @1.11222

22 May 2019 Long EUR/USD22 May 2019 Long EUR/USD @1.11608
StopLoss 20 Pips @1.11408
TakeProfit 20 Pips @1.11808


USDINR : Is it start of another down leg?USDINR is consolidating in downward moving channel which is clearly seen on chart. Death cross (50 DEMA below 200 DEMA) point was crossed by pair but didn't sustain above it. Market will look for pair to close below 69.10 for start of downward move towards bottom of channel. Trader should hold short till the time pair is trading in channel or death cross doesn't turn into golden cross. +DI is trading at 25 and -DI is at 29 which means bears are trying to grip over the market.
As far 70.60-70.80 is not crossed sentiment for pair will be bearish. Above 70.80, pair will look for 73-75 range. We'll wait for pair to break range of 69.10 -70.60.

17 May 2019 Long EUR/USD17 May 2019 Long EUR/USD @1.1176
StopLoss 20 Pips @1.1156
TakeProfit 20 Pips @1.1196


16 May 2019 Long EUR/USD 16 May 2019 Long EUR/USD @1.12092
StopLoss 20 Pips @1.11892
TakeProfit 20 Pips @1.12292

15 May 2019 Short EUR/USD15 May 2019 Short EUR/USD @1.12084
StopLoss 20 Pips @1.12284
TakeProfit 20 Pips @1.11884

14 May 2019 Long EUR/USD14 May 2019 Long EUR/USD @1.12369
StopLoss 20 Pips @1.12169
TakeProfit 20 Pips @1.12569

14 May 2019 Long EUR/USD14 May 2019 Long EUR/USD @1.12369
StopLoss 20 Pips @1.12169
TakeProfit 20 Pips @1.12569

USDINR : BuyUSDINR is looking positive on daily chart. 5 DEMA has crossed 13 DEMA to upside. RSI is also in control and moving upward. It is trading in parallel channel. Resistance of parallel channel is placed somewhere near the 70.50-70.60. It is well supported by 38.2% retracement level of entire fall from from 74.52 to 68.30 which is 70.68. It is expected to move upward towards 70.50-70.60 as long as holds 69.50 on closing basis.

13 May 2019 Long EUR/USD13 May 2019 Long EUR/USD @1.12293
StopLoss 20 Pips @1.12093
TakeProfit 20 Pips @1.12493

USDINR1) Oil price and depreciating yuan should weaken other EM currency
2) Cup and handle and trendline B/o
3) Target 72

USDINR day chart studyUSDINR on day chart broke the 200 day SMA and the big broadening wedge bottom in early march 2019.
Currently it has formed a small broadening wedge.
Avoid all the opportunities to go long (as long as it trades below 200 day SMA) and look for trading opportunities only on the selling side.
I will be waiting to go short after the small broadening wedge breakdown.

20 May 2019 Short EUR/USD20 May 2019 Short EUR/USD @1.12210
StopLoss 20 Pips @1.12410
TakeProfit 20 Pips @1.12010

USDINR Corrective UpmoveOANDA:USDINR USDINR seems to be in a complex correction. After the recent running flat, it looks like its going to the upside for a C wave. For the short term, its likely to retest the previous highs and slightly beyond till about 71- 71.5 levels.

07 May 2019 Long EUR/USD07 May 2019 Long EUR/USD @1.12149
StopLos 20 Pips @1.11949
TakeProfit 20 Pips @1.12349

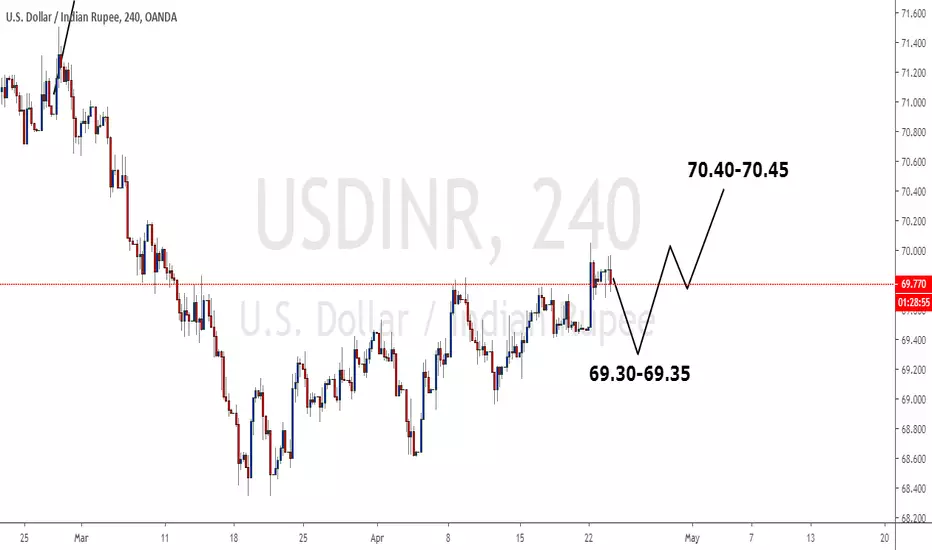
USDINR - Short term directionThe currency pair is moving in corrective structures and is expected to extend the fall towards 69.30-69.35 range and then moving higher towards 70.40-70.45 in next one to two weeks.
USDINR - Directional move expected in next few daysUSDINR is expected to approach higher towards 71.3-71.4 by staying above 69.2 in next couple of weeks.

06 May 2019 Long EUR/USD 06 May 2019 Long EUR/USD @1.11912
StopLoss 20 Pips @1.11712
TakeProfit 20 Pips @1.12112

04 May 2019 Short EUR/USD04 May 2019 Short EUR/USD @1.12010
StopLoss 20 Pips @1.12210
TakeProfit 20 Pips @1.11810

USDINR at nice price to dig in aslso risk to reward ratio huge.USDINR at nice price to dig in aslso risk to reward ratio huge.
