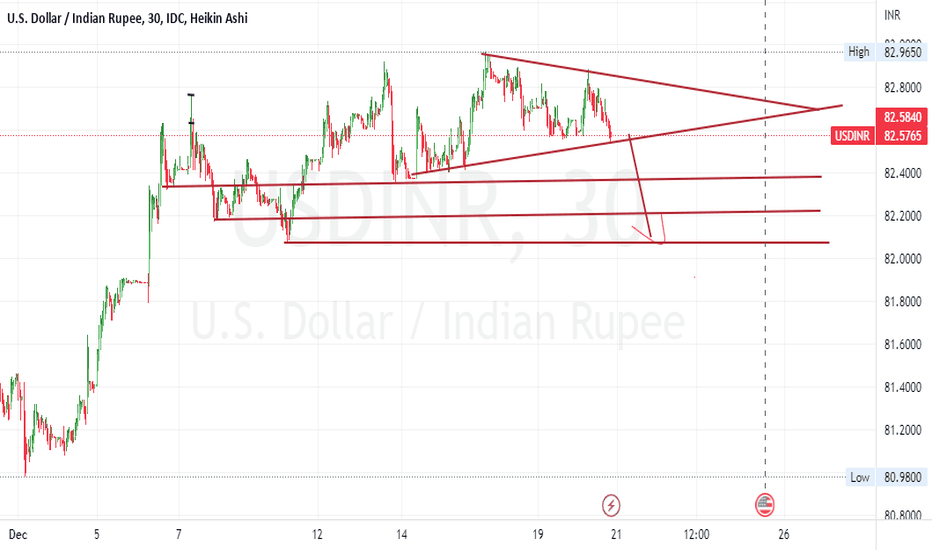
USDINR
USDINR1st BUY 82.02 (30% of your capital)
2nd BUY 81.73 (30% of your capital)
3rd BUY 81.43 (30% of your capital)
A margin call of 10% must be maintained.
Note: Only buying (long FUT or Monthly CALL) is recommended here; no shorting or bearish trend is recommended; almost all events are happened so strong naturals (above > 82.39); do not buy weekly CALL options and OTM CALL options; only ITM or ATM monthly options are recommended.
USDINRPlease keep in mind that this is only for futures and positional traders.
You can buy USDINR in 3 different buy zones, as mentioned (Buy zone 1, Buy zone 2, Buy zone 3).
There is NO-STOPLOSS; simply purchase as much as you can. Don't panic if it reaches Zone 3; instead, buy as much as possible.
It is important to note that this view is for the next three months and is not recommended for short-term time frames.
Note 1: Do not trade CALL options based on this view because it is a long-term view and you may lose money buying OTM or ITM due to theta decay in the long run.
Note 2 : Because the USDINR is oversold, strong Bullishness is expected to continue, and only buying is recommended (avoid short selling or buying PUT options) at retracement levels.
USDINR multi time frame aligned Elliott wave counts analysisUSDINR possible and aligned Elliott wave structure of multi time frames from monthly to hourly.
Monthly chart
Weekly chart
Daily chart
4 Hourly chart
1 Hourly chart
Most investors treat trading as a hobby because they have a full-time job doing something else.
However, If you treat trading like a business, it will pay you like a business.
If you treat like a hobby, hobbies don't pay, they cost you...!
Disclaimer.
I am not sebi registered analyst.
My studies are for educational purpose only.
Please Consult your financial advisor before trading or investing.
I am not responsible for any kinds of your profits and your losses.
USDINR Analysis as per Elliott Wave TheoryUSD-INR after such a steep rise looks like it is in the 5th wave of bigger degree .
Within this bigger 5th wave, which should ideally be the last wave of a Major Rise, normally consists of 5 sub waves in smaller degree .
Now, Market is looking in 3rd wave of sub degree of bigger 5th wave that I was talking about in the previous two lines.
USDINR: Bearish Divergence in hourly chartIn FX_IDC:USDINR here are the features we can see:
There is a clear bullishness throughout the session. I would say Very Bullish. All candles are hollow and green in hourly charts.
There is a bearish divergence in the #USDINR hour chart. Price highs are not sustained by RSI new highs - shown in the photo
Most likely: the uptrend will pause as there is a momentum missing.
So Dec Future is a short candidate for USDINR.
Find a perfect Trend Line With this check listThere are many traders out there who trade trend lines. Mastering trend lines is not easy as it seems, with experience things changes with your perception about Trend Lines. What I learned from my experience is that it is important to find a trend line, but it is more important to filter it so that, we can trade only the potential opportunities. Here I do not say that those trades which we filter out will not work or we efficiently filter out those less profitable trades, because adding a filter in your system not only filter trades which are unprofitable but also filter out profitable trades.
You have to accept that you are leaving better for best.
So, what are the check points I follow to filter out Trend Lines,
1) Touches, I prefer more than three touches and I strictly follow it. See what happens with two touch the number of trades increases too much; I am not saying trend line with two touches does not work but that trend line cannot be of higher profit potential than 3 or four touches.
2) Distance between touches, it is stated that if touches have equal distance between them the trend line is considered as a good Trend Line, but i do not strictly apply if the touches are places at enough spacing and the distance between then approximately equal that it is a good Trend Line. I do check distances but not strict on it.
3) Apply your own logic, this is a very subjective thing, person to person it will vary. Every trader looks the same setup differently, setups will only work when his psychology matches with those setups otherwise it will not work. Build your own logic.
At last, I want to end this post by a quote I have in my mind.
"True Knowledge cannot be taught, it can only be caught."
USDINR case studyUSD INR 80.88
ELLIOT WAVE STUDY
Time frame :- Daily
Completion :- corrective wave 4
Unfold :- impulse wave 5
RSI :- Hidden bearish divergence with respect to price
Counter is on verge to mature its corrective wave 4 ,which as per ascending parallel channel have demand zone around 80.45 to 80.00 levels
once corrective wave 4 is completed , impulse wave 5 might unfold which might lead to levels of 81.9---82.9--83.9
view remains valid till counter manage to sustain above 79.6 on closing basis.
Time for bulls to take charge.


