US Dollar Index (DXY)1. What is the US Dollar Index (DXY)?
The US Dollar Index (DXY) is a financial index that measures the strength or weakness of the US dollar (USD) relative to a basket of major global currencies.
It represents how the US dollar is performing in the international foreign exchange (forex) market.
The index helps traders, investors, policymakers, and economists track global confidence in the US dollar.
2. Origin and History of DXY
The US Dollar Index was introduced in 1973 by the Federal Reserve.
Its creation followed the collapse of the Bretton Woods system, when currencies moved from fixed exchange rates to floating rates.
Later, responsibility for the index shifted to ICE (Intercontinental Exchange), which now maintains and publishes it.
3. Base Value of the Index
The base value of DXY is 100.
A reading above 100 means the US dollar has strengthened compared to the base year.
A reading below 100 means the US dollar has weakened.
4. Currency Basket Composition
The DXY is calculated against six major currencies, each with a specific weight:
Euro (EUR) – ~57.6%
Japanese Yen (JPY) – ~13.6%
British Pound (GBP) – ~11.9%
Canadian Dollar (CAD) – ~9.1%
Swedish Krona (SEK) – ~4.2%
Swiss Franc (CHF) – ~3.6%
The Euro has the largest influence, meaning EUR/USD movements heavily impact DXY.
5. How DXY is Calculated
DXY is calculated using a geometric weighted average of the six currencies.
It uses exchange rates between the US dollar and each currency.
The formula gives more weight to currencies with larger trade relationships with the US.
6. What Does a Rising DXY Indicate?
A rising DXY indicates:
Strengthening US dollar
Increased global demand for USD
Capital flowing into US assets
Often reflects:
Higher US interest rates
Strong US economic data
Global risk aversion (safe-haven demand)
7. What Does a Falling DXY Indicate?
A falling DXY indicates:
Weakening US dollar
Reduced demand for USD
Capital moving out of US assets
Often reflects:
Lower interest rates
Expansive monetary policy
Improved global risk sentiment
8. Relationship Between DXY and Interest Rates
DXY is strongly influenced by US interest rates, especially Federal Reserve policy.
Higher interest rates:
Attract foreign investment
Strengthen USD
Push DXY upward
Lower interest rates:
Reduce yield advantage
Weaken USD
Push DXY downward
9. Role of the Federal Reserve
The Federal Reserve (Fed) plays a critical role in DXY movement.
Key Fed tools affecting DXY:
Interest rate decisions
Quantitative easing (QE)
Quantitative tightening (QT)
Forward guidance
Hawkish Fed → Stronger DXY
Dovish Fed → Weaker DXY
10. DXY as a Global Risk Indicator
DXY often behaves as a safe-haven indicator.
During global crises:
Investors rush to USD
DXY rises sharply
During risk-on environments:
Investors seek higher returns elsewhere
DXY weakens
11. Impact of DXY on Commodities
Most global commodities are priced in USD.
Relationship:
Strong DXY → Commodities become expensive → Prices fall
Weak DXY → Commodities cheaper → Prices rise
Strong inverse correlation with:
Gold
Silver
Crude oil
12. Relationship Between DXY and Gold
Gold and DXY usually move in opposite directions.
When DXY rises:
Gold becomes expensive in other currencies
Demand falls
When DXY falls:
Gold demand rises as hedge against USD weakness
13. Impact of DXY on Equity Markets
Strong DXY:
Hurts US exporters
Can pressure emerging market equities
Weak DXY:
Benefits multinational companies
Supports global equity markets
14. DXY and Emerging Markets
Emerging markets often have USD-denominated debt.
Strong DXY:
Debt servicing becomes expensive
Capital outflows from EMs
Weak DXY:
Eases financial pressure
Encourages capital inflows
15. DXY and Indian Markets
DXY has a major influence on:
INR exchange rate
FII flows
Crude oil prices
Rising DXY:
Rupee depreciation
FII selling pressure
Falling DXY:
Rupee appreciation
Improved liquidity for Indian equities
16. DXY in Forex Trading
DXY is widely used by forex traders as a directional bias tool.
If DXY is bullish:
USD pairs like USD/JPY, USD/INR tend to rise
If DXY is bearish:
Pairs like EUR/USD, GBP/USD tend to rise
17. DXY Technical Analysis
Traders analyze DXY using:
Support and resistance levels
Trendlines
Moving averages
RSI and MACD
Breakouts in DXY often lead to strong trends across global markets.
18. DXY Futures and Trading Instruments
DXY can be traded via:
Futures contracts (ICE Exchange)
ETFs like UUP
CFDs
Used for:
Hedging currency exposure
Speculative trading
19. Limitations of the DXY
Currency basket is Euro-heavy
Does not include:
Chinese Yuan
Indian Rupee
May not fully reflect modern global trade dynamics
20. DXY vs Broad Dollar Index
Broad Dollar Index includes currencies of:
China
Mexico
South Korea
DXY is narrower but more widely followed in markets
21. Long-Term Trends in DXY
DXY tends to move in long cycles:
Multi-year bull and bear phases
Driven by:
Interest rate cycles
Economic leadership
Global capital flows
22. Why DXY is Important for Traders and Investors
Acts as a global macro compass
Helps anticipate:
Commodity trends
Equity market movements
Currency volatility
Essential for:
Forex traders
Commodity traders
Equity investors
23. Summary
DXY is a powerful indicator of US dollar strength
Influences almost every global asset class
Reflects macroeconomic, monetary, and geopolitical trends
Understanding DXY helps investors make better cross-market decisions
DJ FXCM Index

A New World without the US Dollar at the helm?Civilizations halt.
Empires fall.
New worlds and new world orders are built on the ruins of older greats.
Is this the slow decline of the largest empire known to mankind?
Whatever happens, I wish it happens over the next 50 years so I can be here to witness the shift in awe.
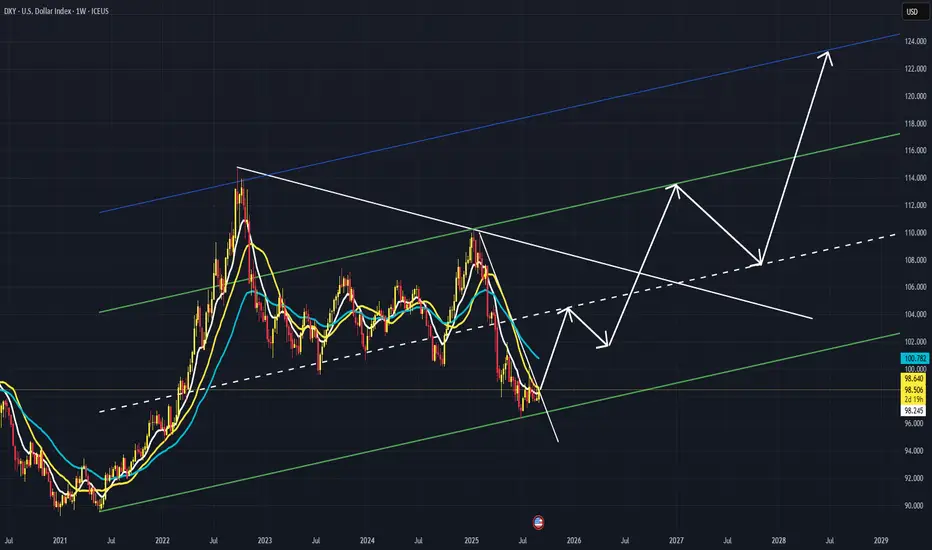
Technically speaking, US Dollar has been in a long term uptrend channel since 2008 and this channel is now seriously being tested and is at a risk of being violated. What is interesting is this isn't just a technical move, this is a move backed by a fundamental shift in Global order.
How will the world look like if US is not at the helm? Only time will tell.
see you later—ciao!

Btc Blood BathI think these are the crucial level as supply is increasing day by day and demand are not making highs so there should be opportunity to get lower levels as per my analysis plz don't trade on my analysis 🙏

XAUSUD (Gold) | Technical Outlook | Last Day of Analysis 2025Gold is showing short-term weakness despite a bullish higher-timeframe trend (weekly/monthly). Current price action is driven by profit booking and momentum selling, with volatility keeping key levels in focus. As long as gold trades below 4,350, the intraday bias remains bearish, with downside levels at 4,327 → 4,305 (key) → 4,282, and a break below 4,305 opening room toward 4,275. Rallies below resistance are likely to be sold. A bullish reversal is only valid on a strong break and hold above 4,370, followed by acceptance above 4,395, which can open upside toward 4,416–4,450. For today, selling near resistance offers higher probability, while long positions should be considered only on confirmed breakout strength.

U.S Doller Index ( DXY ) - EW Analysis Doller Index weekly analysis forming leading diagonal pattern completed now in correction phase and C wave (impulse) target possible at $ 87.5

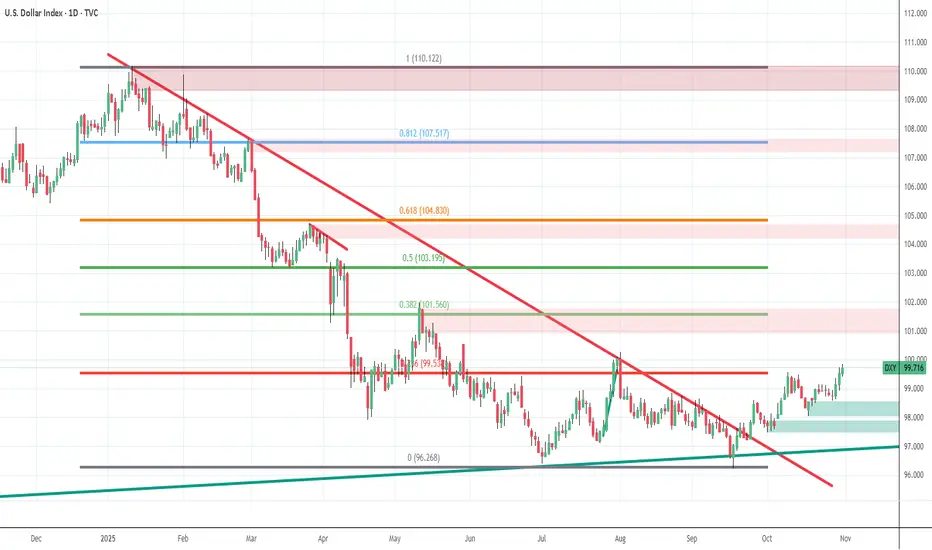
DXY Breakdown After Major Top – Wave v in ProgressThe DXY chart shows that the U.S. Dollar has completed a larger corrective structure and is now moving inside a new impulsive bearish phase. After forming a major top near the 110 area, the index started a clear five-wave decline, indicating strong downside momentum. The recent sideways movement looks like a corrective pause (wave iv / Y) rather than a trend reversal. As long as the price stays below the key resistance zone around 100–101, the overall structure remains bearish. This suggests the dollar is preparing for the final wave lower (wave v / 3), which could push the index toward deeper support levels. Overall, the Elliott Wave structure favours continued weakness in the U.S. Dollar in the coming months.
Stay tuned!
@Money_Dictators
Thank you :)

USDCAD - Breakout Will Flip the Trend BullishUSDCAD has been sliding inside a well-defined descending channel, completing a full five-wave drop toward the support zone. The structure from the top looks corrective rather than impulsive. That means the downtrend is weakening as it reaches its final leg.
Your count shows Wave 3 finishing at the dashed red line zone, followed by a small Wave 4 bounce, and now the market is pushing into the last Wave 5. This final drop is expected to target the Fibonacci levels near 1.3915 and 1.3895 . Nothing suggests strength until those levels are tested.
The price is still trapped inside the downward channel, and every bounce has been getting sold. That confirms sellers are still in control for now. Wave (C) is close to completion, but buyers haven’t proven anything yet.
The bullish outlook only becomes valid after a clean breakout above the channel. Without that break, any upside move is just noise inside a bearish structure. The breakout must hold with a higher low to confirm a trend reversal.
If the channel breaks decisively, a strong bullish reversal toward 1.40+ becomes possible. The entire structure suggests the downtrend is aging, so a major upside swing is likely once sellers exhaust. Until then, downside targets remain open and caution is necessary.
Stay Tuned!
@Money_Dictators

$ Index - view and analysis$ Indec has clearly taken monthly month trend line support and slowly moving up.
Its could be just technical move and i am not aware of any reason for US dollar and this index to move up. Only solution for US Govt to stop shut down is only lifting limit and print more fiat currency. After the news flow mostly it will coincide with fib level and US will announce printing of more fiat currency. I still think its long time bearish view only and short term could be bullish till it reaches the point to fall down again.
AUDUSD BREAKS CHANNEL RESISTANCE - TREND SHIFT AHEAD?Symbol - AUDUSD
AUDUSD is undergoing a corrective phase after breaking above the resistance of the descending channel. The market now requires consolidation or the formation of a trading range above 0.6525 to sustain bullish momentum.
The US dollar remains in a consolidation phase and shows limited potential for further appreciation. Mounting pressure ahead of the upcoming Federal Reserve meeting may act as a supportive factor for the Australian dollar.
The pair is transitioning into a distribution phase following a period of consolidation. The breakout above 0.6525 confirmed a breach of the descending channel’s resistance, signaling the early stages of a potential trend reversal. Sustained price action above this level could pave the way for continued upside movement.
Resistance levels: 0.6567, 0.6610
Support levels: 0.6525, 0.6493
Currently, the pair is attempting to establish a shift in trend direction. The ongoing consolidation and distribution above the previously broken trendline are constructive signs. However, the formation of a defined trading range will be essential to confirm the establishment of a new local uptrend.

Euro Under Pressure from Strong USDThe euro continues to show weakness against the dollar as global risk sentiment cools and investors shift toward safer assets. Market participants remain cautious ahead of key inflation data from the Eurozone and upcoming comments from Federal Reserve officials, which could clarify the next phase of U.S. monetary policy.
The recent euro recovery attempts have met consistent supply, reflecting pressure from subdued European growth and stronger U.S. economic resilience. The dollar remains supported by robust labor market conditions and persistent inflation expectations, which sustain demand for U.S. yields and Treasury assets.
Liquidity patterns suggest that institutions are still offloading positions near recent highs, keeping EUR/USD confined within a broader corrective cycle. Energy price fluctuations and diverging rate expectations between the ECB and the Fed continue to weigh on sentiment.
Overall, the pair remains under macroeconomic strain, with capital flows favoring the dollar as global markets seek stability am

Now the Buyer's trap on XAUUSD/Gold 16/10/25Last video, it was quite evident about the seller trap, and it gave a good 60USD run.
Now comes the example of a buyer's trap.
Technically, DXY is also set for a bullish run, hence prices are expected to pull back in GOLD/XAUUSD now.
The strategy for both sides of the trading plan is shared in the video.

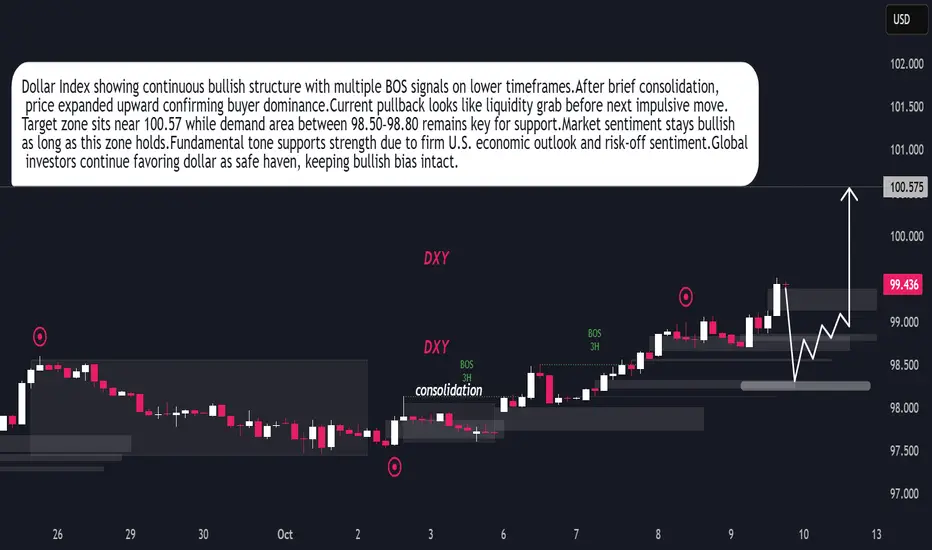
DXY Ready for Next Bullish Leg After Liquidity SweepDollar Index maintaining bullish structure after recent BOS on 3H timeframe.Market formed consolidation phase early October before expansion.Buyers showing control pushing price towards 100.57 objective.Current retracement indicates liquidity grab before next bullish impulse.Demand zone 98.50–98.80 remains key area for continuation.Technical sentiment stays positive as long as price holds above 98.50.Fundamentally, dollar supported by strong U.S. data and cautious global tone favoring safe-haven demand.Momentum outlook remains bullish with potential continuation toward 100.50+ zone.
EURUSD – Head and Shoulders Breakdown in Play!!The chart is showing a clear Head and Shoulders formation, a bearish reversal structure that signals the market may be preparing for a deeper drop if neckline support gives way.
Chart validation:
Left Shoulder, Head, and Right Shoulder are well-defined.
The neckline sits around 1.1646 – this is the critical level to watch.
Current price is hovering above the neckline, but pressure is building on the downside.
Invalidation sits above 1.1850 – if price pushes past this level, the bearish setup is negated.
Targets from the structure:
A clean break below 1.1646 confirms the pattern.
Measured move points towards 1.1430 area as the downside objective.
Along the way, short-term jolts could test 1.1550, but the major momentum favors sellers if neckline breaks.
Trading view:
As long as EURUSD stays below the right shoulder resistance and 1.1850, bias leans bearish. The neckline is the trigger – once broken, the head and shoulders formation comes into full effect, opening space for a sharper correction.Trade safe !!

GOLD Bullish continuation (new highs, momentum sustain) :
Probability: around 60–65%
The breakout has strong support from macro conditions. Real yields look like they are peaking, inflation expectations remain sticky, and the Fed is leaning toward easing. On top of that, the US dollar is softening and central banks are continuing to add gold to reserves. These combined factors increase the odds that the breakout holds and the trend continues higher.
Sideways consolidation or retest of breakout :
Probability: about 25–30%
A pullback or cnsolidation wouldn’t be surprising, especially if the Fed sounds less dovish or if inflation data cools faster than expected. In that case, gold could spend some time chopping between support and resistance before deciding its next big move.
Major correction or deep mean reversion :
A deep selloff looks like the least likely path right now. Real yields aren’t rising sharply, inflation isn’t collapsing, and the dollar is still under pressure. But nothing is guaranteed. A surprise hawkish turn from the Fed or a sudden global disinflation shock could knock gold back toward old structural levels.but this remains the least likely scenario in the near to medium term.

Can DXY make it to 125?Interesting thought as geopolitical forces gather and discuss the fate of USA ... Can DXY make it to 125 in a 5 wave rise in next 3 years or so?
DXYAs you can see, this is the US Dollar Index (DXY) on the 15-minute chart. Coming down from the higher timeframes, the macro bias on DXY remains bearish. While fundamentals will, of course, play a key role, technically speaking, after a strong move to the upside, it's natural for price to retrace lower—whether as a correction before continuing higher or potentially beginning a deeper move down.
📉 What I'm Watching:
If price reacts from the current zone and starts dropping, this could serve as extra confirmation for potential XXX/USD buys.
If that setup doesn't play out here, I'm still expecting a similar scenario—just slightly higher, possibly from within the daily supply zone.
Either way, I'm remaining patient and letting price show its hand.
Have a great week ahead!
Blessings! 🙏

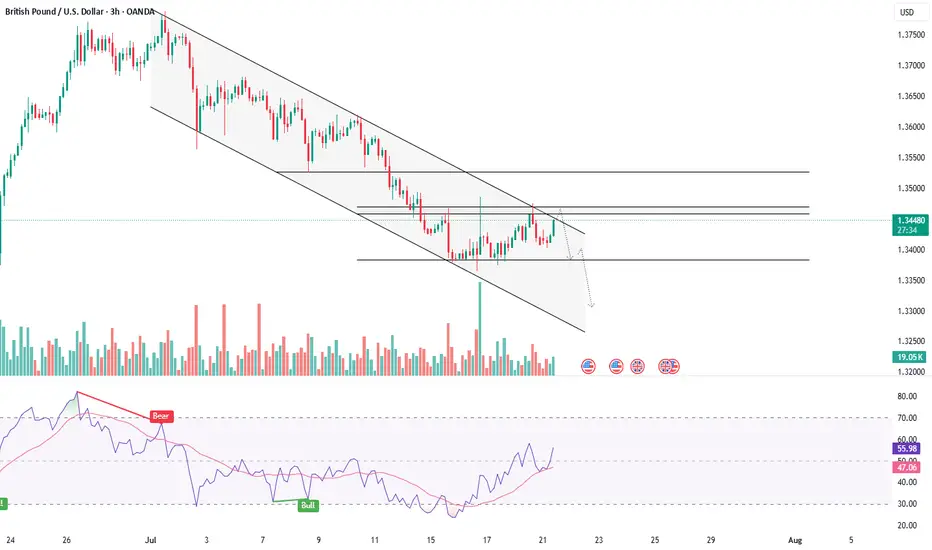
GBPUSD - NEAR RESISTANCE, BEARISH CONTINUATION IN SIGHTSymbol - GBPUSD
CMP - 1.3460
The GBPUSD currency pair is currently undergoing a countertrend correction, aligning with a broader retracement in the US dollar. This movement presents an opportunity for the pair to test the prevailing trend resistance and consolidate within a key liquidity zone. Market participants should closely monitor the immediate resistance level at 1.3467, which coincides with a significant concentration of liquidity pool relative to the local trend structure.
Given the prevailing bearish market sentiment, a confirmed breakout above the 1.3467 resistance level could serve as a potential catalyst for a reversal or short-term pullback, reflecting a reassertion of the dominant downtrend.
Key Resistance Levels: 1.3467
Key Support Levels: 1.3370
Should the pair fail to sustain upward momentum during a retest of the aforementioned liquidity zone, and if the price subsequently falls back below 1.3467, it could signal a renewed opportunity to engage in short positions aligned with the broader trend direction.
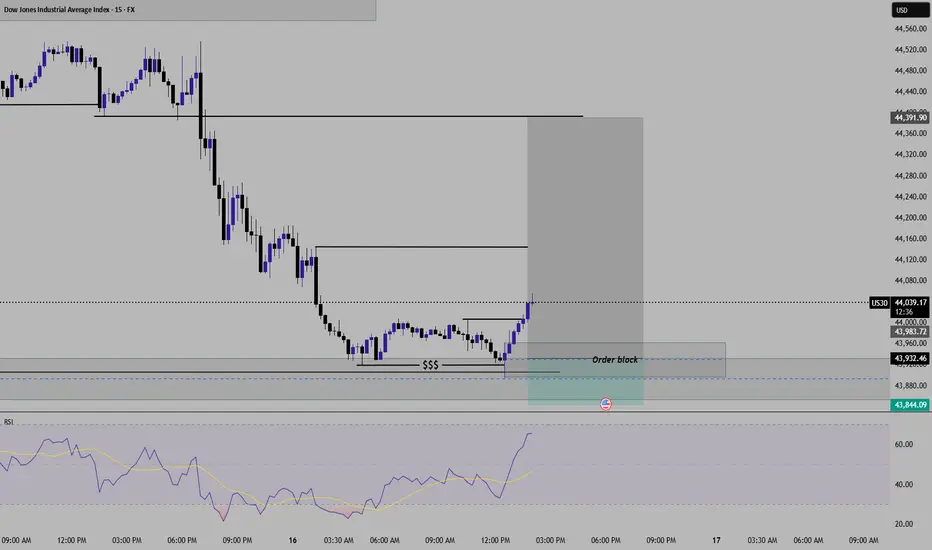
US30 Analysis for smaller time frameUS30 Buy setup With HTF Liquidity Grab Confirmation and lower time frame Entry module.
Buy @ 43925
Stop loss @43845
1st Target - @44140
2nd Target - 44390
(This publication is only for education purpose. consult your financial advisor before any investment)
USDCAD - IS A BULLISH TREND REVERSAL BREWING?Symbol - USDCAD
USDCAD is staging a recovery supported by the recent strength in the US dollar. A potential return to the prior demand zone could reinforce the bullish case for the pair and present an opportunity to establish long positions.
Amid the backdrop of dollar strength, the market appears to be transitioning into a new phase. The pair has ceased making lower lows and is now forming an EQL structure, from which it is attempting to break out of the prevailing downtrend. While the initial liquidity retest may lead to a brief correction, a swift rebound and sustained consolidation above this level would confirm the emergence of a bullish market structure.
Resistance levels: 1.3700, 1.3730
Support levels: 1.3660, 1.3648
Despite the recent breakout above descending resistance, selling pressure remains evident, with sellers likely to re-enter near the 1.3686 level. A clear breakout above this area, followed by a shift in market sentiment and consolidation above the 1.3675–1.3686 zone, would validate bullish intent and signal readiness for a broader recovery.

GBPUSD - FACES RESISTANCE AS BEARISH SIGNALS EMERGESymbol - GBPUSD
CMP - 1.3525
GBPUSD has been rallying amid a weakening US dollar but is now encountering strong resistance and showing signs of a false breakout suggesting a potential corrective phase ahead.
The pair is currently testing a key resistance zone within a distribution phase, with a double top pattern forming on the higher timeframe - a classic bearish reversal signal. Despite the broader bullish structure, the failure to sustain gains above key resistance 1.3600 and ongoing consolidation below 1.3545 point to weakening momentum.
Additionally, the US dollar has reached support levels and may begin to recover, adding further downward pressure on GBPUSD.
Resistance levels: 1.3548, 1.3570, 1.3600
Support levels: 1.3512, 1.3455
If the pair cannot hold above 1.3565 during this retest, a deeper pullback is likely, potentially offering short opportunities. The correction could extend toward the 1.3450–1.3365 & may test 1.3300 support range before any continuation of the broader uptrend.

USDCHF - MORE DOWNSIDE ON THE HORIZON?Symbol - USDCHF
CMP - 0.8228
NZDCHF continues to weaken in response to the broader decline in the US dollar. The pair is currently testing the lower boundary of its trading range. A confirmed break below this level could pave the way toward the 0.8110 level.
USDCHF is exhibiting consolidation behavior, while simultaneously developing within a local descending channel. The pair is in the process of retesting support as part of its ongoing bearish movement. A consolidation phase is forming near the 0.8190 level, suggesting a potential pre-breakdown setup. The sustained depreciation of the US dollar is exerting downward pressure on the pair.
Prior to extending the decline, the price may temporarily retest the 0.5 Fib retracement level or fill the nearby Fair Value Gap (FVG)
Resistance levels: 0.8250, 0.8275
Support levels: 0.8190, 0.8117
The prevailing downward structure is likely to remain intact unless price action breaks decisively above the descending channel. As long as the pair consolidates near the lower end of the trading range, a short-term break below support is anticipated, potentially triggering a further decline toward the 0.8110-0.8050 zone.

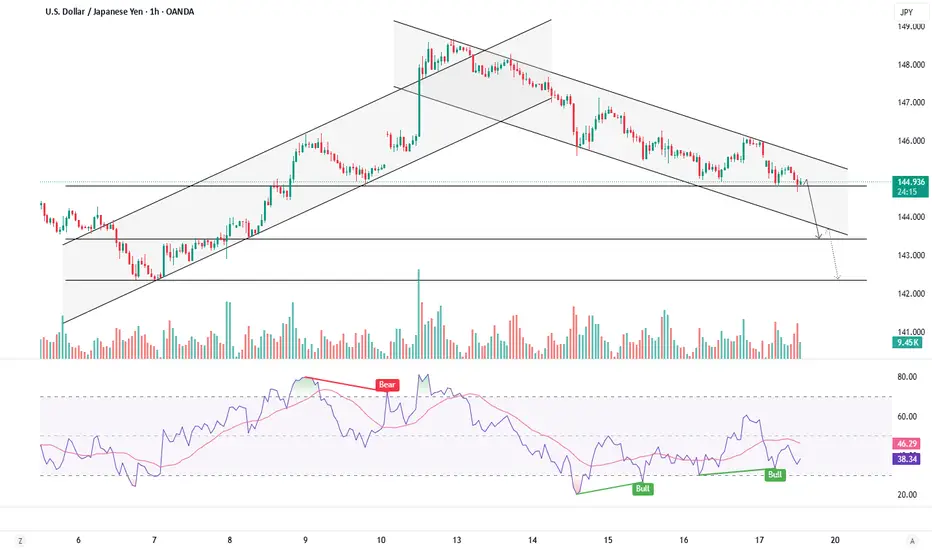
KEY SUPPORT IN FOCUS - CAN USDJPY HOLD THE LINE?Symbol - USDJPY
USDJPY is approaching a critical support level amid a prevailing local downtrend. Downward pressure on the US dollar continues to intensify, reinforcing the bearish momentum in the pair.
The US dollar index has begun to decline, which is mirrored in the weakening of USDJPY. Selling pressure is gaining momentum, and a local downtrend is clearly forming. The pair is currently testing key support at 144.82. A confirmed break below this level would likely pave the way toward lower support zones at 143.44 and 142.35, Sustained price action below 144.82 may act as a trigger for an extended sell-off.
Key Resistance levels: 145.34, 146.07
Key Support levels: 144.82, 143.44, 142.35
Both global and local trends remain bearish. The ongoing decline in the dollar may serve as an additional resistance factor, contributing to further downward momentum. A break and consolidation below the 144.82 support level would likely confirm the continuation of the bearish trend.
Trade Recommendation – USDCAD Buy Position (30-Minute Chart)PAIR: USDCAD
TRADE TYPE: BUY
TIMEFRAME: 30-Minute (M30)
ANALYSIS TIME: 10:35 AM, April 25, 2025 (UTC+7)
STRATEGY: Trend-following + EMA33 (High/Low) + Pullback Signal
✅ Trade Setup:
Entry: BUY around 1.3865
Stop Loss (SL): 1.3838
Take Profit (TP): 1.3957
Risk-Reward Ratio: 1:3.2 (high reward-to-risk setup)
🔍 Technical Analysis:
Short-term trend: Price is in a mild uptrend, forming higher lows.
EMA 33 (High/Low): Price is hovering near EMA33, showing a potential pullback bounce.
Price Structure: After a short-term correction, USDCAD is consolidating and showing signs of a potential breakout above recent highs.
Volume: Increased buying volume during bullish moves indicates strong buying interest.
📌 Trade Management Tips:
Hold the position if price breaks above 1.3885 with strong volume.
Consider trailing stop or move SL to breakeven once price hits 1.3900.
This setup is suitable for short-term swing trading within M30–H1 timeframe.
