BEL : High-Quality Setup Despite Market Weakness📊 Technical Catalysts :
This is a perfect VCP structure with a clean breakout supported by strong volume, clearly indicating institutional interest. The stop loss is well placed below the basing formation, keeping risk structurally defined. The 20 EMA crossing above the 50 EMA further confirms a bullish trend shift.
EPS and Sales are continuously increasing for the past few quarter. The only dip was in June and this is not a stock specific event but a market wide scenario.
🏭 Fundamental Catalysts :
Good Results ; EPS and Sales are continuously increasing for the past few quarter. The only dip was in June and this is not a stock specific event but a market wide scenario.
Q3 Beat: Net profit grew 20.4% YoY (₹1,590 Cr), comfortably beating street estimates. Revenue execution is at an all-time high.
The EU FTA Factor: The "Mother of All Deals" signed on Jan 27 opens up a $750B market for Indian defense electronics. BEL is the primary beneficiary as it scales up exports to European nations looking to de-risk from China/Russia.
Budget 2026 Speculation: With the Union Budget on Feb 1, the market is front-running a likely increase in defense capital outlay.
Even though the broader market is showing signs of weakness, the confluence of strong technical structure, volume-backed breakout, moving-average crossover, and improving fundamentals provides enough confidence to take this trade, while still maintaining disciplined risk management with a standard 1% risk per trade.
📢📢📢
If my perspective changes or if I gather additional fundamental data that influences my views, I will provide updates accordingly.
Thank you for following along with this journey, and I remain committed to sharing insights and updates as my trading strategy evolves. As always, please feel free to reach out with any questions or comments.
Other posts related to this particular position and scrip, if any, will be attached underneath. Do check those out too.
Disclaimer : The analysis shared here is for informational purposes only and should not be considered as financial advice. Trading in all markets carries inherent risks, and past performance is not indicative of future results. It’s essential to conduct your own research and assess your risk tolerance before making any investment decisions. The views expressed in this analysis are solely mine. It’s important to note that I am not a SEBI registered analyst, so the analysis provided does not constitute formal investment advice under SEBI regulations.
VCP

NIFTY – Bearish Structure Playing Out as AnticipatedIn my previous posts, I had clearly highlighted the possibility of a trend shift and warned that the ongoing price action could resolve to the downside. Over the last few sessions, price has started to play out exactly along those lines.
1. Bearish crossover (mini death cross)
A bearish crossover between the short-term and medium-term moving averages has now occurred. This was already anticipated and mentioned in earlier posts, and it marks a loss of bullish momentum after the ATH zone.
2. Clean breakdown below key support
Price has decisively broken below an important support and trendline structure. This confirms the bearish bias and strengthens the view that the broader market is under distribution rather than accumulation.
3. Next immediate support zone
The marked zone below acts as the next immediate support, where we may expect temporary consolidation or a technical bounce. However, unless there is strong follow-through buying, this should be treated cautiously.
4. Caution on bullish moves
Any signs of bullishness from here are likely to be temporary retracements, which may eventually trigger further sell-offs.
➡️ Avoid fresh swing longs until overall market sentiment turns favorable.
➡️ Existing positions should be managed with strict stop-losses and disciplined risk management.
The market is behaving in line with what was discussed earlier. Until structure changes and strength is proven, the risk remains on the downside. Patience and capital protection are more important than chasing trades in such phases.
📢📢📢
If my perspective changes or if I gather additional fundamental data that influences my views, I will provide updates accordingly.
Thank you for following along with this journey, and I remain committed to sharing insights and updates as my trading strategy evolves. As always, please feel free to reach out with any questions or comments.
Other posts related to this particular position and scrip, if any, will be attached underneath. Do check those out too.
Disclaimer : The analysis shared here is for informational purposes only and should not be considered as financial advice. Trading in all markets carries inherent risks, and past performance is not indicative of future results. It’s essential to conduct your own research and assess your risk tolerance before making any investment decisions. The views expressed in this analysis are solely mine. It’s important to note that I am not a SEBI registered analyst, so the analysis provided does not constitute formal investment advice under SEBI regulations.

Graphite India : VCP pattern ! Money may Double in 1.5 YearsHi Friends,
Graphite India looks promising now after ~08 years of time & price wise correction period. I am anticipating the stock to start its upward journey.
Chart Pattern : VCP
Targets, Stoploss & Entry price is mentioned in the chart .
Please feel free to share your views regarding this chart & analysis .
Note : I am not a SEBI registered advisor . Please consider my analysis only for Education purpose .

#DREDGECORP - VCP + Large Base BreakOut Script: DREDGECORP
Key highlights: 💡⚡
📈 VCP BreakOut in Daily Time Frame
📈 Volume spike during Breakout
📈 Large Base BreakOut
📈 MACD Crossover
BUY ONLY ABOVE 970 DCB
⏱️ C.M.P 📑💰- 968
🟢 Target 🎯🏆 – 22%
⚠️ Stoploss ☠️🚫 – 11%
⚠️ Important: Market conditions are Okish, Position size 25% per Trade. Protect Capital Always
⚠️ Important: Always Exit the trade before any Event.
⚠️ Important: Always maintain your Risk:Reward Ratio as 1:2, with this RR, you only need a 33% win rate to Breakeven.
✅ Boost and Follow to never miss a new idea!✅
Disclaimer: I am not SEBI Registered Advisor. My posts are purely for training and educational purposes. Not a BUY or SELL recommendation.
Eat🍜 Sleep😴 TradingView📈 Repeat 🔁
Happy learning with MMT. Cheers!🥂

Recurring VCP Structures: Multi-Phase Consolidation & Expansion1 . This chart distinctly showcases a series of visually captivating Volatility Contraction Patterns (VCPs) across multiple phases, elegantly demarcated by yellow trendlines that map out both historical and present consolidation zones. Each contraction zone is marked by repeated, precise touches on trend boundaries, reflecting steady accumulation followed by eruptive volatility and sharp price expansions—almost like a pattern “echo” cycling through the chart.
2 . The highlighted VCP structures reveal not just one, but several contraction-and-expansion cycles, creating an intricate tapestry of market behaviour. Note how each phase includes a concentrated period of sideways price movement, where activity compresses before unleashing swift, directional breakouts. The interplay of these phases turns the chart into a textbook reference for sequential VCP observation, with periods of quiet consolidation—almost like calm before a storm—setting the stage for pronounced volatility bursts.
3 . Recent activity amplifies this effect: vivid volatility swings transition rapidly into tight consolidation, echoing earlier pattern cycles and further emphasizing the recurring structural nature. These technical formations, combined with strong boundary touches and clear momentum surges, make the chart an excellent study in pattern recognition, volatility monitoring, and visual market structure analysis—all shared purely for observational insight, with no predictions or directional bias.
Raghav Productivity Enhancers Ltd | Weekly VCP Breakout | Moment🏭 Company Overview
Raghav Productivity Enhancers Ltd (NSE: RPEL) is India’s leading producer of silica ramming mass, a key refractory material used in steel manufacturing furnaces. The company operates modern facilities with global quality standards, catering to both domestic and international steel producers.
Fundamental Keys
Company's market cap ₹35,887 Cr
PE Ratio : High Valuation (78.90)
Price to sales: >15.75
ROE: >30% Excellent
ROA: >26% Good
Net Profit Margin: >19% Good
Operating Margin: >45% Good
EBITDA Margin: >28% Good
Debt-to-Equity: 0.0279 (debt-free profile)
Quick Ratio: 3.67
Cash Ratio: 0 (working capital tightness)
Debt to EBITDA: 0.098 Good
Annual sales have increased for 3 consecutive years.
Quarterly revenue trending upward for 5 years.
Strong balance sheet with growing total assets and minimal debt.
Financially robust with excellent profitability and asset efficiency.
Valuations are stretched, but strong earnings momentum supports short- to medium-term bullish sentiment.
Technical Analysis (Weekly + Daily)
Stock formed a perfect VCP (Volatility Contraction Pattern). A series of tightening swings leading to a breakout with a massive green candle.
Breakout candle closed near high - shows conviction buying.
Volume expansion on breakout confirms institutional participation.
Price now comfortably trades above key resistance zone (~₹740) flipping previous resistance into new support. All moving averages aligned bullishly with expanding volume signaling a high-probability breakout continuation.
Price trades above 9, 20, and 50 EMA - bullish alignment. ADX is showing healthy trend strength. RSI mildly overbought, typical for breakout continuation. MACD confirmed strong bullish crossover. Weekly volume surged to ~995K, 3× above average clear sign of institutional activity. Daily volume >615K confirms multi-timeframe buying interest.
Swing Trade Plan : For 1-3 weeks
Breakout Aggressive Entry: ₹795–805 On (close above breakout high)
Retest Entry: ₹740–760 (On low-volume retest of breakout zone)
Stop-Loss ₹650 Below 50 EMA / prior base
Target 1: ₹850–880 (First resistance zone)
Target 2: ₹950–1,000 )Measured flag projection)
Trailing Strategy:
Move SL to ₹740 after T1 achieved.
Trail below 9 EMA (daily) as price trends higher.
Exit if weekly candle closes below 20 EMA with volume expansion.
⚠️ Disclaimer
This analysis is for educational and research purposes only. It is not financial advice. Always conduct your own due diligence and use proper risk management.

Volume Contraction Pattern Amidst Dual TrendlinesThe chart reveals important price structure and behavior over the past 18 months, featuring both a prominent counter trend line (marked in red) and a long-term support trendline (marked in green). Each element signifies distinct phases of supply absorption and buyer interest.
• Counter Trend Line (Red): This line has consistently acted as a pivot for multiple lower highs, reflecting the presence of vigilant sellers at each attempt to move higher. Multiple reaction points along this line indicate repeated supply emergence whenever price approached the zone, especially after sharp rallies earlier in the trend.
• Support Trend Line (Green): The green upward-sloping line marks sequential higher lows. This support axis has been respected multiple times, hinting at growing accumulation at each retest despite temporary price weakness in the broader market. The curvatures at lows (forming cup-like bases) display periods of volatility contraction and constructive price action as buyers step in at successively higher prices.
• VCP Dynamics: The pattern visible in the chart exhibits systematic contraction in the price swings. Each corrective structure—characterized by the curved reactions at support—shows a shrinking amplitude in both price and volume. This VCP sequence typically points toward consistent supply absorption, with sellers getting exhausted at lower levels after each contraction. The emergence of strong green candles with above-average volume near the support line often signals a revitalization of demand forces, as seen recently.
Nifty 50 Hits Major Supply Zone After Trendline & VCP Breakout!Today, we're diving deep into the Nifty 50 chart, which is painting a very interesting picture. After a significant downturn, the bulls have been patiently and persistently fighting back. We've seen the index respect several supply zones in the past, leading to temporary declines. However, the character of the market seems to be shifting, and a major breakout has just occurred that we need to talk about.
🚀 A Tale of Two Patterns: Triangles and VCPs
If you look closely at the price action, a story unfolds. For months, Nifty was constrained by a sloping trendline, getting rejected from it on two separate occasions. At the same time, the price was carving out a series of higher lows. This convergence of a flat top (the trendline resistance) and rising bottoms formed a classic ascending triangle pattern—a sign of building bullish pressure.
What makes this setup even more compelling is the subtle pattern within the pattern: a Volatility Contraction Pattern (VCP). Notice how after each minor decline, the pullbacks became shallower. This "drying up" of selling pressure is a textbook sign that sellers are losing control and the big players are accumulating positions. The formation of this VCP right before the breakout was a strong hint that the subsequent move could be powerful and decisive.
Yesterday, we witnessed the culmination of this battle. The price broke out of the triangle and shattered the downward-sloping trendline with significant momentum, slicing through previously tested supply zones. This is a clear victory for the bulls in the short to medium term.
What's Next? Navigating the Path Ahead 🎯
Now for the million-dollar question: where do we go from here? The breakout is strong, but the path ahead isn't without its obstacles.
The Immediate Hurdle: Price is currently pushing into a fresh supply zone . This is the first significant test for the bulls post-breakout. We should anticipate some friction here as sellers who were waiting at these levels might try to defend their territory. This could lead to a bit of consolidation or a minor pullback, which is perfectly healthy.
The Ultimate Test: If the momentum continues and buyers overwhelm the sellers at the current zone, the next major target comes into view. This upper supply zone is particularly critical because it coincides with the All-Time High (ATH). The ATH is not just a technical level; it's a major psychological barrier where many traders may look to book profits. A rejection from this all-important zone is a high probability, given its significance.
In the upcoming sessions, we'll be watching closely to see how the price behaves at these key levels. The strength of the current momentum suggests that the immediate supply zone could be overcome, but the real test awaits at the peak.
Lastly, Thank you for your support, your likes & comments. Feel free to ask if you have questions.
The goal of a successful trader is to make the best trades. Money is secondary.
Disclaimer: Please note that this analysis is purely for educational purposes and should not be considered as a trading or investment recommendation. I am not a SEBI registered Analyst. Always conduct your own research and consult with a financial advisor before making any investment decisions.

Multi-Timeframe VCP Observations📊 Weekly Time Frame Observations (left panel)
- It displays a visible pattern contraction structure, specifically a Volatility Contraction Pattern (VCP), formed over multiple months
- An orange trendline marking the descending resistance, and a green line depicting the rising support, which together highlight the range contraction of price
- Volume spikes coincide with specific price responses at these zones, denoting heightened activity during volatility periods within the VCP
📈 Daily Time Frame Observations (right panel)
- Presents a more compressed Volatility Contraction Pattern (VCP), mirroring the broader weekly setup but over a shorter time span.
- Below the blue 200-day exponential moving average
❗ Disclaimer: The above post is strictly observational and does not constitute any trading advice or predictions regarding breakout or price direction.
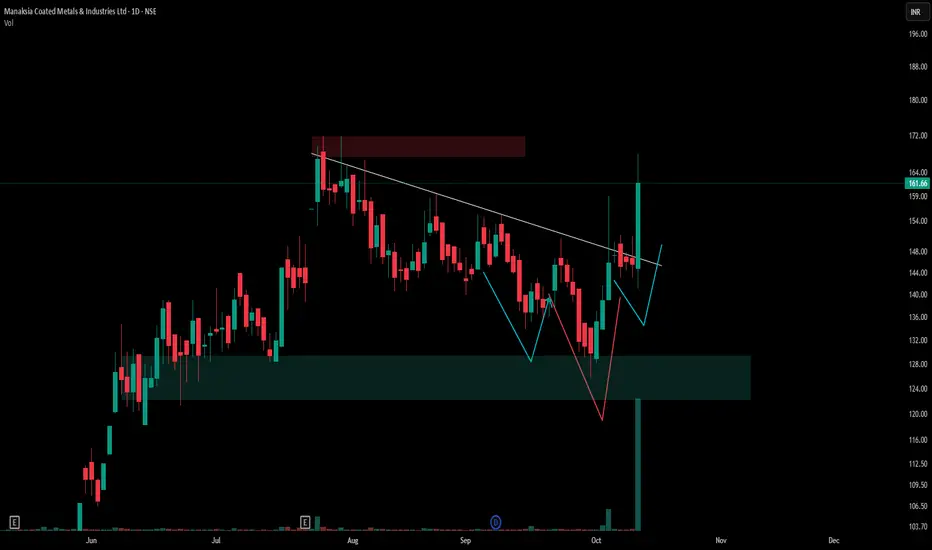
Observing Key Structural Patterns in Manaksia Coated MetalsThe daily chart of Manaksia Coated Metals & Industries Ltd (NSE) displays a confluence of notable technical formations. There is a clearly defined demand zone (highlighted in green) that has provided support for multiple sessions, as well as a supply area (marked at the upper region), signifying previous resistance.
A visually tight Volatility Contraction Pattern (VCP) is present, where price swings narrow progressively, indicating potential accumulation and increasing trader interest. The chart also reveals an inverted head and shoulders pattern, depicted using blue and red lines, which is often recognized as a classic reversal formation in technical analysis.
No attempt is made to forecast price movement; the Chart purely reflects observed market structure and patterns.
Disclaimer
This post is for educational and observational purposes only. It does not constitute financial advice or a trading recommendation. Always conduct your own research and consult a certified financial advisor before making investment decisions.
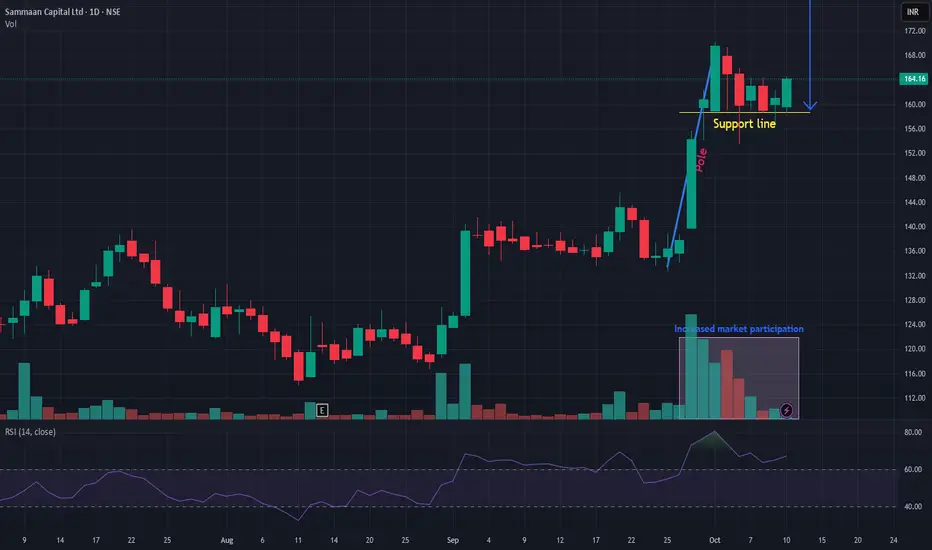
SAMMAANCAP SAMMAANCAP is showing very good strength and currently available at low risk. Forming VCP pattern. Seems like currently facing from sideways and may come out of the range and will take a new ride above resistance line. Risk-reward quite in favor. Keep it in a watchlist.
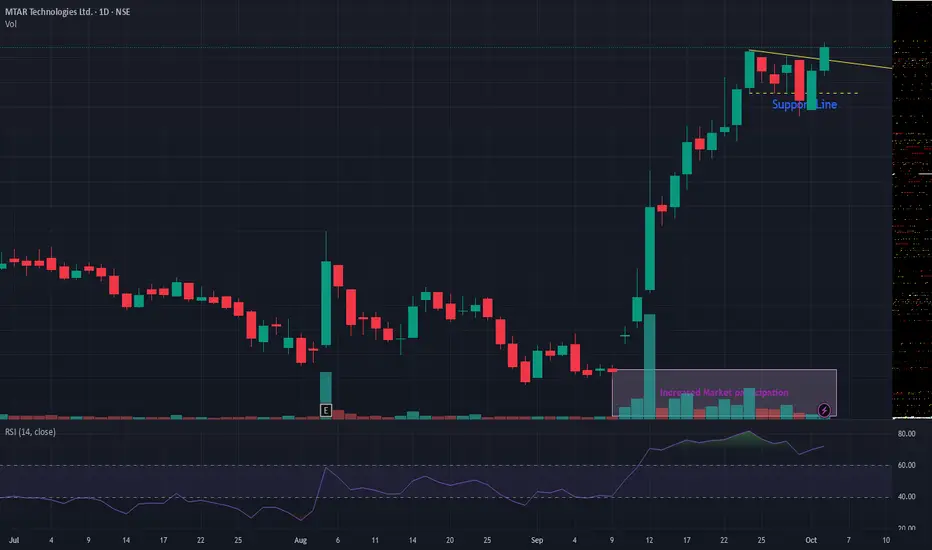
MTARTECHMTARTECH giving trend-line breakout. VCP breakout also observed. Volume too has spiked. As long as it is above support line, the stock seems attractive. Many defense stocks are showing strength and trying to give a run! Keep in your watchlist
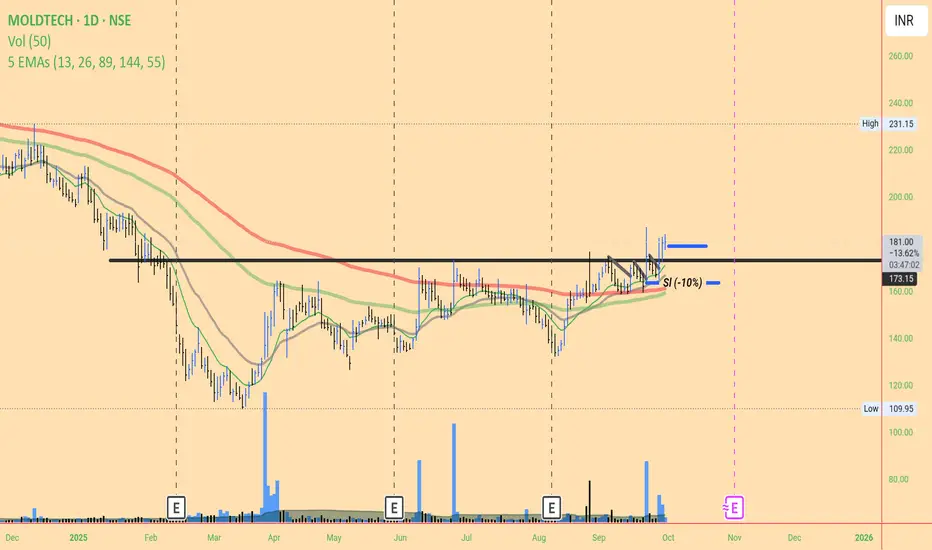
Mold-Tech #technicalanalysis
pattern look like vcp from left to right move price became narrow.
High volume after absorption ,
* Now price break 1st correction candle above trade. Entry point
* Sl -10% , from entry point 179 current price,
Reason below high volume after selling zone absorption area below that.
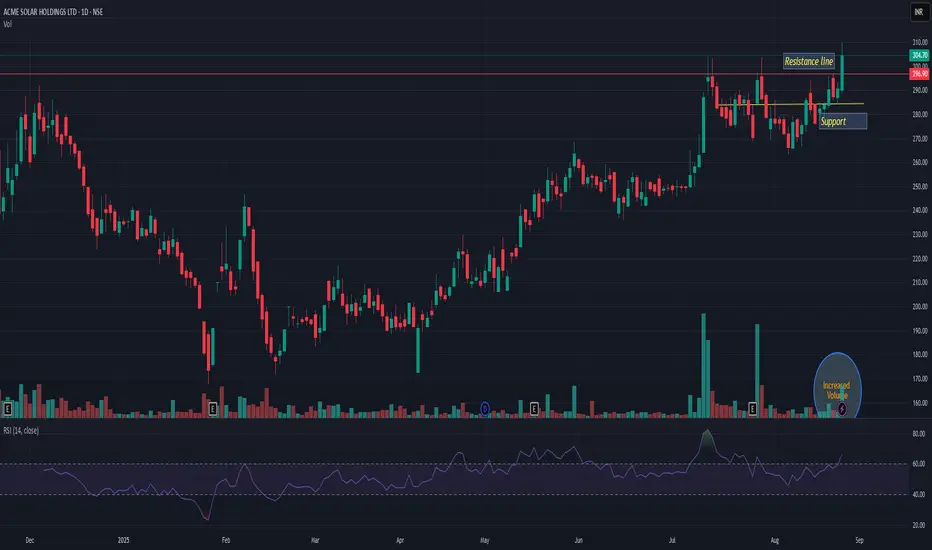
ACMESOLARACMESOLAR giving resistance breakout with decent volume. Support is near 280. Seems like this may take a new ride; trading at ATH. Very high probability that it can add up 12-15% from current level. Its very good risk-reward trade. Keep in yr watchlist
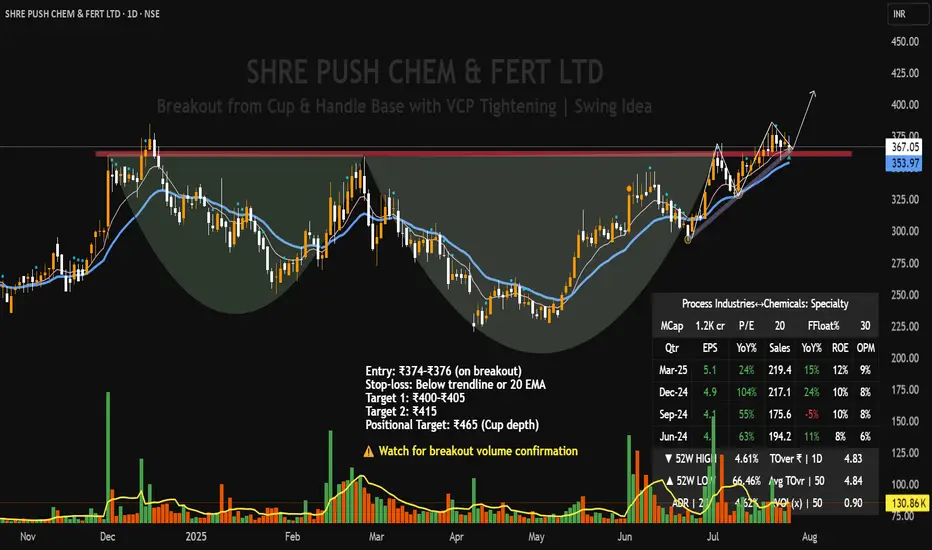
SHREE PUSHKAR CHEMICALS – Cup & Handle + VCP Breakout Setup |Technical Structure:
SHREE PUSHKAR CHEMICALS is forming a high-quality breakout setup on the daily chart, combining both a Cup & Handle pattern and a Volatility Contraction Pattern (VCP) within the handle zone.
Cup & Handle base formation extending from Nov 2023 to Jul 2025
Mini VCP within handle, showing tight range contraction, signaling institutional accumulation.
Ascending trendline support holding firm, along with the 9 EMA.
Volume contraction during each pullback
A confirmed breakout above ₹378 with volume can trigger a strong upside continuation.
Volume has steadily contracted across the handle, especially during pullbacks
Current price is tightening just under the breakout zone — ideal for a low-risk entry
A decisive breakout on volume >150K will act as a confirmation trigger.
Fundamentals
Market Cap : ₹1,200 Cr (Small-cap room for growth)
P/E Ratio: ~20x Reasonable for specialty chemicals
EPS Growth: 24% YoY Consistent profit improvement
Revenue Growth: 15% YoY Stable.
ROE: ~12% Healthy return metrics
Operating Margin: ~9% Sustainable profitability
This setup reflects strong technical discipline with a clean, low-risk structure. Ideal for swing traders looking for breakouts backed by volume and volatility contraction. Watch closely for confirmation with volume.
Radhika Jeweltech – Classic Contraction PatternTimeframe: Weekly
Structure Observed: Contraction Pattern between Trendlines
Volume: Significant recent uptick 📊
Key Zones:
🔴 Supply Zone above 123
🟢 Dynamic Support from ascending trendline
🟠 Active counter-trendline now breached
After months of lower highs and higher lows, the price has been squeezing into a classic contraction pattern between a descending orange trendline (acting as counter-trendline resistance) and a rising green trendline providing consistent support.
This week’s candle has decisively broken above the descending trendline on strong relative volume.
With the weekly close due tomorrow, all eyes remain on how the candle settles — will it sustain this breakout structurally or retreat below the trendline?
📌 Important Note: This is a technical observation — not a trade recommendation.

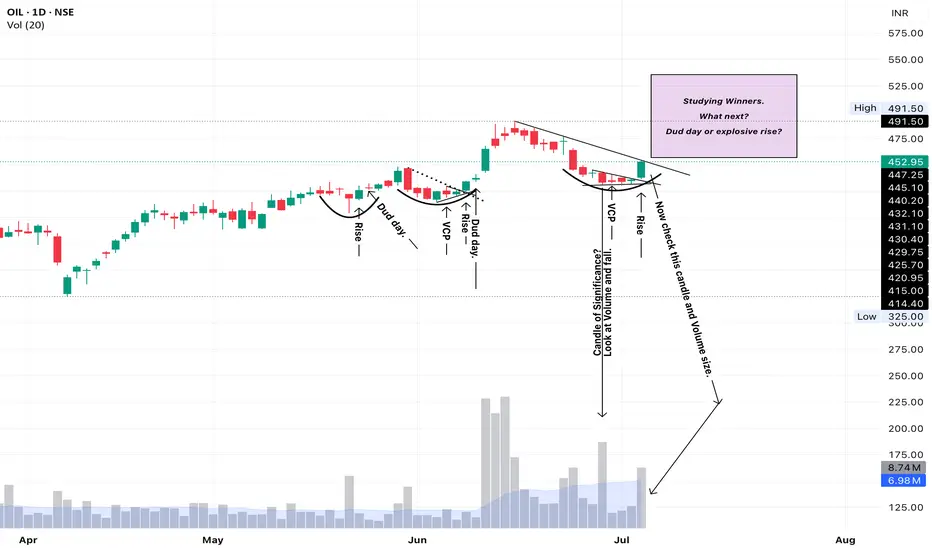
OIL - VCP and riseDisclaimer: I am not a SEBI Registered Analyst. Please do your own research or study.
Also , point out any anomaly you see and assist correct bias.
My Bias: Bullish. If not moved in 2-3 days, this may fade.
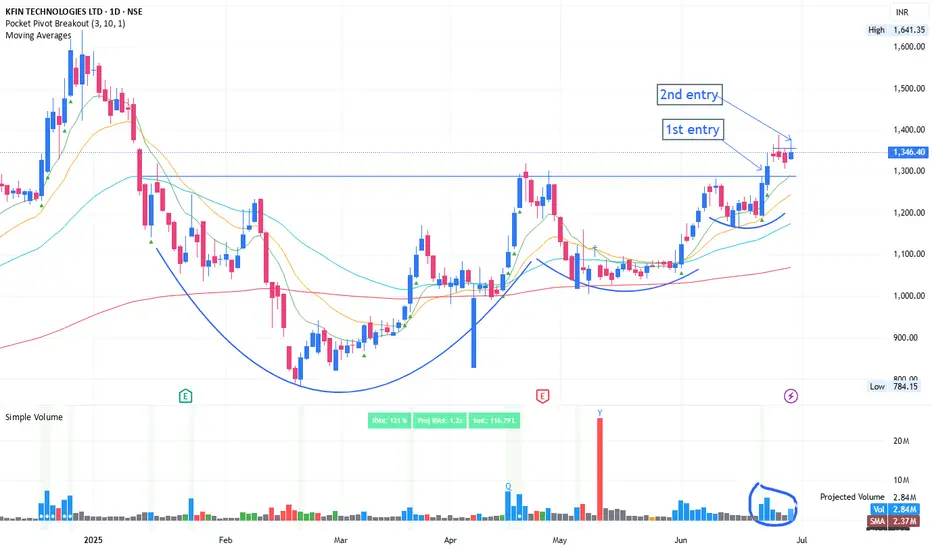
Volatility contraction, breakout and tightnessKFINTECH: Recent breakout which was marked as 1st entry. It is the safest entry, good thing is, post breakout it is forming tightness in price. This acts like spring. Once it bounce from this level, then there are high chance of blasted move.
2nd entry could be above the tightness breakout with 200-300x RVOL during early starting of trading session. This could give huge intraday returns and good topup over existing position
Stay connected for upcoming development and notes.
Disclaimer:
The information provided herein is for educational and informational purposes only and should not be construed as investment advice. The stock analysis and recommendations are based on publicly available information, data sources believed to be reliable, and our interpretation at the time of writing.
Investing in equities involves risks, including the risk of loss of capital. Past performance is not indicative of future results. Readers and investors are advised to conduct their own research or consult a qualified financial advisor before making any investment decisions.
The author(s), affiliates, or associated entities may hold positions in the stocks mentioned, and such positions are subject to change without notice.
We do not guarantee the accuracy, completeness, or timeliness of any information presented, and we disclaim any liability for financial losses or damages resulting from the use of this content.
NOVAAGRINOVAAGRI giving classical VCP breakout. Recently given 2 times flag pattern breakout with high volume. And then again consolidation with dried volume. Today again formed a pole of flag with decent volume. Now as long as it is closing above resistance line which is around 51 then I think its good accumulation zone. Up side its open for large space! Track it closely.

#GODREJIND - VCP Set up Breakout in Daily Time Frame.📊 Script: GODREJIND
Key highlights: 💡⚡
📈 VCP Set up Breakout in Daily Time Frame.
📈 Price consolidating near Resistance, then Breakout.
📈 Volume spike seen during Breakout.
📈 MACD Cross
📈 Can go for a swing trade
⚠️ Important: Always Exit the trade before any Event.
⚠️ Important: Always maintain your Risk:Reward Ratio as 1:2, with this RR, you only need a 33% win rate to Breakeven.
✅Like and follow to never miss a new idea!✅
Disclaimer: I am not SEBI Registered Advisor. My posts are purely for training and educational purposes.
Eat🍜 Sleep😴 TradingView📈 Repeat 🔁

INDIGOPNTS: volatility contraction pattern
➡️ VCP (volatility contraction pattern)
➡️ decent financials with increasing cash flow from operations year over year
➡️ a management which thinks long term reflecting from the recent comments
➡️ crude prices below USD 70
➡️ have been holding this since my last post (added more recently) and my view has changed

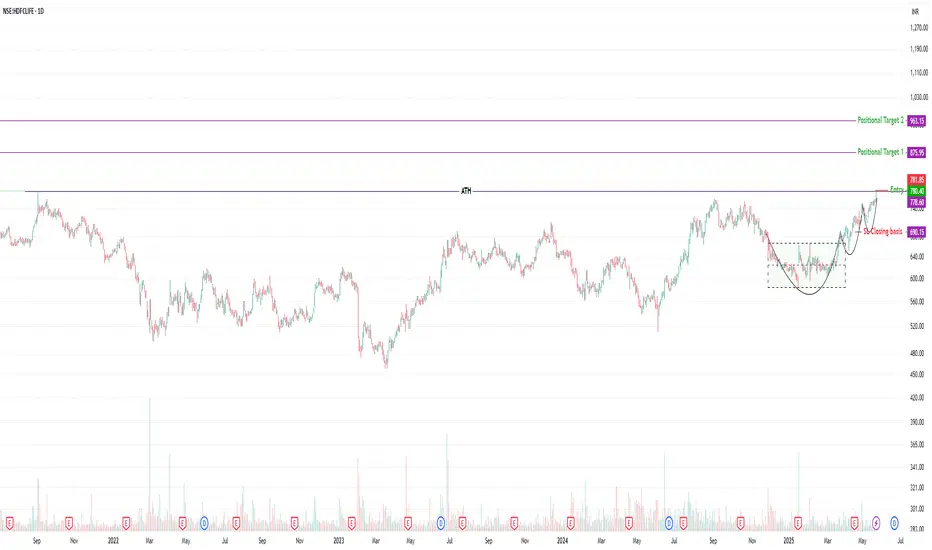
HDFC LIFE – VCP Breakout Setup | ATH ZoneHDFC LIFE – VCP Breakout Attempt | ATH Test After 44 Months
📈 Structure: Volatility Contraction Pattern (VCP)
📦 Base: Tight consolidation zone (rectangle)
📊 Trend: Higher Highs & Higher Lows
🟢 Volume: Gradually picking up
💥 Last Session: Wide range bullish candle
🔝 ATH Zone: Testing Sep 2021 high (44-month range)
📌 Price Action: Trading above Key DMAs
The stock formed a clean VCP structure with tight contractions and shallow pullbacks. It broke out from its recent base and is now testing the all-time high from Sep 2021, making this a high-stakes breakout watch.
Currently, it’s forming a breakout setup with entry above the previous day’s close — ideally confirming with more volume above ₹790.
📍 Trade Plan
Entry: 781.85
Stop Loss (Close Basis): 690.15
Target 1: 875.95
Target 2: 963.15
📊 Risk & Reward
Risk: 11.75%
Target 1: 12.02%
Target 2: 23.18%
RR to T1: 1 : 1.02
RR to T2: 1 : 1.97
⚠️ Risk Management Notes
Even though the structure is clean and momentum is building, risk remains high as the stock is trading at ATH levels — a zone where volatility can spike.
Always remember:
Protect capital first — never let a single trade ruin your portfolio
If it fails to hold above the breakout zone, pullbacks can be sharp
Don’t ignore market breadth and macro sentiment
Trade only with proper position sizing and SL discipline. If the breakout sustains with strength, this could enter a strong trend — but risk-reward must justify the trade.
📌 This is not a buy/sell recommendation. Just a technical view for educational purposes.
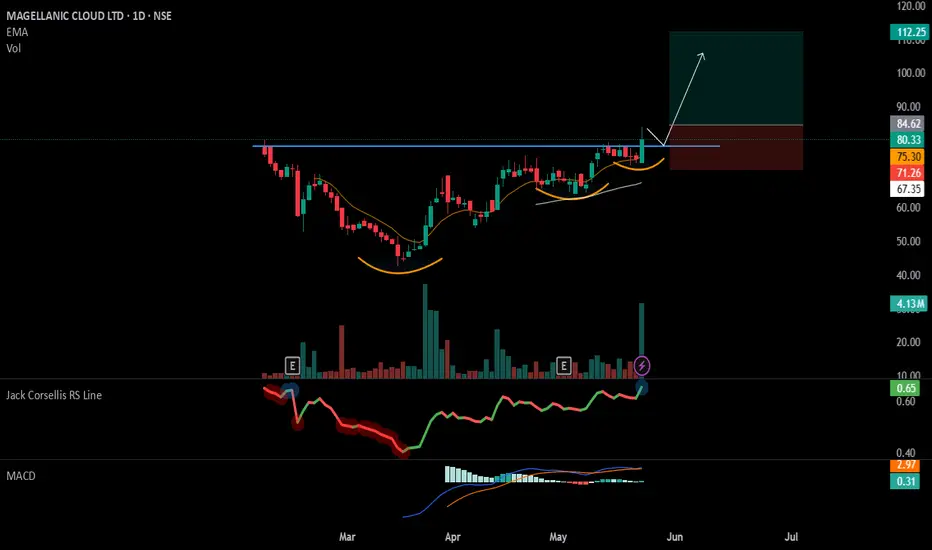
#MCLOUD - VCP + IPO Base Break Out📊 Script: MCLOUD
Key highlights: 💡⚡
📈 VCP + IPO Base BreakOut in Daily Time Frame.
📈 Price consolidated near Resistance.
📈 Volume spike seen
📈 MACD Crossover
📈 Can go for a swing trade
BUY ONLY ABOVE 85 DCB
⏱️ C.M.P 📑💰- 80.33
🟢 Target 🎯🏆 – 31%
⚠️ Stoploss ☠️🚫 – 15%
️⚠️ Important: Market conditions are Okish, Position size 50% per Trade. Protect Capital Always
⚠️ Important: Always Exit the trade before any Event.
⚠️ Important: Always maintain your Risk:Reward Ratio as 1:2, with this RR, you only need a 33% win rate to Breakeven.
✅Like and follow to never miss a new idea!✅
Disclaimer: I am not SEBI Registered Advisor. My posts are purely for training and educational purposes.
Eat🍜 Sleep😴 TradingView📈 Repeat 🔁
Happy learning with MMT. Cheers!🥂