intradayyou can buy on breakout or you can sell at resistance depend on the candle
both side potential
avoid first 15min breakout
wait for 15 min candle closing
targets are marked
if the breakout comes after 10:00 am then the probability of winning will be more.
follow risk management
do your own analysis
do workout
do meditation
start reading books
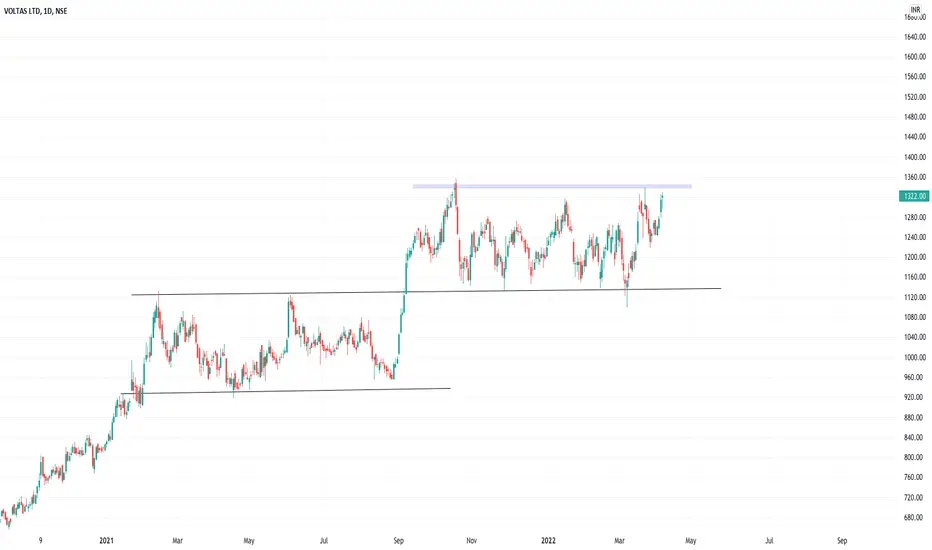
Voltas-intraday


watch for range breakout buy above 1350 in intraday or swing trade
stoploss for swing trade daily candle close below 1295
For stoploss in Intraday use 5 minute chart and see nearest support.
for target use 5 min chart and fibonacci pivots as i don't keep predefined target.
try to book partially and trail.
Note: this is not a prediction for LONG/SHORT, trade will trigger only on given level as per technical analysis
NOTE: For Gapup or bo before 9:20
If gapup is more than 1% from bo level than avoid completely.
if less than 1% or gives bo before 9:20 than wait for
first 5 minute candle and entry above 5 minute candle
and revised SL below candle Low.
Voltas 15 min TF Intraday Buying ViewVoltas buying view
ABCD harmonic pattern
Buy for option and for cash
TGT on the chart
ph 7.0.0.0.7.7.2.5.7.6

Intraday Trade: range breakout done buy above highbuy above 1140 in Intraday
For stoploss in Intraday use 5 minute chart and see nearest support.
for target use 5 min chart and fibonacci pivots as i don't keep predefined target.
try to book partially and trail.
Note: this is not a prediction for LONG/SHORT, trade will trigger only on given level as per technical analysis
NOTE: For Gapup or bo before 9:20
If gapup is more than 1% from bo level than avoid completely.
if less than 1% or gives bo before 9:20 than wait for
first 5 minute candle and entry above 5 minute candle
and revised SL below candle Low.


'VOLTAS' analysis for 2nd August 2021Buy/Sell only on given levels. The above chart is only for educational purpose. Make sure you don't trade blindly, reanalyze and trade

voltasNSE:VOLTAS
voltas descending triangle breakout happend on the up side expecting upside target marked on the chart
only for educational purpose
it can be a trap also desending triangle (bearish sign)
a gap pending below

Voltas EWT, Weekly TF. & Hourly TF.Elliott Wave footstep for Voltas:
Validation:
W2 & W3 corrective
W2 retraced at 50% exact
W3, price extended 161% compare to W1.
The Corrective W4 traveled in rage between 38.2 and 50%.
W5 exactly was normal.
The price is under the waves a,b, and c correction.
Support 408, can push price up-to 492 and 530+ for corrective wave 'b'.
1 hour chart:
Loot up "EW Theory" for hourly TF.
398-408 is target for short sellers
Support 400 nearby to push price upside 458 nearby.

VOLTAS 675 || LONG || INTRADAYBUY above 675 SL 673
Targets 677, 680, 682, 685, 688, 690
OR
VOLTAS 31OCT 680 CE (₹23.85), 700 CE (₹15.80)

VOLTAS 630 || SHORT || INTRADAYSELL below 630 SL 632
Targets 628, 625, 623, 620, 618, 615, 612
OR
VOLTAS 26SEP 630 PE (₹0.70)

VOLTAS 620 || SHORT || INTRADAYSELL below 620 SL 622
Targets 618, 615, 612, 610, 608, 605, 600
OR
VOLTAS 26SEPT 600 PE (₹10.45)


My PredictiveEngine's Intraday call(11-Jun-18)-VOLTAS-LongBased on my PredictiveSystem's signals, its going to be a GREEN candle on 11-Jun-2018 for VOLTAS
Buy Above: 531.3 for targets -
T1: 535.3
T2: 537.7
T3: 540.2
SL: 527
Note: These calls are based on my own analysis. It may or may not work well for you.So please carefully consider whether it is suitable for you and please do your own research before attempting any. The profit/loss made by you due to this call, is solely your own responsibility. Thanks, All the best. Happy Trading. :-)

My PredictiveEngine's Intraday call(31-May-18)-VOLTAS-LongBased on my PredictiveSystem's signals, its going to be a GREEN candle on 31-May-2018 for VOLTAS
Buy Above: 549.8 for targets -
T1: 553.9
T2: 556.4
T3: 559
SL: 545.4
Note: These calls are based on my own analysis. It may or may not work well for you.So please carefully consider whether it is suitable for you and please do your own research before attempting any. The profit/loss made by you due to this call, is solely your own responsibility. Thanks, All the best. Happy Trading. :-)
