Voltas

Voltas - Long SetupThe stock is trading in a range for the last 4 months. if gives a breakout at 1065, and sustains above, then may go to 1250 levels or more. Sustaining below 950 will show weakness on the charts.
only for learning and sharing purposes, not a bit of trading advice.
please share your views with comments.
All the best.

VOLTASWait And Watch ??
Look for Low risk, High reward, and High Probability setups-
Things to Remember while Trading with the Trend
1. Know what the trend is.
2. The best trades are made in the direction of the trend.
3. Assume that the main trendline or moving average will hold.
4. The longer the moving average is, the better it defines the trend.
5. Wait for the pullback.
6. Don’t chase the market.
7. Don’t fight the market.
8. Even in the strongest trends there should be some retracement.
9. The closer the market is to the trendline, the better the risk/reward ratio is.
10. Use ADX to determine the strength of the trend.
11. Higher the level of ADX , the stronger the trend, below 20 consider the market to be choppy
12. Hold trades longer in a strong trend.
13. Wait for confirmation of a trendline breaking before reversing position.
14. Know where the Support levels are.
15. Place stops outside the Support levels.
Thank You..


voltas voltas trading between the triangle pattern cross above it can lead to 1150,1200 levels stop loss can be below 960

VOLTASNSE:VOLTAS
One Can Go long with a Strict SL below the Trendline or Swing Low of Daily Candle.
Close should be good, and Clean.
R:R ratio should be 1 :2 .
Disclaimer : You are responsible for your Profits and loss, Shared for Educational purpose

Voltas on sweet spot !1Voltas can be kept in watchlist for swing trade it is trading at strong support if market remain positive we may see sudden bounce make and can give up to 5% in short term.

VOLATAS Breakdown SeenHuge Sell off in the Voltas Stock has been Seen, Also Stock has seen Pattern Break down, I am Bearish on the Stock, Will be Selling Voltas Future Below 925 For Targets of 900 And Stoploss 940


Voltas : A 20% Play upside1. Voltas respecting 21 EMA
2. An unfilled Gap stays at 1040 and has a tremendous confluence of downwards trendline, gap area, and a 50% retracement of the current downswing.
3. SL being 903 on a closing basis.
4. Buy on dips as near as 910-920 level

Perfect example of DOUBLE BOTTOM With DIVERGENCENSE:VOLTAS
Double bottom is always a perfect pattern for LONG ENTRY.
But I prefer to add some more factors which increases my probability to achieve the target.
In this analysis tutorial, we will learn that.
* After falling wedge pattern breakdown Stock momentum is exhaust near a good Support.
- Never Entered in ONE SIDED BREAKDOWN or BREAKOUT. Wait for the Next GOOD SUPPORT - RESISTANCE, Because one sided move Creates a Doubt( maybe its a TRAP for a RETAIL TRADER like us).
- ONE SIDED BO-BD can be a FAKE BO-BD ( In Mostly cases )
- And incase, If it's not a Fakeout - Fakedown, But a genuine one and we missed that - DON'T PANIC - Never entered in FOMO because this can spoil our RR.
- THIS STRATEGY IS A SOLUTION FOR ALL THE ABOVE SITUATIONS.
* And at that support( IN BIGGER TIME FRAME) I Found BULLISH DIVERGENCE.
- Divergence is basically a manipulation by a big players.
- In Bullish divergence with the help of some OSCILATTORS we see PRICE IS DECREASING but AVERAGE PRICE or STRENGTH or VOLUME is INCREASING. - {Opposite in BEARISH DIVERGENCE}
- But if there is not any SUPPORT - RESISTANCE - - - - - IGNORE THAT AND NEVER ENTER.
- Because WE FOLLOW ONLY&ONLY PRICE ACTION, Indicators is secondary.
- And basic principle of PRICE ACTION is - NEVER ENTERD WITHOUT A SUPPORT RESTISTANCE ZONE OR TRENDLINE SUPPPORT OR ZONE.
* When this stock Follows all rules of BULLISH DIVERGENCE I took a LONG ENTRY.
- COMMENT if you wants to know all the RULES of DIVERGENCE.
* Now chart pattern shows a signal of UPSIDE MOVE and our Divergence setup gives us a confirmation of that SO I ENTERED and ACHIEVED THE TARGET
I hope this is helpful for beginners and a good revision for a pro players.
DIVYA BIHARI DAS this side.
THANKYOU SO MUCH.
--------- COMMENT -----------
- Your Views
- My Mistakes
- Next Topic
- Anything Relevant

inverted flag and Pole Pattern AT voltas ltdInverted FLAGANDPOLE Pattern
CMP 1017
Entry 1004
Targets 920/830/ may be 707
Sl @ 1135

Voltas Bullish Extreme Shark PatternVoltas has Dropped Since last Week. Near 958 to 951 we can find two PRZ with Previous Support.


VOLTASVoltas is available at an attractive price. Corrected almost 30% from recent high and now trading close to a support zone on day chart.
Note : for educational purpose only.

Breakdown in Voltas...Chart is self explanatory. Entry, Targets and Stop Loss are mentioned on the chart.
Disclaimer: This is for demonstration and educational purpose only. This is not buying or selling recommendations. I am not SEBI registered. Please consult your financial advisor before taking any trade.

VOLTAS Long opportunityNSE:VOLTAS
Stock -> Voltas
TimeFrame->Weekly
Hello all!
Voltas has been taking constant support from its lower trendline since May 2020. This then further transitioned into a channel in February 2021. After traveling in a channel for a few months, it's now stuck in an Accumulation/Distribution (A/D) zone since September 2021.
Whether it's an accumulation zone or distribution zone, only time will tell. Small quantities of the stock can be purchased here with a minimal stop loss placed below the A/D zone and further quantities can be added once it breaks above the A/D zone. For Traders, the perfect entry would be after the breakout from the yellow box.
The analysis would become invalid if the stock breaks below the A/D zone.
*NOT A CALL*
#voltas #nifty #trendanalysis #swingtrading

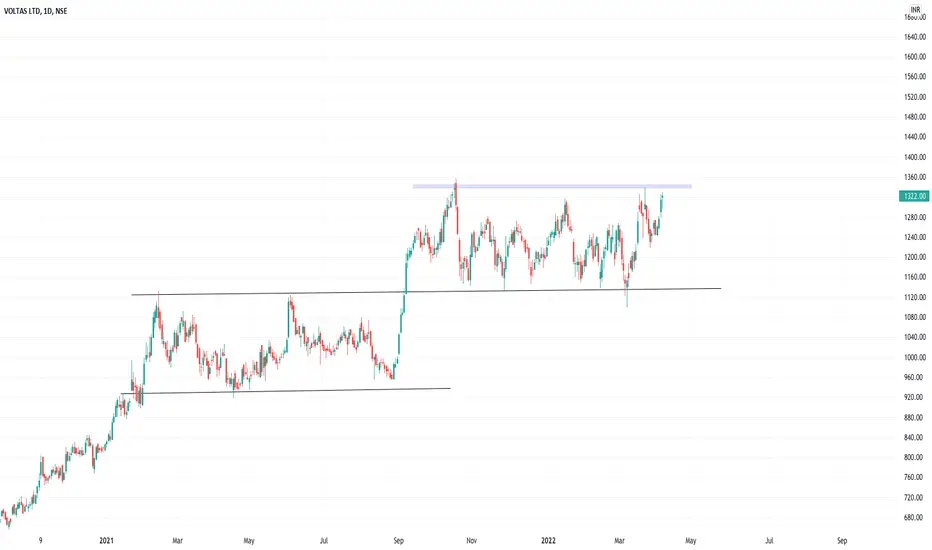
VOLTAS - Descending Triangle Pattern BreakoutDescending triangle pattern breakout which can follow the trend direction towards upside.
If sustains above the zone marked in pink, we can fresh all time high in next few weeks. Trade at your own risk management and analysis.


VOLTASVoltas, this stock has been consolidated in a parallel channel since October 2021, and now very first time it has closed just out of that same channel's top on daily time frame,
Also it has been closed above 20DMA from last 15 days and sustaining on same.
As per elliot wave structure we can assume that from the low of 8th March fresh impulse wave 1 started and on the 17th March wave 2 was started and completed on 28th March, So now possibly wave 3 is in unfolding phase.
RK's Magic indicator is also showing cloud impulse buy on daily chart, along with macd turned positive crossover on weekly chart.
Overall it looks good candidate to go long, at current levels or in dips ( if any ).
on the way up side 1457 is the level where wave 1 and wave 3 would be equal, and on the way down RK's stoploss line which is pegged at 1244, can be a good support level to watch out for in forth coming days.
Wave structure on daily also all key levels are mentioned on chart
macd positive crossover on weekly
macd positive on daily
rsi breakout and uptick on daily
Most investors treat trading as a hobby because they have a full-time job doing something else.
However, If you treat trading like a business, it will pay you like a business.
If you treat like a hobby, hobbies don't pay, they cost you...!
Disclaimer.
I am not sebi registered analyst.
My studies are for educational purpose only.
Please Consult your financial advisor before trading or investing.
I am not responsible for any kinds of your profits and your losses.

watch for range breakout buy above 1350 in intraday or swing trade
stoploss for swing trade daily candle close below 1295
For stoploss in Intraday use 5 minute chart and see nearest support.
for target use 5 min chart and fibonacci pivots as i don't keep predefined target.
try to book partially and trail.
Note: this is not a prediction for LONG/SHORT, trade will trigger only on given level as per technical analysis
NOTE: For Gapup or bo before 9:20
If gapup is more than 1% from bo level than avoid completely.
if less than 1% or gives bo before 9:20 than wait for
first 5 minute candle and entry above 5 minute candle
and revised SL below candle Low.
Voltas April 2022 Summer Swing Breakout Positional Good to take position above 1365 till 1375
Positional targets 1460 SL 1320
Long targets of 1600 SL 1220

Live Challenging Stock Market Analysis Buy Voltas @ 984.35Market Analysis
Live Challenging Stock Market Analysis Buy Voltas @ 984.35
Target @ 1128.40
Our Unique Features:
—————————————————————
1. Follow our 15 signals ….10% equity will increase in your account for sure.
2. We are not Trailing stop! or average the trades.
3. 2% Risk Management Per trade.
4. Risk vs Reward up to 1:7.
Note:
Trade signals would usually have a risk to reward ratio of 1:2.
It means that even 2 out of 4 signals hits their SL marks, the other two would have closed with profit.
This allows you to be good in overall pips profit.
Signals are usually inter-day (Based on the daily candle) therefore, trades would usually have a holding time of an average minimum of 24 hours.
Note: Everything works with Best money management.
Note: Please leave comments for any query.
Disclaimer: This is my trading experience, it is not an invite or recommendation to trade.
Best Wishes
Forex Tamil
