UNOMINDA - Possible Breakout with Bullish Candle📊 UNOMINDA – Technical & Educational Snapshot
Ticker: NSE: UNOMINDA | Sector: 🚗 Auto Components
CMP: ₹1,149.80 ▲ (as of 16 Aug 2025)
Rating (for learning purpose): ⭐⭐⭐⭐
Pattern Observed: 📈 Possible Breakout with Bullish Candle + RSI/Bollinger Band Confirmation
🔑 Key Reference Levels (For Learning)
Resistance Zones: 1150 – 1165 – 1179 – 1204
Support Zones: 1125 – 1100 – 1085
Reference Pullback Zone: 1068
Risk Reference Zone: 1011
Potential Upside Zones (Educational Projection): 1255 → 1387 → 1456 → 1556
📌 Technical Observations
✅ Bullish candle near resistance
✅ RSI momentum breakout above 64
✅ Bollinger Band expansion → volatility visible
✅ Supertrend in bullish territory
✅ Bollinger Band Squeeze → potential directional move
📊 Volume Analysis
The move was supported by 1.86M volume vs 787.43K (20-SMA) — more than 2× above average.
Such spikes are often studied as signs of institutional participation and momentum strength.
⚠️ Still, follow-through in price action and sustained close above resistance are essential to avoid false breakouts.
📝 STWP Trade Analysis (Educational Illustration Only)
1️⃣ Breakout Illustration
Go Long: 1154/above
Stop Loss (Learning Reference): 1064/below
2️⃣ Conservative Pullback Illustration
Go Long: 1149.80 – 1154 zone
Stop Loss (Learning Reference): 1133/below
3️⃣ Low-Level Pullback Illustration
Go Long: 1145/above
Stop Loss (Learning Reference): 1122/below
(Note: These are structured as learning case studies of how swing setups may be visualized by traders. Not trade calls.)
📌 Summary (Learning View Only)
UNOMINDA provides a good case study in breakout + pullback strategies.
Key lesson: Watch for confirmation above resistance or behavior near pullback zones.
Such structures can be useful when studying swing setups.
Note: A possible breakout with a bullish candle supported by RSI strength and Bollinger Band expansion often signals the start of momentum. However, traders typically wait for volume confirmation and sustained close above resistance to validate the move, as false breakouts are common near key levels.
⚠️ Disclaimer – Please Read Carefully
The information shared here is meant purely for learning and awareness. It is not a buy or sell recommendation and should not be taken as investment advice. I am not a SEBI-registered investment advisor, and all views expressed are based on personal study, chart patterns, and publicly available market data.
Trading — whether in stocks or options — carries risk. Markets can move unexpectedly, and losses can sometimes be larger than the money you have invested. Past performance or past setups do not guarantee future results.
If you are a beginner, treat this as a guide to understand how the market works — practice on paper trades before risking real money. If you are an experienced trader, remember to assess your own risk, position sizing, and strategy suitability before entering any trade.
Consult a SEBI-registered financial advisor before making any real trading decision.
By reading, watching, or engaging with this content, you acknowledge that you take full responsibility for your own trades and investments.
________________________________________
💬 Found this useful?
🔼 Give this post a Boost to help more traders discover clean, structured learning.
✍️ Drop your thoughts, questions, or setups in the comments — let’s grow together!
🔁 Share with fellow traders and beginners to spread awareness.
✅ Follow @simpletradewithpatience for beginner-friendly setups, price action insights & disciplined trading content.
🚀 Stay Calm. Stay Clean. Trade With Patience.
Trade Smart | Learn Zones | Be Self-Reliant 📊
Volumeanalysis

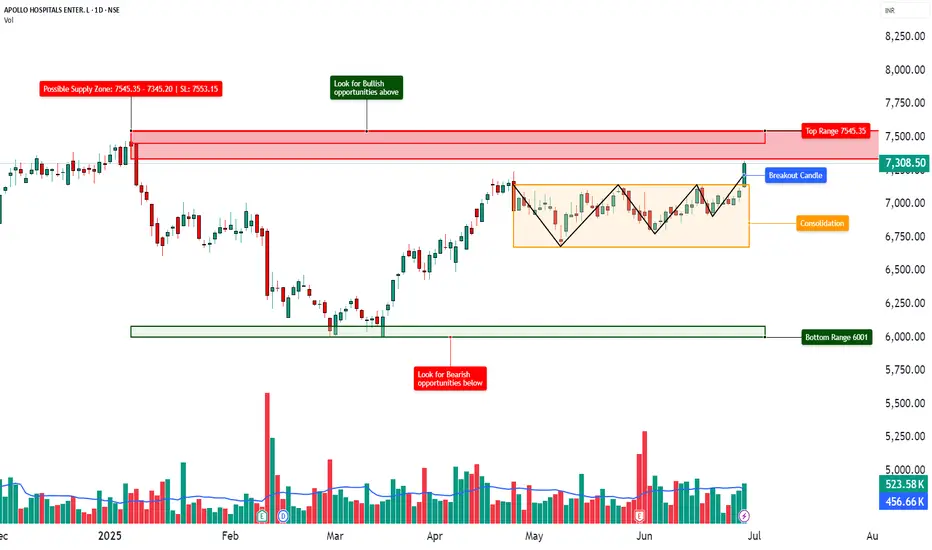
APOLLOHOSP - TECHNICAL ANALYSIS________________________________________________________________________________
📈 Apollo Hospitals Enterprises Ltd. (APOLLOHOSP) – TECHNICAL ANALYSIS
📆 Date: June 28, 2025 | Timeframe: Daily Chart
🔍 For Educational Purposes Only
________________________________________________________________________________
📊 Structure Overview
• Pattern: Rounded "W" Base Breakout
• Breakout Level: ₹7,324
• Current Price: ₹7,308.50 (pullback after breakout)
• Volume: 523.58K vs avg. 456.66K – confirming breakout strength
• Trend Bias: Bullish (as long as price sustains above ₹7,176–₹7,043)
________________________________________________________________________________
📌 Key Zones
🔺 Top Range Resistance: ₹7,545.35
📛 Possible Supply Zone: ₹7,545.35–₹7,345.20 | SL: ₹7,553.15
🟧 Consolidation Zone: ₹6,750–₹7,300
🟩 Demand Support: ₹7,176 / ₹7,043 / ₹6,969
🔻 Bottom Support Range: ₹6,001 (long-term demand base)
Resistance Levels:
• ₹7,382.5
• ₹7,456.5
• ₹7,589.0
Support Levels:
• ₹7,176.0
• ₹7,043.5
• ₹6,969.5
________________________________________________________________________________
🧠 Technical Signals
✔️ Rounded W pattern breakout
✔️ Bollinger Band expansion (BB Squeeze OFF)
✔️ RSI around 62 – showing strength
✔️ SuperTrend & VWAP supportive during breakout
✔️ Sectoral tailwind: Hospitals gaining traction in current market narrative
________________________________________________________________________________
🎯 STWP Educational Trade Plan (For Study Only)
• Entry (Breakout Retest): ₹7,324
• Stop Loss: ₹6,989
• Risk: ₹335/share
• Position Size: 50 shares
• Risk-Reward Ratio: 1:1 | 1:2+
📌 Setup Logic: Volume-backed W Breakout + Consolidation Range Break + Sector Strength
________________________________________________________________________________
⚠️ Cautionary Notes
• Breakdown below ₹7,043 = weakening structure
• If price gets rejected at ₹7,456, sideways action likely
• Always track volume + RSI for divergence signs
________________________________________________________________________________
📢 Disclaimer
This is a study-based chart analysis shared for educational purposes only. It is not a buy/sell recommendation. The author is not SEBI-registered. Please consult a SEBI-registered advisor before making any investment decisions.
________________________________________________________________________________
💬 Your Turn:
Do you think ₹7,545 will break or will price revisit ₹7,000 first?
👇 Drop your view or chart in the comments — let’s grow together!
________________________________________________________________________________
STWP | Learn. Trade. Grow.
________________________________________________________________________________
HINDUSTAN UNILEVER LTD – Technical Analysis________________________________________
🧠 HINDUSTAN UNILEVER LTD – Technical Analysis
Ticker: NSE: HINDUNILVR | Sector: FMCG
Current Price: ₹2,521.20 ▲ (+3.44% on July 31, 2025)
Technical View: ⭐⭐⭐⭐ | Chart Pattern: Volume-Driven Range Breakout
________________________________________
Latest News & Developments
Hindustan Unilever (HUL) reported strong Q1 FY26 results, with standalone net profit rising 7.6% YoY to ₹2,732 crore and consolidated profit up ~6%. Revenue grew ~4–5% YoY, aided by a rural demand rebound and volume-led gains in home care and beauty segments. While demand recovery is still gradual and margin guidance has been trimmed, the company is ramping up investments for future growth. A key structural change includes the demerger of its Kwality Wall’s ice-cream business by FY26-end. Leadership transition is also underway, with Priya Nair set to take over as CEO & MD from August 1, 2025. Shares surged 3.5% on July 31 to ₹2,521.85, outperforming the market.
________________________________________
Technical Analysis & Chart Pattern
Hindustan Unilever Ltd (HUL) has broken out above a key resistance zone of ₹2,440–2,445 on the daily chart, supported by strong volume and a bullish candle. This move ends the prior consolidation phase between ₹2,136–2,602. Momentum indicators such as RSI (~70), MACD, and moving averages show a bullish bias. If the price sustains above ₹2,500, the stock may trend toward resistance levels at ₹2,573, ₹2,625, and ₹2,702. Key support levels lie at ₹2,445, ₹2,368, and ₹2,316.
________________________________________
Trade Analysis (SEBI-Compliant | Educational Purpose Only)
As per the chart structure, the stock has shown a breakout above the ₹2,440–2,450 zone on strong volume, currently near ₹2,521. If momentum sustains, potential price zones to watch are ₹2,575–2,625 in the near term and ₹2,700+ in the medium term. A logical risk level could be around ₹2,395 or near the breakout point of ₹2,440.
________________________________________
Technical & Sentiment Snapshot
The stock recently broke out with strong volume, indicating accumulation post-consolidation. A pullback toward ₹2,440–2,430 may test the breakout zone, while a move to ₹2,360–2,316 could signal range re-entry. Sustained trade above ₹2,500–2,520 may indicate trend continuation. Market participants are watching volume behaviour on dips and potential sentiment shifts under new leadership. Key risks include broader market weakness, margin pressures, and rural/urban demand trends.
________________________________________
Educational Insight for Learners
A classic breakout occurs when a stock trades within a defined range (support and resistance) and then moves sharply beyond that range with strong volume. To identify such setups, observe the range boundaries, wait for a confirmed close outside the range, and ensure volume rises on the breakout. Entry is ideally near the breakout, with a stop just inside the range and targets based on the range height. The recent price action in HUL aligns well with this rectangle breakout concept — a valuable pattern for learners to study.
________________________________________
⚠️ Disclaimer & Educational Note
This content is strictly for educational and research purposes only. I am not a SEBI-registered advisor, and no buy/sell recommendations are being provided. All insights are based on personal analysis and experience and are not financial advice.
📘 This setup illustrates how combining price action (candlesticks), support/resistance zones, volume, and indicators like RSI or MACD can help build conviction in trades. However, trading—especially in derivatives like options—involves high risk, and losses can exceed the initial investment.
👉 Always do your own research and consult a SEBI-registered advisor before taking any position.
👉 Use strict risk management and only trade with capital you can afford to lose.
The author assumes no liability for any losses incurred.
By engaging with this content, you agree to these terms.
________________________________________
💬 Found this helpful?
Drop your thoughts, questions, or insights in the comments below ⬇️ — let’s learn together!
🔁 Share this post with your trading friends and community — help them discover clean charts, structured setups, and zone-based learning.
✅ Follow simpletradewithpatience for clear setups, educational content, and a no-nonsense approach to price action, supply-demand zones, and risk-managed trades.
🚀 Trade with patience. Trust your charts. Stay clear-headed.
Because the goal is not just to trade — it's to trade better.
Be Self-Reliant | Trade with Patience | Learn with Charts & Zones 📊
________________________________________

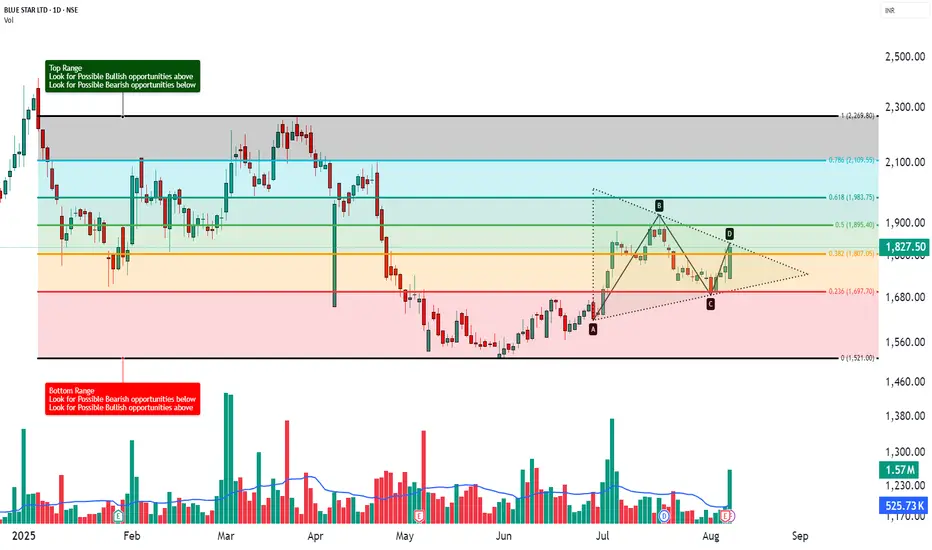
BLUE STAR LTD - Technical Analysis | Triangle Pattern ________________________________________
📊 BLUE STAR LTD – Beginner-Friendly Technical & Fundamental Snapshot
Ticker: NSE:BLUESTARCO | Sector: Consumer Durables
CMP: ₹1,827.50 ▲ (+3.23%) (as of August 7, 2025)
Chart Pattern: Symmetrical Triangle
Technical View: ⭐⭐⭐⭐ Neutral-to-Positive (Educational Purpose Only)
________________________________________
🔍 What’s Happening on the Chart?
BLUE STAR has formed a Symmetrical Triangle – a pattern where price moves within narrowing highs and lows 📉📈
This indicates consolidation and usually results in a strong breakout or breakdown.
📦 Triangle Range: ~₹1,616 to ₹1,922
👉 Current price is testing the upper edge — a breakout could be brewing!
________________________________________
🕯️ Candle & Indicator Analysis (Simplified)
Here’s what the chart and indicators show:
EMA 200 Crossover:
✅ Bullish signal – price is trading above its 200 EMA
RSI (~60):
🔼 Showing strength – not yet overbought
Stochastic (~92):
🚀 Near overbought – buyers in control
MACD:
⚠️ Still bearish – momentum confirmation is pending
VWAP:
✅ Aligned with bullish bias — suggests institutional support
📊 Volume Breakout:
🔺 Volume surged to 1.57 million, almost 3x the average of ~525.73k — a strong sign that big players may be stepping in as price nears breakout levels.
🧠 Trading Insight:
The chart looks bullish but still needs confirmation. Watch for a proper breakout above the triangle with volume.
________________________________________
📰 Recent News & Sentiment Update
Q1 FY26 Results (as of June 30, 2025):
📈 Total Income: ₹2,998.32 Cr (↑ 3.8% YoY)
💰 Net Profit: ₹122.23 Cr
(Source: Company Filings & Analyst Coverage)
Sentiment:
✅ Positive: Modest earnings growth, analyst support
⚠️ Caution: Target cut by some analysts — signals mixed expectations
________________________________________
🧭 Support & Resistance Levels
📌 Resistance Zones (Upside watch):
R1: ₹1,866
R2: ₹1,904
R3: ₹2,112 (measured move target)
📌 Support Zones (Downside watch):
S1: ₹1,750
S2: ₹1,680
S3: ₹1,616 (triangle base)
________________________________________
🔍 How to Trade a Symmetrical Triangle
A symmetrical triangle is a neutral pattern.
The breakout confirms direction:
– Above = potential upside 🟢
– Below = potential downside 🔴
📈 If Bullish Breakout Happens (above ₹1,860):
✅ Wait for a candle close above ₹1,860 with volume
🎯 Possible Price Zones: ₹2,000 → ₹2,165
🛑 Stop Loss: ₹1,750 (below triangle support)
📉 If Bearish Breakdown Happens (below ₹1,680):
✅ Wait for close below ₹1,680
🎯 Possible Price Zones: ₹1,500 → ₹1,375
🛑 Stop Loss: ₹1,750 (above triangle resistance)
________________________________________
🧠 STWP’s Educational Trade Idea (Not a Recommendation)
🎯 Long watch above: ₹1,839
🛑 Stop Loss: ₹1,719.50
📈 Risk-Reward Idea: Minimum 1:1; ideally aim for 1:2+
________________________________________
🔰 Trading Notes
✅ Always use stop losses
⏳ Be patient — wait for confirmation, not assumption
🚫 Don’t chase green candles or panic in red ones
📚 Trade based on structure, not emotions
💼 Risk only 1–2% of your capital per trade
🎯 Target minimum 1:1.5 Risk-to-Reward ratio
________________________________________
⚠️ Disclaimer (Read Carefully)
This post is for educational and informational purposes only.
The author is not a SEBI-registered investment advisor. No buy or sell recommendations are being made.
All views are based on chart patterns, publicly available data, and personal learning experience.
Trading involves risk. Losses can exceed your investment. Always consult a SEBI-registered advisor before making financial decisions.
By engaging with this content, you agree to these terms.
________________________________________
💬 Was this useful?
Drop your thoughts, questions, or setups in the comments below ⬇️ — let’s grow together!
🔁 Share this post with fellow traders and beginners to spread clean, structure-based learning.
✅ Follow simpletradewithpatience for beginner-friendly setups, price action insights, and disciplined trading content.
🚀 Stay Calm. Stay Clean. Trade With Patience.
Trade Smart | Learn Zones | Be Self-Reliant 📊
________________________________________
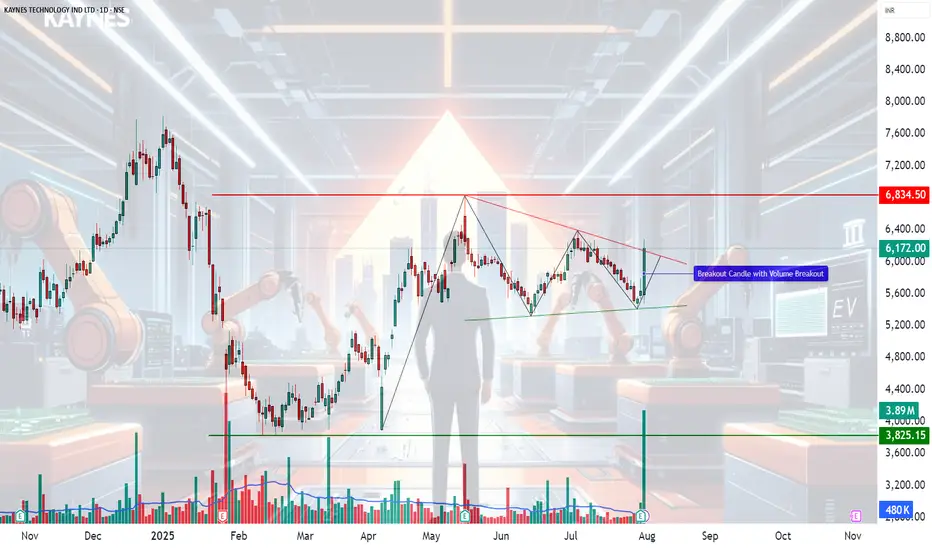
KAYNES TECHNOLOGY IND LTD – Technical Analysis________________________________________
🧠 KAYNES TECHNOLOGY IND LTD – Technical Analysis
Ticker: NSE:KAYNES | Sector: EMS & Semiconductors
Current Price: 6,172.00 ▲ (+9.5% on July 31, 2025)
Technical View: ⭐⭐⭐⭐ | Chart Pattern: Falling Wedge Breakout
________________________________________
📈 Technical Overview
🔹 Chart Pattern Formed: Falling Wedge Breakout with extremely high volume confirmation
🔹 Breakout Zone: 6,000–6,050
🔹 Momentum Signals:
— RSI breakout above 60
— Strong bullish candle with rising volume
— VWAP and SuperTrend aligned bullish
🔹 Support Trendline Held on multiple touchpoints
🔹 Breakout Candle marked by heavy institutional volume
________________________________________
📰 Key Fundamental Developments
✅ Q1 FY26 PAT up ~50% YoY to 74.6 Cr
✅ Gross margin expanded to 41%, EBITDA margin to 16.8%
✅ Strategic acquisitions from Fujitsu (85 Cr domestic + 118 Cr JV with L&T)
✅ Strong order book visibility (~7,400 Cr)
✅ Raised 1,600 Cr via QIP to fund growth
________________________________________
📊 Sentiment Analysis
Sentiment: ✅ Positive
— Strong earnings beat and margin expansion
— Global expansion through Fujitsu JV
— Bullish commentary from major brokerages
— Institutional confidence via QIP and upgrades
________________________________________
🔼 Resistance Levels
6,400 – Immediate breakout target
6,834 – Top of consolidation range
7,285 – Medium-term resistance (historic supply zone)
🔽 Support Levels
5,970 – Breakout retest zone
5,700 – Structure base
5,170 / 4,864 – Deep support for longer-term invalidation
________________________________________
📌 What’s Catching Our Eye
🔹 Volume spike confirms genuine breakout
🔹 RSI, SuperTrend, VWAP – all flashing bullish
🔹 Back-to-back bullish closes after a 10 day contraction breakout
🔹 Volume & price action aligned across multiple timeframes
________________________________________
👀 What We’re Watching For
🔸 Follow-through momentum toward 6,400+
🔸 Whether breakout holds above 5,970 in coming sessions
🔸 Semiconductor line execution progress
🔸 Margin trends in upcoming quarters
________________________________________
⚠️ Risks to Monitor
⚠️ Rich valuations (~130x P/E) – limited room for disappointment
⚠️ Execution risk on new lines and acquisitions
⚠️ Global slowdown in electronics & macro headwinds
⚠️ Any delay in semiconductor segment scale-up
________________________________________
🔮 What to Expect Next
🔹 Retest of breakout zone (~6,000–6,050) possible
🔹 If held, expect momentum toward 6,400–6,800
🔹 Sideways consolidation likely if volumes taper
🔹 Strong close above 6,400 could initiate fresh uptrend leg
________________________________________
📈 Strategy Insight (For Educational Purposes Only)
— Aggressive Traders: Watch level of 6284
— Momentum Traders: Watch 6,050 retest for low-risk entry
— Risk Management: Position sizing + Capital risk – as per individual preference
________________________________________
💬 Why It’s On Our Watchlist
Kaynes blends EMS scale with high-margin ODM design and semiconductor upside. Rare in India’s listed space. Strong revenue visibility, global expansions, and balance sheet strength make it a high-conviction long-term story.
________________________________________
📉 If Price Comes Down…
5,700–5,800 is a critical support zone. Breakdown below this with volume = trend weakness. 5,400 is final demand zone before structural damage.
________________________________________
🪙 Educational Insight for Learners
This chart is a real-world example of a falling wedge breakout confirmed by volume. The key takeaway: price alone is not enough—watch volume, RSI, and structure. Never chase momentum without a plan. Always pair conviction with discipline.
________________________________________
🚨 Reminder: No stock is a “sure thing.” Use proper risk management. Stay rational when others get emotional.
________________________________________
⚠️ Disclaimer (Please Read Carefully):
This content is shared strictly for educational and research purposes only.
I am not a SEBI-registered investment advisor, and no buy or sell recommendations are being made.
All views expressed are based on personal market analysis and experience. They are not intended as financial advice.
Trading — especially in derivatives like options — involves significant financial risk. Losses can exceed your initial investment.
👉 Always do your own research and consult a certified SEBI-registered advisor before making any investment or trading decisions.
👉 Use proper risk management and only trade with capital you can afford to lose.
The author assumes no responsibility or liability for any trading losses incurred from acting on this content.
By engaging with this material, you agree to these terms.
________________________________________
💬 Found this helpful?
Drop your thoughts, questions, or insights in the comments below ⬇️ — let’s learn together!
🔁 Share this post with your trading friends and community — help them discover clean charts, structured setups, and zone-based learning.
✅ Follow simpletradewithpatience for clear setups, educational content, and a no-nonsense approach to price action, supply-demand zones, and risk-managed trades.
🚀 Trade with patience. Trust your charts. Stay clear-headed.
Because the goal is not just to trade — it's to trade better.
Be Self-Reliant | Trade with Patience | Learn with Charts & Zones 📊
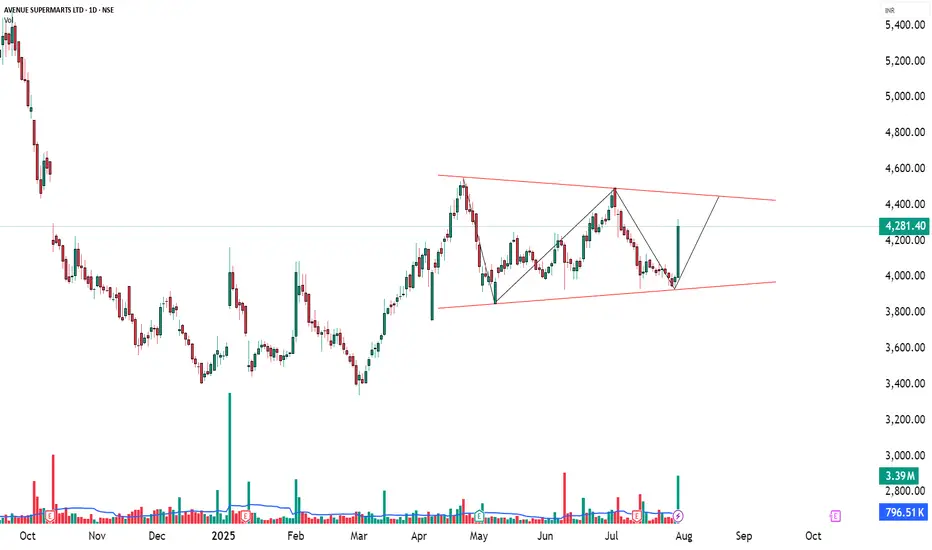
DMART – A Clean Case Study in Patience & Price Action________________________________________
Ticker: NSE: DMART
Sector: Retail – Supermarkets & Hypermarkets
Market Cap: ≈ ₹2.78 lakh crore (approx as of July 30, 2025)
Current Price: ₹4,281.40 (up ~7% on July 30, 2025)
Technical Rating: ⭐⭐⭐⭐⭐
________________________________________
📢 DMart (Avenue Supermarts) Update – July 30, 2025:
If you’re a new investor tracking India’s retail space, DMart just gave us a masterclass in how market sentiment can flip fast — and why fundamentals still matter.
In its Q1 FY26 results, DMart reported a modest 2% profit growth (₹830 cr), despite a solid 16% jump in revenue. This raised concerns among analysts about tight margins and intensifying competition, especially from fast-moving consumer goods (FMCG) and quick-commerce players. Not surprisingly, the stock dipped around 2.6% post-results.
But fast-forward to late July, and the narrative flipped.
On July 30, DMart shares surged 7–8% intraday, marking their biggest rally since March, after announcing the opening of its 426th store and laying out a bold expansion plan. The market cheered the company’s strong growth visibility and confidence in its value-retail model. CEO Neville Noronha emphasized the importance of store additions, digital scaling via DMart Ready, and the company’s resilience in a competitive landscape.
On the digital front, online grocery sales grew 21% YoY to ₹3,502 cr in FY25 — a good sign of consumer shift — though losses widened as DMart expanded into new cities.
What’s the takeaway? For learners, this is a great example of how stocks don’t move just on earnings, but on future guidance, strategy, and investor confidence. DMart may not have wowed with profits this quarter, but its long-term vision still packs a punch.
________________________________________
📉 Technical Analysis | Chart Pattern: Potential Breakout Brewing:
DMART has been consolidating in a symmetrical triangle pattern on the daily chart since April 2025 — a classic setup that often signals a big move ahead. On July 30, the stock showed signs of life with a strong 7% gain and a 5× volume spike, which usually reflects institutional accumulation and rising trader interest.
🔍 But here’s the key insight:
Despite the surge in volume, the price has not yet convincingly broken above the triangle’s upper trendline. This means there’s no valid price breakout yet — only a volume-based alert. For newer traders, this is a great example of why volume alone isn't enough. A true breakout needs a strong candle closing above the pattern, preferably with follow-through buying.
________________________________________
🔼 Key Resistance Levels to Watch:
₹4,403 – Recent swing high and immediate target if breakout confirms
₹4,526 – April top and near-term bullish milestone
₹4,728 – Long-term resistance if momentum builds up post-breakout
🔽 Important Support Levels:
₹4,078 – Breakout support zone and first pullback entry area
₹3,876 – Base of the triangle, also a structural support
₹3,753 – Deeper support, invalidation point if breached
________________________________________
🧭 Strategy Insight for New Traders:
This is a textbook case of a "breakout watchlist" setup. With strong bullish indicators — RSI > 60, MACD crossover, Supertrend flip, and a BB Squeeze breakout setup — the chart is preparing for a move. But confirmation is key.
✅ Wait for a clear breakout above the trendline with sustained volume
✅ Avoid chasing the move too early — breakout traps are common
✅ If the breakout confirms, ₹4,403 and ₹4,526 become logical targets
✅ A retest toward ₹4,080 could offer a low-risk long entry if supported by volume
________________________________________
🧠 Pro Note for Beginners: A breakout isn’t just about price jumping — it’s about structure, confirmation, and follow-through. Think of volume spikes as the "whispers" before the market makes a bold statement.
________________________________________
🔍 Fundamental Analysis:
If you’re just starting out in stock market investing, DMART offers an interesting case study—a well-run retail company with strong fundamentals and a clear growth story. As of July 2025, DMART has shown solid performance, especially in revenue growth, while keeping debt levels incredibly low.
In Q1 FY26, the company posted standalone revenues of ₹15,932 crore—up 16.2% YoY—highlighting strong consumer demand and steady growth momentum. Over the full FY25, consolidated revenue rose nearly 17% YoY, reflecting DMART’s consistent top-line performance. However, while revenues are rising fast, margins have seen slight compression. PAT (net profit) for FY25 stood at ₹2,707 crore with a PAT margin of 4.6%, down from 5% a year earlier.
DMART’s earnings per share (EPS) is growing steadily too—₹41.61 in FY25, up ~7% from last year. But with a price-to-earnings (P/E) ratio of ~96x, the stock trades at a steep premium compared to peers, signaling that the market has high expectations for its future growth.
One of DMART’s biggest strengths is its minimal debt—the company operates with almost zero leverage, giving it exceptional financial flexibility. It also generates healthy free cash flows from its core retail operations, though its online grocery venture (DMart Ready) is still in the investment phase, posting losses as it expands.
From a valuation standpoint, DMART is expensive, no doubt. But investors are paying for its scalability, low-risk model, and disciplined management. With 415 stores across India and consistent quarterly additions, the company continues to grow organically while maintaining a lean balance sheet.
🔔 Bottom Line for Beginners: DMART is a financially strong and well-managed company with proven business fundamentals. But with a very high valuation and slowing profit growth, new investors should be cautious. It may be wise to watch for better entry points or wait for earnings to catch up with the price. For long-term investors with patience and a high-quality bias, it could still be a worthy contender—especially if margins and digital growth improve.
________________________________________
📈 DMART Chart Study – Educational Swing Trade Example:
Disclaimer: This is an educational post intended to help new traders understand breakout setups. This is not a recommendation to buy, sell, or hold any stock or security. Always consult your registered financial advisor before making any trading decisions.
If you're learning how swing trades work, this DMART daily chart setup from July 30, 2025, offers a great example of how price action, volume, and key levels can come together. It’s a practical case study to understand the breakout trading concept.
________________________________________
🛠️ Trade Structure (For Educational Purposes)
Reference Entry Price: ₹4,324.00
Reference Stop Loss: ₹3,925.85
Risk-Reward Scenario: Approx. 1:1, with potential extension to 1:2+ (based on hypothetical higher target)
________________________________________
🔍 Key Chart Observations:
✅ Breakout Candle Formation: A strong bullish candle closed near its high — a typical sign of price strength.
✅ Volume Confirmation: Volume surged to 3.39 million shares, which is over 4× the daily average — often seen in breakout moves.
✅ Price Range Context:
• Support/Base Zone: Around ₹3,340
• Initial Target Zone: ₹4,557.70
________________________________________
📘 Educational Insights:
🔴 Risk-Reward Perspective: At the observed entry level, the risk-to-reward ratio was near 1:1 — not ideal for most strategies. A more efficient trade setup might occur on a pullback or with a more distant target.
🔄 Retest Possibility: If the price retraces to ₹4,150–₹4,200 with lower volume, that zone could serve as a reference for learners exploring re-entry setups (purely for study).
🧠 Capital Risk Planning: Risk management is crucial. Avoid risking more than 2–3% of total trading capital on any single idea, no matter how strong the pattern looks.
________________________________________
📌 Beginner Learning Point:
Breakout trading is more than just chasing big candles. A proper breakout setup usually involves volume surge, clear consolidation range, and defined risk management. Learning to combine these elements is key to developing trading discipline.
________________________________________
🧾 Why I’m Watching DMART — A STWP Perspective for Beginner Investors:
One of the best lessons I’ve learned in my investing journey is this: It’s better to buy a great business at a fair price than a fair business at a great price. And when I look at DMART (Avenue Supermarts Ltd.), I see the foundation of a truly great business — even if the price isn’t quite right just yet.
________________________________________
🛒 A Business Anyone Can Understand:
DMART isn’t chasing trends or building flashy tech. It’s focused on something much simpler — and far more reliable: selling everyday essentials. Groceries, home goods, basics — the things people need no matter what. And they do it efficiently, consistently, and affordably. That simplicity, when executed well, is a major strength.
________________________________________
🧱 A Strong, Repeatable Model:
What really impresses me is their cost discipline. DMART owns many of its stores, keeping rental costs low. They avoid unnecessary frills and instead focus on efficiency and tight operations. The result? A cost advantage that’s tough for others to beat. Even though retail has thin margins, DMART’s model is scalable, profitable, and built for the long haul.
________________________________________
👨💼 Led by a Trusted Name:
The company is backed by Radhakishan Damani — a man known for his patience, clarity, and capital discipline. He’s not in a rush to make headlines. He’s building something durable. And when you find great leadership combined with a focused business model, that’s a rare combo worth watching.
________________________________________
📉 Why This Stock Is on My Watchlist?
In one word: Valuation.
DMART often trades at 80–100 times earnings — which is expensive, even for a wonderful business. As an investor, I’d rather wait for a better deal than rush in and overpay. Great businesses can still turn into poor investments if you don’t get the price right. So for now, I’m staying patient.
________________________________________
📈 If the Price Comes Down…
If the market turns pessimistic or earnings grow into the valuation, DMART will be high on my buy list. Here’s why:
✅ A clean, debt-light balance sheet
✅ A brand people trust
✅ A scalable, cost-efficient model
✅ A long growth runway in India’s retail sector
✅ And thoughtful, no-drama leadership
________________________________________
🪙 Final Thought for New Investors:
As Warren Buffett says, “Time is the friend of the wonderful company and the enemy of the mediocre.”
DMART, in my view, is a wonderful company. I’d love to own it — but only when the price is right. Until then, I’ll keep watching, learning, and staying patient.
(Of course, one could consider buying a small quantity now and adding more on dips — a strategy that balances quality with prudence.)
________________________________________
⚠️ Disclaimer (Please Read Carefully):
This content is shared strictly for educational and research purposes only.
I am not a SEBI-registered investment advisor, and no buy or sell recommendations are being made.
All views expressed are based on personal market analysis and experience. They are not intended as financial advice.
Trading — especially in derivatives like options — involves significant financial risk. Losses can exceed your initial investment.
👉 Always do your own research and consult a certified SEBI-registered advisor before making any investment or trading decisions.
👉 Use proper risk management and only trade with capital you can afford to lose.
The author assumes no responsibility or liability for any trading losses incurred from acting on this content.
By engaging with this material, you agree to these terms.
________________________________________
💬 Found this helpful?
Drop your thoughts, questions, or insights in the comments below ⬇️ — let’s learn together!
🔁 Share this post with your trading friends and community — help them discover clean charts, structured setups, and zone-based learning.
✅ Follow @simpletradewithpatience for clear setups, educational content, and a no-nonsense approach to price action, supply-demand zones, and risk-managed trades.
🚀 Trade with patience. Trust your charts. Stay clear-headed.
Because the goal is not just to trade — it's to trade better.
Be Self-Reliant | Trade with Patience | Learn with Charts & Zones 📊
PAYTM, BIG BULLISH BREAKOUT HAPPENINGPaytm, one9 communication 1065, has given highest weekly closing in last 30 months. Stock ready for 1250/1320/1450/1600.
Good horizontal trendline resistance taken out at 1020 levels. Volumes are supportive
Trade negates if closed below 940 levels on weekly closing basis. Bigger Stop at 860 levels.

APCOTEX, RECOVERY ON CARDSAPCOTEX IND 419, gathering momentum supported by volumes. All leading and lagging indicators turning positive. target can be 440 to 530 in short to medium term.
Stock has surpassed 200wema with volumes today.
Trade invalid below 382 on closing basis.

PAYTM READY FOR BIG BULL RUNPaytm, one9 communication 1065, has given highest weekly closing in last 30 months. Stock ready for 1250/1320/1450/1600/1800
Good horizontal trendline resistance taken out at 1020 levels. Volumes are supportive
Trade negates if closed below 940 levels on weekly closing basis. Bigger stop at 860 levels.

KIRLOSBROS – A Demand-Supply Sweet Spot? My Take!🔍 What Got My Attention
We’re seeing price approach a well-formed Rally-Base-Rally demand zone, and to me, it’s got the fingerprint of institutional activity written all over it. These zones don’t just appear randomly—this kind of structure often suggests that big players may have unfinished business here, footprint of pending orders.
📐 The Demand-Supply View
Price is entering a daily demand zone —a clean RBR structure .
Just yesterday, we saw a bullish reaction candle form right off that zone. For a demand-supply trader, that’s confirmation—plain and simple.
Stop-loss placement? : just below the demand zone. And the logical target? The next known supply zone on the chart.
What’s more, the weekly chart already confirmed strength. Price bounced from weekly demand zone and powered through a traditional daily resistance—clear signs of momentum shift.
Encouragingly, there's no higher-timeframe supply standing in the way. That clears the runway.
From a demand-supply lens, this is the kind of setup we wait for—strong zone, confirmation signal, no conflicting zones above. It’s not about chasing; it’s about reacting when price comes to us.
📈 What Traditional Technical Are Saying 📈
Now, if we set aside the supply-demand lens for a moment and look at it through a more traditional view, things still line up nicely.
stock was clearly in a downtrend earlier—but that changed when it hit the weekly demand zone or say support area and reversed with strength.
What followed was a period of consolidation. That’s normal—markets pause before deciding on direction.
Then, on June 25th, the trend shifted. Price broke out above both horizontal resistance and a sloping downtrend line— and it did so with volume.
This wasn’t a fake breakout either. Price held above the resistance.
The current pullback? Honestly, it's healthy. After a move up, a dip into support (especially when it lines up with demand) often builds the base for the next leg higher.
And guess what—price is taking support from 20 EMA, which just adds to the confluence.
So even if you’re not a die-hard supply-demand trader, the technicals are telling a similar story: breakout, volume, support holding, pullback into structure—it all points toward potential continuation.
🧠 Why This Setup Stands Out 🧠
What I find compelling here is the alignment across both schools of thought which is not necessary but whether you're supply demand trader or tracking breakouts, both giving positive signal.
It's the kind of scenario where you don’t need to overcomplicate things. You’ve got:
Structure that makes sense.
Clear reaction at a proven level.
No HTF supply zone to kill the momentum.
Now, does that mean it's guaranteed to rip higher? Of course not. But when technical logics all align—this is where probability starts leaning in your favor.
🚀 Fuel for Your Trading Mindset 🚀
"You don’t need to catch every move. You just need to position yourself where risk is small and the story makes sense. 🎯"
📌 Disclaimer 📌
This analysis is shared strictly for educational purposes . It is not a recommendation to buy or sell any security. I am not a SEBI registered analyst .
Lastly, thank you for your support, your likes & comments. Feel free to ask if you have questions.

EIEL: The Anatomy of a Textbook Turnaround PlayToday, we're going to dissect the anatomy of the EIEL chart. What we have here isn't just a random series of candlesticks; it's a compelling case study in how a stock structurally transitions from a deep downtrend to a potential new path upward. It's a classic story, and the clues have been laid out for us to follow.
Every now and then, a chart comes along that tells a crystal-clear story. It’s not about predicting the future with certainty, but about recognizing a classic pattern of behavior. In my opinion, EIEL is painting one of those pictures right now—a powerful narrative of a stock transitioning from a brutal downtrend to a new, potential uptrend.
Let’s break down the key chapters of this story.
Chapter 1: The Foundation (March - May 2025)
After a long and painful decline, the selling finally exhausted itself. The stock didn’t just stop falling; it went into a deep slumber, trading sideways in a well-defined range.
The Accumulation Zone: This is where the smart money went to work. For three months, while the stock looked boring to most, the volume completely evaporated. This wasn't a sign of disinterest; it was the tell-tale sign of accumulation. Big players were quietly absorbing shares from the last of the weak hands.
The Bedrock Support: The absolute floor for this entire structure was established at 188 . This is the level where buyers showed up with absolute resolve.
Chapter 2: The Ignition (Late May 2025)
After months of quiet, the market made its move. The stock ignited, blasting through the ceiling of its trading range at 232 .
This wasn't just a breakout; it was a statement of intent, backed by a massive surge in volume. That's the kind of power that signals a genuine change in character for a stock.
Chapter 3: The Confirmation & The Coil (June - Present)
This is where the story gets really interesting, and it’s what makes the current setup so compelling. After the powerful breakout, the stock pulled back to re-test the old resistance level.
It wasn't a perfect, clean kiss of support. It dipped slightly below 232 in a classic "shakeout" maneuver, designed to scare traders out of their positions before the real move. The fast and aggressive recovery from that dip is incredibly bullish—it confirmed that the old ceiling is now the new floor.
So, where do we stand now?
The Box: The price is currently coiling in a very tight consolidation box, building energy for its next move. The floor of this box is our key support at 232 , and the lid is the immediate resistance at 252 .
The Volume Story: Just like in the initial accumulation phase, the volume has gone quiet again during this consolidation. This tells us there's very little selling pressure. The stock is simply resting.
🎯 The Game Plan 🎯
Based on this price action, the thesis is straightforwardly bullish. The stock has done all the heavy lifting of building a base and has confirmed its strength.
The Trigger: A decisive close above the lid of the box at 252 would be the signal that this consolidation is over and the next leg up is beginning.
The First Target: The initial objective would be a re-test of the post-breakout high at 268 . A move through that level would open the door to significantly more upside.
The Invalidation Point: A trade is only as good as its risk management. The bullish thesis remains fully intact as long as the price holds above the key support at 232 . A close below this level would signal that the breakout has failed and would be a reason to step aside.
This is a classic setup that rewards patience. The structure is sound, the volume confirms the price action, and the risk is clearly defined. Keep a close eye on that 252 level.
Disclaimer: This is my personal analysis and is for educational purposes only. It is not financial advice. Please conduct your own due diligence before making any trading decisions.

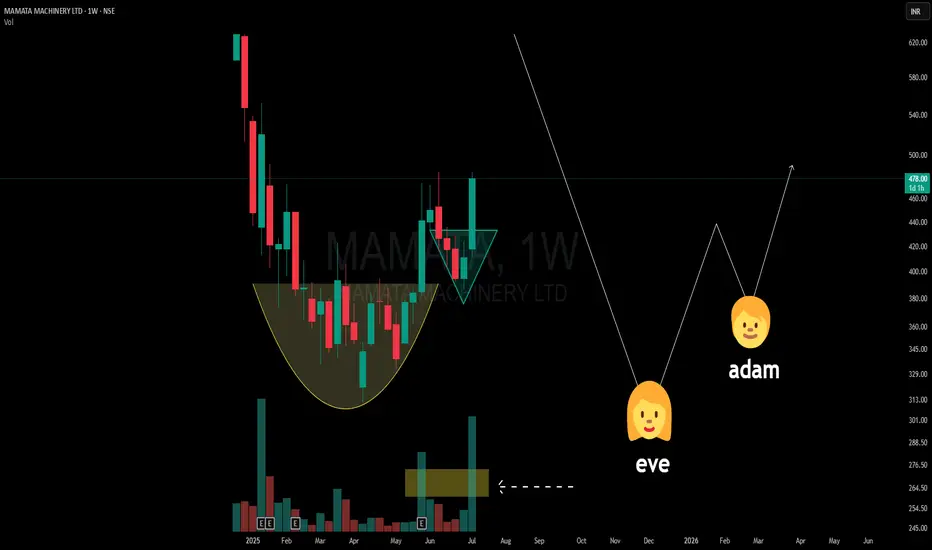
Eve-Adam Pattern Forming? A Rare Double Bottom Pattern Explained📉 Pattern Study (Not a Buy/Sell Tip/Not Forecasting anything)
On the weekly chart of Mamata Machinery Ltd, we’re potentially witnessing a classic yet uncommon pattern — the Eve-Adam Double Bottom.
🔍 What is the Eve-Adam pattern?
🧑🦰 Eve Bottom: Broad, rounded, and forms slowly with increased volume — showing gradual accumulation.
👦 Adam Bottom: Sharp, V-shaped recovery with relatively lower volume — a quick retest signaling renewed demand.
📈 What makes this setup notable?
-A clear Eve structure formed over several weeks.
-Volume started rising visibly into the breakout, especially during the right-side thrust.
-A possible Adam leg is being projected based on the symmetry of the pattern.
🟡 Additionally, a rounding base / cup-like structure preceded this, which may act as a broader accumulation phase.
🔄 This isn’t a forecast or trade call. It’s simply a chart observation intended for pattern study and educational analysis.
📚 Patterns like these are rare — but when supported by volume confirmation, they deserve attention from a learning standpoint.
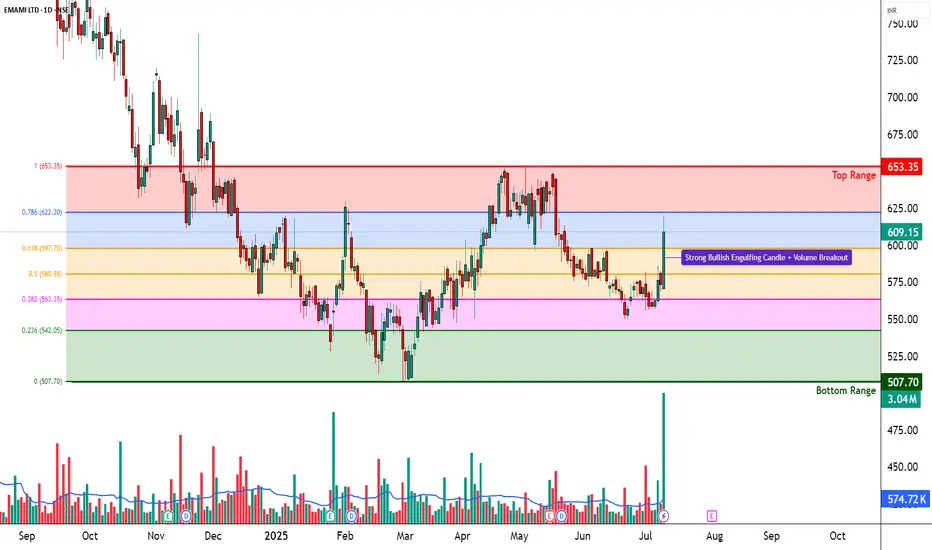
EMAMI LTD – Strong Bullish Breakout | Volume Spike________________________________________________________________________________
📈 EMAMI LTD – Strong Bullish Breakout | Volume Spike | Structure-Based Trade Idea
🕒 Chart Type: Daily Chart
📆 Date: July 9, 2025
________________________________________________________________________________
📌 Price Action:
EMAMI LTD has delivered a decisive breakout from its recent compression phase after trading sideways between 570–585 for several sessions. On July 9, the stock posted a wide-range bullish candle, closing at 609.15, backed by high delivery and breakout volume. The candle formed with an open = low structure, a strong intraday move, and solid closing near the high, confirming buyer dominance. This marks a shift in control from range-bound consolidation to potential momentum continuation.
________________________________________________________________________________
📊 Chart Pattern:
This breakout is from a Box Compression Zone, where the stock had been moving within a tight band. This is a textbook bullish compression breakout, often seen before short-term trend expansions. The range contraction, followed by a sudden expansion with volume, signals that smart money may be entering. Though not a VCP, the narrowing of ranges followed by a strong candle reflects controlled buildup and release of bullish pressure.
________________________________________________________________________________
🕯️ Candlestick Pattern:
Bullish Engulfing
Open = Low Candle
Momentum Continuation Candle
The current candle also fits the "Buy Today, Sell Tomorrow" setup logic, especially useful for short-term intraday/momentum traders from an educational lens.
________________________________________________________________________________
🔊 Volume Analysis:
Volume on July 9 crossed 3x the 20-day average, showing an institutional-grade breakout. What's more important is that this move comes after multiple low-volume sessions, which indicates that the base was silent before this burst — classic sign of accumulation followed by breakout. The presence of a BB squeeze and volume compression breakout confirms the start of a volatility expansion phase.
________________________________________________________________________________
📈 Technical Indicators:
RSI (Daily): 65 – strong and rising
MACD: Bullish crossover on Daily, but flat on Weekly/Monthly
CCI: 319 – strong bullish momentum reading
Stochastic: 85 – in a bullish zone, showing follow-through possibility
SuperTrend & VWAP: Bullish bias confirmed
BB Squeeze: Compression off, likely start of expansion
These indicators align well to show a breakout backed by momentum and volume expansion.
________________________________________________________________________________
🧱 Support & Resistance:
🔺 Resistance Zones to Watch:
629.23 – First key level where supply may come in
649.32 – Major resistance from previous swing
678.63 – Long-term resistance zone
Top Range: 653.35 – Official top of the recent consolidation base
🔻 Support Levels:
579.83 – Immediate support post-breakout
550.52 – Minor swing base
530.43 – Deeper demand level from which recent trend started
Bottom Range (Demand Zone): 507.70 – Long-term structural support
________________________________________________________________________________
👀 What’s Catching Our Eye:
What stands out in this chart is the confluence of breakout signals — RSI breakout, engulfing candle, Bollinger squeeze off, and high delivery volume — all firing together. The open-low bullish bar is not just random price movement; it's a statement from buyers that they're ready to defend this zone.
________________________________________________________________________________
🔍 What We’re Watching For:
We’re watching if EMAMI can sustain above 609–620 for the next couple of sessions. A consolidation above this zone will indicate strength. On the flip side, any rejection and close back below 579.83 will raise flags. We're also watching for any mild retest toward 580–585 on low volume, which can offer a secondary low-risk entry opportunity.
________________________________________________________________________________
✅ Best Buy Level for Equity (Low Risk Idea):
Breakout Entry: Above 620 with follow-through or retest confirmation
Pullback Buy: Into the 579.83–585 support zone with a strong bounce candle
Stop Loss: 560.33 (structure-based, on closing basis)
Risk-Reward Lens: Start with a 1:1 target; trail for 1:2+ based on structure — avoid fixed upside projections
________________________________________________________________________________
💼 Sector Tailwinds:
The FMCG and personal care space is seeing renewed demand due to rising rural consumption, price stability in raw materials, and stronger brand-led companies gaining market share. EMAMI, with a wide product portfolio, is well-positioned to benefit. Fundamentally, the stock is also recovering from long-term price compression — aligning well with the recent breakout.
________________________________________________________________________________
⚠️ Risk to Watch:
A close below 579 will invalidate the breakout setup
Indicators are strong but slightly stretched, so chasing blindly can invite volatility
The price must confirm above 620+ for the trend to gain broader legs
Always wait for follow-through before committing fresh capital
________________________________________________________________________________
🔮 What to Expect Next:
If EMAMI sustains above 609–620, the stock could gradually move toward 629.23 and test higher levels like 649.32. But if it fails to hold above the breakout candle, we may see a pullback to 580–585. Either way, price and volume in the next 2–3 sessions will confirm whether this is a false breakout or the start of a real trend.
________________________________________________________________________________
🧠 How to Trade EMAMI LTD (For Educational Use Only):
Breakout Plan (Hypothetical Setup):
🔹 Entry: Above 620 only if follow-through confirmation candle appears
🔹 Stop Loss: 560.33 (on closing basis)
🔹 Pullback Buy: Into 580–585 with same SL, if bullish reversal shows
🔹 Risk-Reward: 1:1 minimum; trail for more
🔹 Position Sizing: Use capital allocation based on risk tolerance — never go all-in on breakout
________________________________________________________________________________
⚠️ Disclaimer (Please Read):
• This chart is shared for educational purposes only and is not investment advice.
• I am not a SEBI-registered advisor.
• The information provided here is based on personal market observation.
• No buy/sell recommendations are being made.
• Please do your own research or consult a registered financial advisor before making any trading decisions.
• Trading involves risk. Always use proper risk management.
________________________________________________________________________________
💬 Found this helpful?
What would be your ideal trade in EMAMI — breakout follow-through or support pullback?
Drop your thoughts in the comments below ⬇️
🔁 Share this with your trading community
✅ Follow STWP for clean technical setups backed by price action and volume
🚀 Let’s trade with patience, logic, and clarity!
Be Self-Reliant | Trade with Patience | Learn with Logic
________________________________________________________________________________
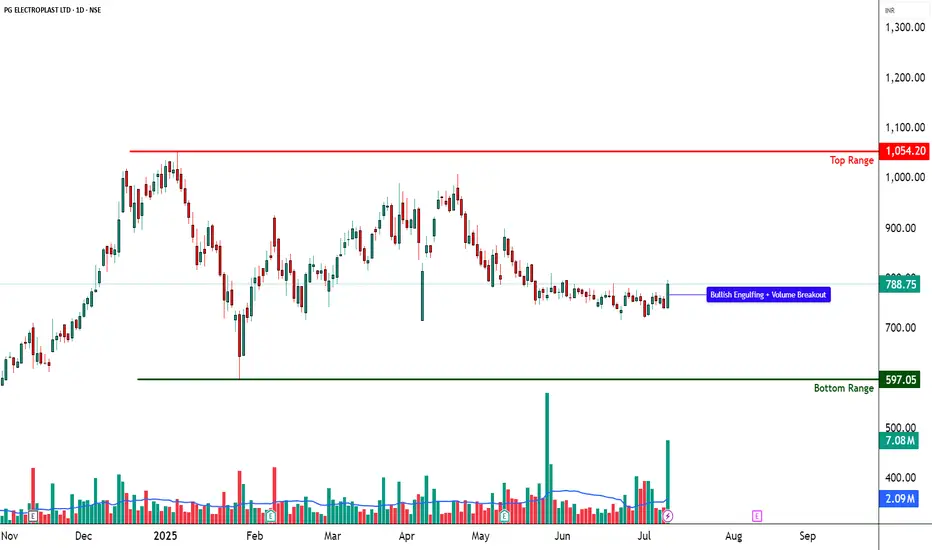
PG ELECTROPLAST – Volume Breakout from Tight Base________________________________________________________________________________
📈 PG ELECTROPLAST – Volume Breakout from Tight Base | Bullish Momentum Brewing
🕒 Chart Type: Daily Chart
📆 Date: July 9, 2025
________________________________________________________________________________
📌 Price Action:
PG ELECTROPLAST LTD has shown an impressive breakout from a tight base, rising from the 735–755 congestion zone with a wide-range bullish candle on July 9. The candle had an open = low structure, closed near the high, and was backed by massive volume. This signals clear buying strength and suggests that bulls are stepping in after a period of low volatility and sideways movement. The stock had been trading in a narrow band and has now broken out with strong conviction, hinting at the beginning of a possible trend reversal or a short-term momentum rally.
________________________________________________________________________________
📊 Chart Pattern:
The chart displays a tight base breakout from a multi-week compression zone. While not a textbook wedge or flag, the narrowing range combined with flat moving averages suggested the stock was coiling up for a move. The breakout candle pierced the upper end of the range, with volume confirming that it wasn't a false push. This kind of price behaviour often leads to trend expansion — especially when confirmed by broader volume activity.
________________________________________________________________________________
🕯️ Candlestick Pattern:
Bullish Engulfing Candle
Open = Low Structure
Strong Bullish Range Candle
This combination, particularly when seen after a base, is a strong signal of fresh buying interest. It also fits the “Buy Today, Sell Tomorrow” short-term momentum logic, especially for educational model trades.
________________________________________________________________________________
🔊 Volume Analysis:
The breakout was supported by a 10-day volume breakout, with volumes spiking over 3x the average. This is not just intraday noise — it reflects strong delivery participation and genuine interest. Volume spike at breakout is a key sign of smart money involvement. Moreover, the spike occurred from a compressed base, which adds further weight to the strength of the breakout.
________________________________________________________________________________
📈 Technical Indicators:
RSI (Daily): 56 — rising from neutral territory, not yet overbought
MACD: Bullish crossover active on Daily & Monthly
Stochastic: 90 on Daily – indicates strong upward momentum
CCI: 155 – overbought but in a bullish continuation zone
Bollinger Bands: Price broke out of a tight squeeze zone — start of volatility expansion phase
BB Squeeze + Bullish VWAP: Adds confirmation that the trend is beginning to expand
________________________________________________________________________________
🧱 Support & Resistance:
🔺 Resistance Levels:
810.43 – First resistance to watch above current price
832.12 – Prior swing level; price may pause or consolidate here if momentum continues
867.33 – Longer-term resistance zone, marked as a level of interest
Top Range: 1054.2 – Long-term weak resistance zone that triggered the previous major selloff
🔻 Support Levels:
753.53 – Closest support below breakout
718.32 – Well-tested swing level; acted as floor in recent range
696.63 – Important structural support
Bottom Range (Demand Zone): 597.05 – Major long-term support, last zone from where price rallied strongly
________________________________________________________________________________
👀 What’s Catching Our Eye:
The combination of price compression, bullish engulfing breakout, and high volume participation makes this setup stand out. Volume is not just high — it’s clean and backed by structure. The candle formation, RSI breakout, and BB squeeze all come together, creating a powerful setup for momentum continuation. This kind of alignment is rare and usually signals smart money entry.
________________________________________________________________________________
🔍 What We’re Watching For:
The most critical zone is the 796.90 breakout level. If price sustains above it for the next couple of sessions, the structure remains intact. We’re also watching for a possible retest toward the 753–755 zone — if the stock pulls back there on low volume and bounces again, it may offer a low-risk entry setup. Continuation beyond 810 could build momentum, but we will rely on risk-reward and price behaviour — not predictions.
________________________________________________________________________________
✅ Best Buy Level for Equity (Low Risk Idea):
Breakout Entry: Above 796.90, only on follow-through or sustained closing above breakout zone
Pullback Entry: Into the 753.53–755 support zone if the price stabilizes and shows a bullish reversal
Stop Loss: Structure-based, below 736.95 (on closing basis)
Risk-Reward Thinking: Look for 1:1 initially, then trail the stop as the move develops; no fixed projections — price action will guide the outcome
________________________________________________________________________________
💼 Sector Tailwinds:
PG ELECTROPLAST operates in the electronics and contract manufacturing sector — two spaces getting a major boost from PLI schemes, China+1 shift, and rising domestic demand. India’s push toward import substitution, rising middle-class consumption, and government incentives are all helping businesses like PG scale up. This provides a strong macro tailwind to any technical strength seen on charts.
________________________________________________________________________________
⚠️ Risk to Watch:
If price slips back below 753, the breakout weakens
A close below 736.95 negates the breakout setup and could invite selling pressure
Indicators are showing strength, but slightly stretched — so expect volatility and avoid over positioning
Never trade based only on breakout excitement — always wait for confirmation and manage risk first
________________________________________________________________________________
🔮 What to Expect Next:
If the price holds above 796.90, the path toward 810.43 may open up quickly. Sustained volume and consolidation near highs would indicate strength, while sharp rejection could signal a trap. A minor pullback to support zones (753–755) could offer a second opportunity if structure holds. The next few candles will tell us whether this breakout becomes a trend or just a temporary spike.
________________________________________________________________________________
🧠 How to Trade PG ELECTROPLAST (For Educational Use Only):
Breakout Plan (Hypothetical):
🔹 Entry: Above 796.90 (only if price sustains)
🔹 Stop Loss: 736.95 (closing basis; risk-controlled)
🔹 Trade Logic: Use position sizing as per capital and SL distance
🔹 Risk-Reward: Look for 1:1 minimum, trail for 1:2+ if structure expands — don’t fix targets, let the chart lead
🔹 Pullback Buy: Into 753–755 zone with same SL (if structure supports)
________________________________________________________________________________
⚠️ Disclaimer (Please Read):
• This chart is shared for educational purposes only and is not investment advice.
• I am not a SEBI-registered advisor.
• The information provided here is based on personal market observation.
• No buy/sell recommendations are being made.
• Please do your own research or consult a registered financial advisor before making any trading decisions.
• Trading involves risk. Always use proper risk management.
________________________________________________________________________________
💬 Found this helpful?
Where would you look for a trade in PG — breakout follow-through or pullback into the support zone?
Share your thoughts or questions in the comments ⬇️
🔁 Share this with your trading community
✅ Follow STWP for clean technical setups backed by price action and volume
🚀 Let’s trade with patience, logic, and clarity!
Be Self-Reliant | Trade with Patience | Learn with Logic
________________________________________________________________________________
ASIAN PAINTS LTD – Gap Fill Setup Near Resistance | Price Action________________________________________________________________________________📈 ASIAN PAINTS LTD – Gap Fill Setup Near Resistance | Price Action Analysis
🕒 Chart Type: Daily (1D)
________________________________________________________________________________
🔍 What’s Catching Our Eye:
Price is testing a major resistance with a gap still left to be filled above.
________________________________________________________________________________
📌 What We’re Watching For:
A breakout above 2491 or a reversal from the resistance zone.
________________________________________________________________________________
📊 Volume Footprint:
Breakout occurred on slightly lower volume – caution advised.
________________________________________________________________________________
🔁 Trend Bias:
Short-term bullish with breakout momentum in play.
________________________________________________________________________________
🧠 Trade Logic / Reasoning:
Strong bullish candle with BB breakout and VWAP support suggest strength.
________________________________________________________________________________
📍 Important Levels to Mark:
Key zones are 2491 (Top) and 2124.75 (Bottom) for breakout or bounce setups.
________________________________________________________________________________
🎯 Trade Plan (Educational Purpose Only):
Best Buy:
Above 2491 on retest with volume; or near 2451–2419 with bullish reversal.
________________________________________________________________________________
Best Sell:
Below 2451 with rejection confirmation; or near 2520 if breakout fails.
________________________________________________________________________________
Demand Zone / Supply Zone: NA
________________________________________________________________________________
⚠️ Invalidation Below:
Breakdown below 2435 would invalidate current bullish bias.
________________________________________________________________________________
⚠️ Disclaimer:
This analysis is for educational purposes only.
STWP is not a SEBI-registered advisor.
No buy/sell recommendations are made.
Please consult your financial advisor before trading.
STWP is not responsible for trading decisions based on this post.
________________________________________________________________________________
💬 Found this helpful?
Will Asian Paints Breakout or Fakeout
Share your thoughts in the comments ⬇️
🔁 Spread the insight with fellow traders
✅ Follow STWP for smart technical setups backed by volume and price action
🚀 Let’s trade with patience, logic, and clarity!
Be Self-Reliant | Trade with Patience | Learn with Logic
________________________________________________________________________________

HDFCBANK – Heavy Call Writing Near 2000 Zone________________________________________
📈 HDFCBANK – Heavy Call Writing Near 2000 Zone | OI + Price Action Analysis
🕒 Chart Type: 15-Minute
📆 Date: July 7, 2025
________________________________________
🔍 What’s Catching Our Eye:
HDFCBANK closed at ₹1987.4, and the entire Call side from ₹1980 to ₹2100 is showing strong Short Build-Up, clearly suggesting resistance building up ahead, especially around ₹2000–₹2040 levels.
Meanwhile, Put side shows Long Unwinding at ₹2000 PE, suggesting lack of bullish confidence at current levels.
________________________________________
📌 What We’re Watching For:
Watch the zone between ₹2004.70 – ₹2007.90 very closely – it’s a visible Supply Zone based on price rejection + heavy CE OI.
If HDFCBANK fails to break and sustain above ₹2009.30 (SL), bears may take control again and drive it back to ₹1980 or below.
________________________________________
📊 Volume Footprint:
Heavy CE volumes hint at active resistance:
• ₹2000 CE – 9.3k+ contracts
• ₹2060 CE – 7.8k+ contracts
• ₹2020 CE & ₹2040 CE – ~5.6k contracts each
→ Strong presence of Call writers near current levels, pressuring the upside.
________________________________________
📈 Option Chain Highlights:
Calls (Short Build-Up):
• ₹2000 CE: +1,93,600 OI | Price ↓ 8.87%
• ₹2060 CE: +10,04,300 OI | Price ↓ 16.67% ✅ Major resistance buildup
• ₹2020 CE: +6,90,800 OI | Price ↓ 11.42%
• ₹2040 CE: +5,83,550 OI | Price ↓ 15.13%
• ₹1980 CE: +2,17,800 OI | Price ↓ 6.44%
• ₹2100 CE: +2,00,200 OI | Price ↓ 17.76%
Puts:
• ₹2000 PE: -84,150 OI | Price ↓ 0.87% → Long Unwinding = Bullish weakness
• ₹1980 PE: +6,050 OI | Price ↓ 2.33% → Weak Short Build-Up
📌 Inference:
Call writers are dominating the entire upper side. There’s no strong Put writing, and PE writers are exiting positions at ATM — this confirms limited bullish conviction.
________________________________________
🔁 Trend Bias:
🔴 Bearish to Range-Bound – unless ₹2009.30 gets taken out on closing basis
________________________________________
🧠 Trade Logic / Reasoning:
• Heavy Short Build-Up in all major CE strikes
• Lack of Put writing near spot
• Supply Zone aligning perfectly with Option Chain resistance
→ Expect rejection or pause unless strong buyers break ₹2009.30 with volume.
________________________________________
📍 Important Levels to Mark:
🔺 Top Range (Resistance): ₹2008
🔻 Bottom Range (Support): ₹1980
________________________________________
🎯 Trade Plan (Educational Purpose Only):
✅ Best Buy (Equity): Above ₹2009.30 with a bullish candle and volume
✅ Best Sell (Equity): Below ₹2004.70 for quick move to ₹1980
✅ Best CE to Long: None – CE side is under Short Build-Up
✅ Best PE to Long: ₹1980 PE if price starts rejecting ₹2000 zone again
🟢 Demand Zone: ₹1965 – ₹1980 (Intraday Bounce Possible)
🔴 Supply Zone: ₹2004.70 – ₹2007.90 (SL: ₹2009.30)
⚠️ Invalidation Levels (With Logic):
🔻 Bullish View Invalid Below: ₹1980 – breaks structure and confirms weakness
🔺 Bearish View Invalid Above: ₹2009.30 – a breakout above this level with volume + PE Short Build-Up will invalidate bearish trades
________________________________________
⚠️ Disclaimer:
This analysis is for educational purposes only.
STWP is not a SEBI-registered advisor.
No buy/sell recommendations are made.
Please consult your financial advisor before trading.
STWP is not responsible for trading decisions based on this post.
________________________________________
💬 Rejection from ₹2000 or breakout above ₹2009?
What’s your view on HDFCBANK? Comment below ⬇️
🔁 Share this if you're tracking the zone
✅ Follow STWP for clean Price Action + OI Trades
🚀 Let’s trade with clarity and confidence!
________________________________________

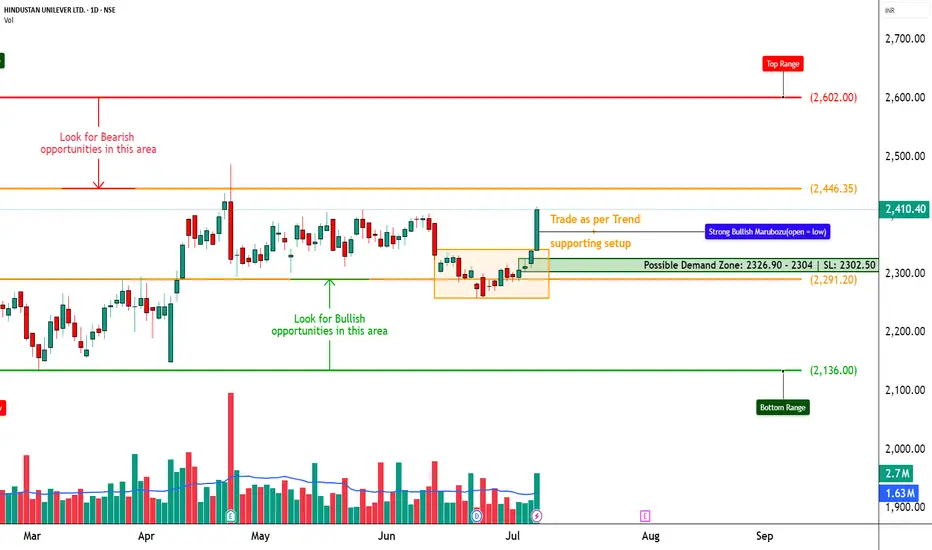
HINDUNILVR – TECHNICAL ANALYSIS________________________________________
📈 HINDUNILVR – TECHNICAL ANALYSIS
📆 Date: July 8, 2025 | ⏱ Timeframe: Daily Chart
🔍 Educational Breakdown – For Learning & Study Use Only
________________________________________
🔹 Price Action Zones
• 🔴 Top Range: 2602
• Resistance: 2437.07 – 2463.73 – 2511.77
• 🟢 Bottom Range: 2136
• Support: 2287.67 – 2314.33 – 2362.37
________________________________________
🔹 Chart Pattern: ✅ Bullish Marubozu Breakout
Price bounced from a demand zone near 2326.90 – 2304| SL: 2302.50 with a powerful Marubozu candle and reclaimed structure strength. This breakout aligns with STWP’s HNI setup and suggests the beginning of a strong bullish leg.
________________________________________
🔹 Reversal Candlestick Patterns:
✅ Bullish Marubozu
✅ Strong follow-through near support
✅ High conviction breakout from base – Open = Low
________________________________________
🔹 Volume Footprint:
✅ Volume spiked to 2.7M (vs average 1.63M)
✅ Indicates institutional participation backing the breakout
🚨 Watch for continuation volume above 2415 to confirm momentum
________________________________________
🔹 Trend Bias: ✅ Bullish
Clear bullish trend forming after breakout. Supports are holding, and resistance levels are now being tested with strength.
________________________________________
📌 What’s Catching Our Eye:
• STWP HNI Setup triggered at 2400–2415 range
• Breakout above strong support near 2300–2320
• OI Data and Option Chain analysis supports upward continuation
________________________________________
👀 What We’re Watching For:
• Sustained close above 2415 = bullish continuation
• Option build-up hints at possible follow-through toward higher zones
• Strong CE activity at 2420, 2440, and 2460 levels
________________________________________
🔹 OPTION CHAIN ANALYSIS – KEY TAKEAWAYS
💥 CALL Side (Bullish Builds):
• 2420 CE: 40.05 – 📈 OI up +158%, Long Build-Up
• 2440 CE: 31.25 – 📈 OI up +182%, Long Build-Up
• 2460 CE: 24.50 – 📈 OI up +345%, Long Build-Up
• 2500 CE: 14.45 – 📈 OI up +22%, Long Build-Up
🚀 Indicates participants are positioning for extended upside toward 2460–2500
📉 PUT Side (Writers in Control):
• 2300 PE: Down -60%, Short Build-Up
• 2400 PE: Down -52%, Short Build-Up
💡 Suggests confidence that price will hold above 2400
🧠 Conclusion from OI Data:
Strong bullish sentiment — Call Writers/Buyers increasing exposure at higher strikes, Puts being shorted. Volume + OI = directional strength.
________________________________________
⚠️ Risks to Watch:
• Close below 2390–2395 = early weakness sign
• Bearish divergence + volume fade risk
• Watch 2460–2512 for rejection
________________________________________
🔮 What to Expect Next:
• ⚡ Price retesting 2460 zone likely
• 🔄 Pullbacks toward 2395–2405 may offer low-risk re-entry
• ⚠️ Watch for spikes in volatility near 2500
________________________________________
📊 Trade Plan (Educational Only – Based on Logic + Volume Confirmation)
🔼 Breakout Long Setup
• Entry: Above 2415
• Stop Loss: 2339.30
• Risk–Reward: 1:1 to 1:2 +
📌 Why:
• Bullish Marubozu + Volume
• OI Long Build-Up at 2420–2460
• STWP HNI Setup alignment
🔁 Pullback Long Setup
• Entry Zone: 2395–2400
• Stop Loss: 2365
• Risk–Reward: 1:1 to 1:2 +
📌 Why:
• Breakout retest zone
• Tight SL with continuation logic
🔽 Bearish Setup (Only on Failure)
• Entry: Below 2360
• Stop Loss: 2410
• Risk–Reward: Flexible (trader-defined)
📌 Why:
• Only valid on strong breakdown with volume
• Reversal below structure
________________________________________
📊 Option Trade Ideas – For Learning Purpose Only
🔼 Best CE (Bullish Bias)
➡️ 2420 CE @ 40.05
• Risk–Reward Potential: 1:1 to 1:2+
🛑 SL: 26
📌 Why: Clean momentum zone, well-aligned with breakout
🟡 Alternate CE (Momentum Extension)
➡️ 2440 CE @ 31.25 – if expecting further move toward 2490–2510
• Slightly lower Delta, higher risk-reward
🔽 Best PE (Only if Breakdown)
➡️ 2400 PE @ 34.40
• Use only below 2390 with high-volume reversal
• Risk–Reward Potential: 1:1 to 1:2 +
🛑 SL: 21
________________________________________
❌ Invalidation Triggers:
• Daily close below 2360
• Long unwinding on CE strikes
• PE Long Build-Up + Volume = Bearish Shift
________________________________________
⚠️ Disclaimer:
This analysis is for educational purposes only.
“STWP HNI Setup” is a proprietary internal model shared for study and learning.
STWP is not a SEBI-registered advisor.
This is not a buy/sell recommendation.
Please consult your financial advisor before taking any action.
STWP is not responsible for trading decisions based on this post.
________________________________________
💬 Found this helpful?
Did the STWP HNI Setup help you anticipate the move?
💭 Drop your thoughts in the comments ⬇️
🔁 Share this with fellow traders
✅ Follow STWP for volume-based, logic-driven setups
🚀 Be Self-Reliant | Trade with Patience | Learn with Logic
________________________________________
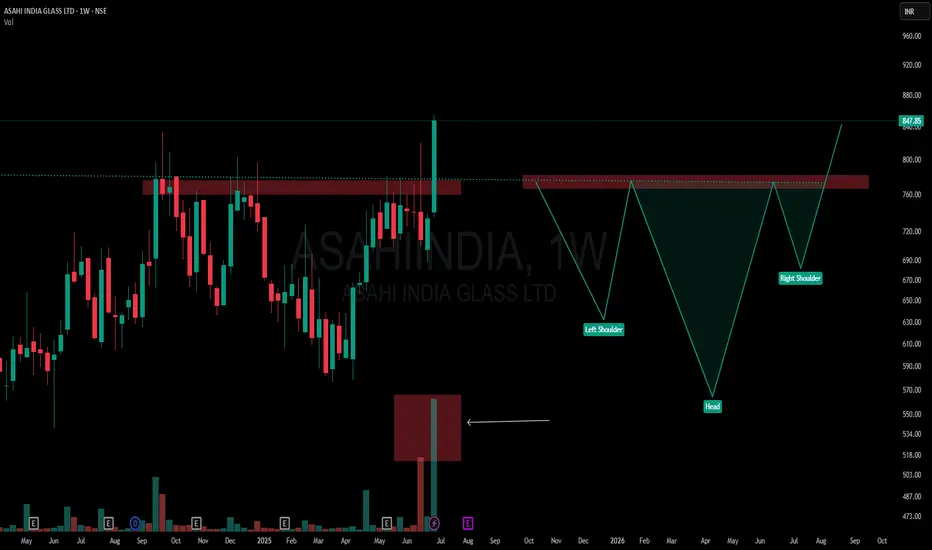
When Textbook Meets Extremes: Perfect Inverted Head and Shoulder📌 ASAHI INDIA GLASS | Weekly Timeframe
🧩 Pattern Breakdown (from a textbook lens):
-Left Shoulder: Formed after the Sept–Nov 2024 rejection
-Head: Created around Feb–May 2025 with a deeper dip
-Right Shoulder: Built through June 2025
-Neckline: ₹750–₹760 zone, tested multiple times
-Breakout Candle: High conviction — wide-bodied, strong close, with 17.61M volume
📘 According to classical technical analysis, Inverted Head & Shoulders patterns often signal a trend reversal. What's notable here is the context — the structure has developed after a sustained move upward, not from a bear phase.
🎯 The candle breaks above a long-standing supply zone with size, volume, and conviction — yet its location at the top makes it structurally interesting and unusual when viewed through traditional pattern psychology.
🚫 This is not a tip, call, or directional bias — just a visual log of structure and volume behavior.
💬 Chart interpretations welcome in comments.
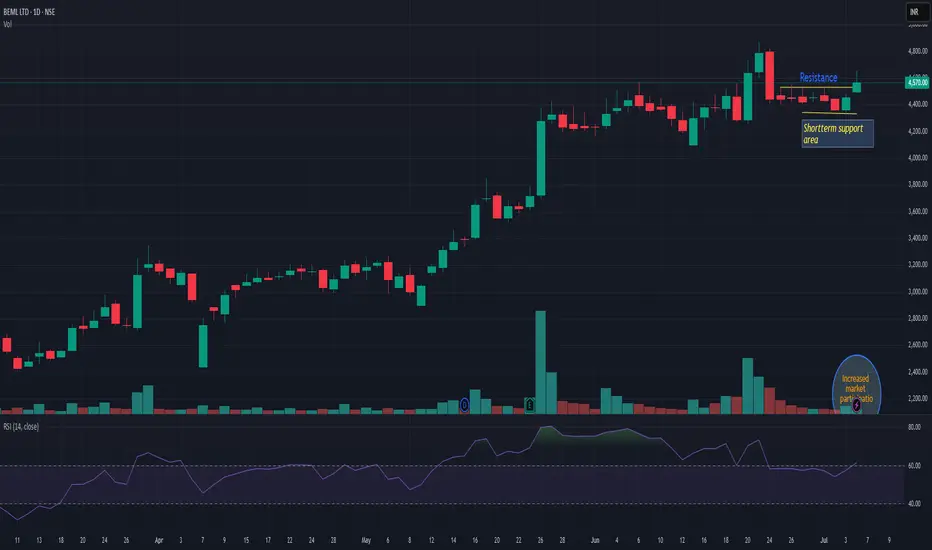
BEMLBEML is trading above resistance line with very decent volume. As long as it is trading above support line, momentum may continue. Recently fresh momentum has been observed on majority defense stock. If today it is closing above 4600 then we may see momentum for next 12-15%. Keep it on radar.
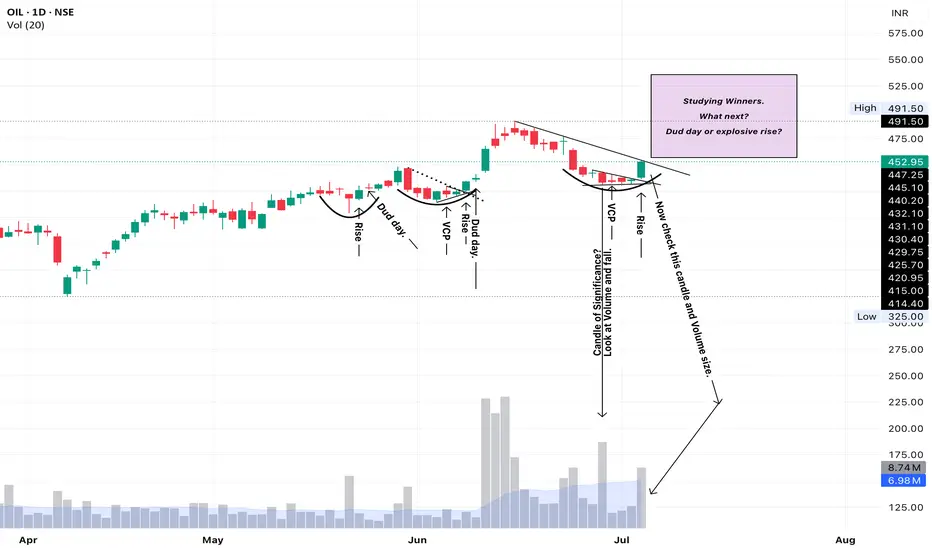
OIL - VCP and riseDisclaimer: I am not a SEBI Registered Analyst. Please do your own research or study.
Also , point out any anomaly you see and assist correct bias.
My Bias: Bullish. If not moved in 2-3 days, this may fade.
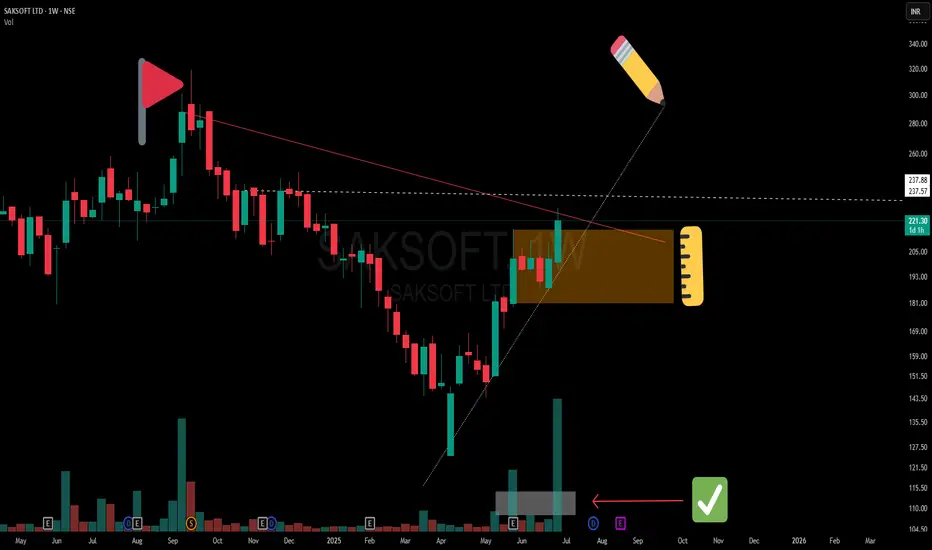
Precision Meets Patience | SAKSOFT Chart WTF🔻 A clean Control Trendline (CT) drawn from the all-time peak (🔺) on the Weekly Time Frame (WTF) shows a long-term price memory resistance finally getting tested.
📏 Overlapping that is a hidden horizontal resistance (⚪ dotted white line), representing the final hurdle before the stock can challenge the supply zone.
🟧 Mother Candle Structure: A powerful consolidation candle has now been broken with strength, giving us structure + intent in one move.
🔊 Volume speaks! We’ve seen two separate clusters of high volume, confirming active participation—not a lonely breakout.
📈 The trendline from bottom left is giving both body and wick supports—a technically clean angle where structure meets sentiment.
📝 Note:
This is a structural breakdown meant for educational and analytical purposes. Not a forecast or recommendation.
ENVIRO INFRA ENGINEERS (NSE: ENVIRO)View: Strongly Bullish.
Bias: Trend reversal confirmed.
Strategy:
BUY: Initiate around ₹240-₹245 or on retest of ₹230-₹235.
Targets (T):
T1: ₹262
T2: ₹287
T3: ₹312
Stop-Loss (SL): ₹220 (on daily closing basis).
Reasoning:
Decisive breakout from a significant long-term descending trendline.
Strong volume confirming the breakout.
RSI indicating robust bullish momentum.
Potential for significant upside as stock recovers from prior fall.
Note: This is an educational analysis and not financial advice. Do your own due diligence before investing.

APOLLO HOSPITALS (NSE: APOLLOHOSP)View: Strongly Bullish.
Bias: High momentum uptrend.
Strategy:
BUY: Initiate at current levels (around ₹7500) or on dips towards ₹7250-₹7300, or on a confirmed daily close above ₹7600.
Targets (T):
T1: ₹7800-₹8000
T2: ₹8250-₹8500
Stop-Loss (SL): ₹7150 (on daily closing basis).
Reasoning:
Confirmed breakout from a significant Rectangle/W-pattern consolidation.
Exceptional volume accompanying the breakout.
Strong bullish momentum indicated by RSI.
Potential for a new leg of the uptrend after clearing ₹7600.
Note: This is an educational analysis and not financial advice. Do your own due diligence before investing.
