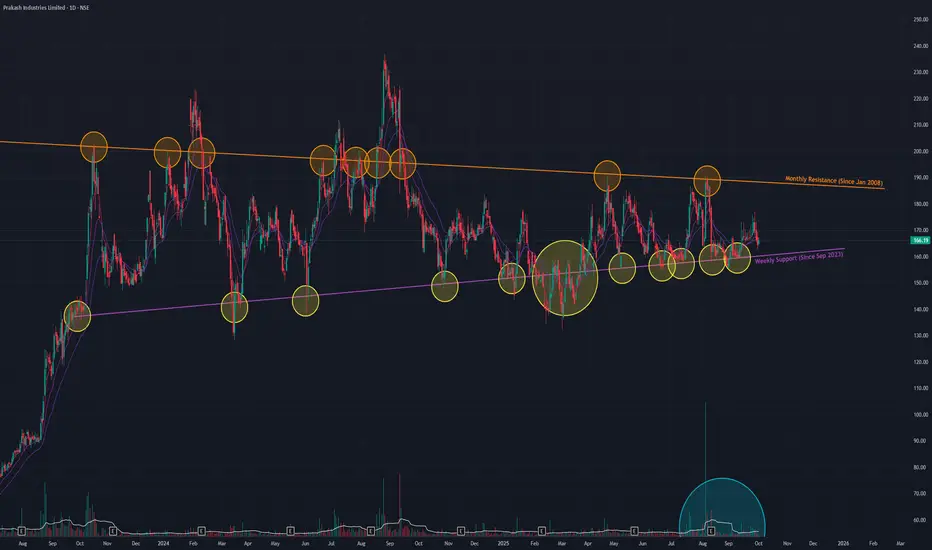
Prakash Ind (D) - Coils in Major Triangle Pattern, Nearing ApexPrakash Industries is currently in a prolonged consolidation phase, trading within a large Triangle pattern that has been forming since September 2023. This pattern typically acts as a continuation of the prior trend, which in this case was a strong uptrend that began in April 2023.
The stock is now approaching the apex of this triangle, suggesting a significant price move could be imminent. The key boundaries to watch are:
- A formidable long-term resistance trendline dating back to January 2008 . This level has triggered several "fake breakouts" in the past.
- A strong support trendline established since September 2023.
Outlook: A Breakout Awaits Confirmation
The stock is likely to remain range-bound in the immediate short term. A decisive move will only occur upon a breakout or breakdown from the existing pattern, which must be confirmed by a significant increase in trading volume.
- Trading Range: Within the current pattern, the stock could oscillate between the upper resistance near ₹187 and the lower support level around ₹160 .
- Breakout Scenario 📈: A sustained breakout above the multi-year resistance on high volume would signal a continuation of the primary uptrend.
- Breakdown Scenario 📉: Conversely, a breakdown below the support trendline would invalidate the bullish continuation thesis and could lead to a significant correction.
Volume
INDNIPPON (D) - Hits New All-Time High After Dual BreakoutIndia Nippon Electricals has demonstrated exceptional bullish momentum, surging to a new All-Time High (ATH) yesterday with a powerful +11.24% gain on the back of massive trading volume.
This price surge follows two significant technical breakouts in September 2025:
1. A breakout from a prolonged consolidation phase that had been in place since January 2024.
2. A breakout from a very long-term angular resistance trendline that dated back to January 2020.
Since breaking out of consolidation last month, the stock has already gained over 24%.
Comprehensive Bullish Confirmation 👍
The upward move is strongly supported by a confluence of positive indicators across multiple timeframes:
- Broad-Based Strength: Short-term Exponential Moving Averages (EMAs) are in a bullish crossover state across the monthly, weekly, and daily charts .
- Confirmed Momentum: The Relative Strength Index (RSI) also shows a bullish crossover on the monthly and weekly charts, while the daily RSI is on the verge of confirming the same.
- Volume Trend: There has been a consistent increase in overall trading volume , indicating growing and sustained buyer interest.
Outlook and Key Levels
Given the rapid and significant price appreciation, a short-term pullback or consolidation would be a healthy technical development. A potential retest of the recent breakout level could offer a lower-risk entry point for new positions ("buy on dips").
- Bullish Case 📈: If the current momentum is sustained, the next potential price target on the upside is ₹1,118 .
- Bearish Case 📉: If the momentum is not sustained and a correction occurs, the stock could find support near the ₹900 level.

IFGL (D) - Rejects at Key Resistance Despite Massive VolumeIFGL Refractories is currently at a critical inflection point after a dramatic but ultimately unsuccessful breakout attempt. Yesterday, the stock surged an incredible +18.35% on massive, multi-year high trading volume, piercing a key horizontal resistance trendline .
However, the momentum was not sustained. Today, the stock faced selling pressure and closed back below this critical resistance level, signaling that sellers are still active at this price zone. This price action follows a period of uptrend and consolidation that began after the stock's initial downtrend from its All-Time High in December 2023.
Overwhelmingly Bullish Underlying Indicators 👍
Despite the failure to hold the breakout, the underlying technical picture remains exceptionally strong:
- Universal Bullish Crossover: Both the short-term Exponential Moving Averages (EMAs) and the Relative Strength Index (RSI) are in a confirmed bullish crossover state across the monthly, weekly, and daily charts .
- Volume Thrust: Yesterday's massive volume spike indicates a significant level of interest in the stock, even if it resulted in a short-term rejection.
Outlook: Awaiting a Confirmed Breakout
The stock is in a classic battle between strong underlying momentum and a stubborn overhead resistance. A decisive and sustained close above the resistance line is now required to confirm the next leg up.
- Bullish Case 📈: If buyers can overcome the selling pressure and secure a confirmed breakout, the next potential target is the ₹342 level.
- Bearish Case 📉: If the resistance continues to hold and momentum fades, the stock could pull back to find support near the ₹237 level. The price action in the coming days will be crucial.

BBox (D) - Confirms Major Breakout After Prolonged StruggleBlack Box has successfully broken out from a major angular resistance trendline that had been a significant barrier since the stock's trend reversed in April 2025. After multiple failed attempts, the stock has spent the last few days decisively trading above this line, a move validated by sustained high volume and successful retests of the broken resistance as new support.
The breakout was further emphasized yesterday when the stock opened with a significant gap up , firmly establishing its position above the trendline. This entire sequence follows a bullish Double-Bottom reversal pattern in April 2025, which ended the downtrend from the stock's All-Time High in December 2024.
Comprehensive Bullish Confirmation 👍
The technical outlook is overwhelmingly positive, with strong confirmation across multiple timeframes:
- Multi-Timeframe Strength: The short-term Exponential Moving Averages (EMAs) are in a bullish crossover state across the daily, weekly, and monthly charts .
- Broad Momentum: The Relative Strength Index (RSI) also confirms a bullish crossover on the daily and weekly charts and is on the verge of doing so on the monthly chart.
- Volume Thrust: The breakout and subsequent trading have been characterized by exceptionally high volume , indicating strong institutional interest.
Outlook and Next Hurdle
While the breakout from the angular resistance is confirmed, the stock now faces another challenge: a long-term horizontal resistance trendline .
- Bullish Case 📈: If the current momentum is sustained and the stock can breach this upcoming horizontal resistance, the path could be clear for a move towards the ₹630 level.
- Bearish Case 📉: If this breakout proves to be false and momentum fades, the stock could pull back to find support near the ₹450 level. The price action in the coming days remains critical.

NALCO (D) - Challenges Major Resistance with Strong MomentumNational Aluminium is making a powerful attempt to break through a major resistance level that has previously thwarted several breakout attempts. The stock surged +4.88% today, closing at ₹213.87 on the back of exceptionally high trading volume, signaling strong buyer interest at this critical juncture.
This move is part of a broader uptrend that began in April 2025, which itself was a reversal from a downtrend following the stock's All-Time High in November 2024.
Broad-Based Bullish Signals Building 👍
The underlying technical picture is strong and showing signs of further improvement:
- Confirmed Long-Term Strength: The short-term Exponential Moving Averages (EMAs) are in a bullish crossover state on both the monthly and weekly charts. The Relative Strength Index (RSI) also confirms a bullish crossover on the weekly chart.
- Developing Daily Momentum: On the daily chart, both the EMAs and RSI are on the verge of a bullish crossover , which would provide immediate-term confirmation. The monthly RSI is in a similar poised-to-cross state.
- Volume Thrust: Today's price surge was driven by massive volume , indicating a high level of conviction from buyers.
Outlook: Awaiting a Decisive Breakout
The stock is at a pivotal point. While the indicators are overwhelmingly bullish, a confirmed close above the current resistance is necessary.
- Bullish Case 📈: If the stock successfully breaks and sustains its position above the key resistance, especially on good volume, the next potential price target is the ₹245 level.
- Bearish Case 📉: If it is rejected at this resistance once again and momentum fades, the stock could pull back to find support near the ₹195 level.

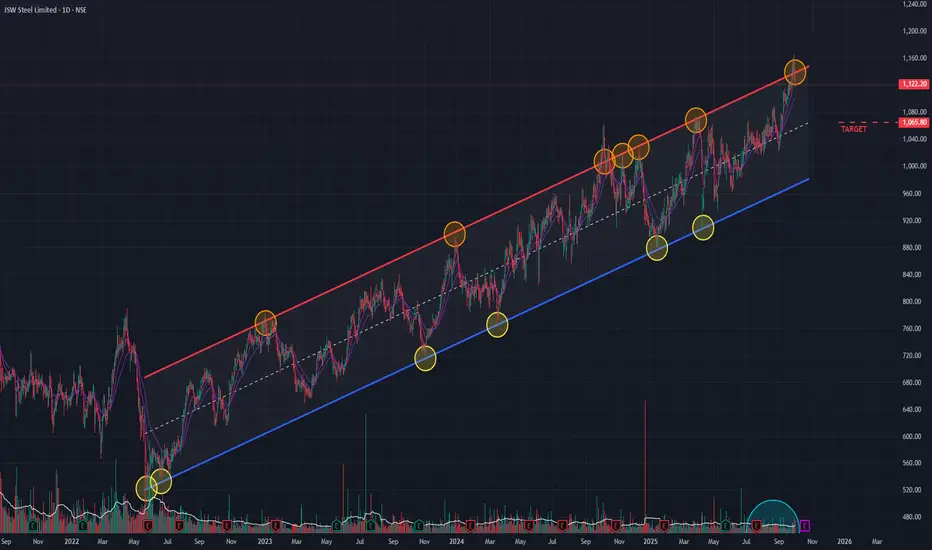
JSW Steel (D) - Tests Upper Boundary of Long-Term ChannelJSW Steel is currently trading at a critical juncture, testing the upper resistance trendline of a well-defined channel pattern that has been in place since May 2022. Historically, this trendline has acted as a strong barrier, often leading to a price reversal back towards the lower end of the channel.
Bearish Indicators Emerge 📉
Several technical indicators are suggesting that the upward momentum is waning and a potential downturn could be imminent:
- RSI Divergence: The Relative Strength Index (RSI) is showing bearish signs on the daily chart and is also starting a negative crossover on the weekly chart.
- Momentum Shift: Short-term Exponential Moving Averages (EMAs) on the daily chart are entering a negative crossover , signaling a potential shift in short-term momentum to the downside.
- Rising Bearish Volume: There has been a noticeable increase in selling volume as the stock approaches this resistance, indicating strengthening bearish pressure.
Outlook and Key Levels
Given the stock's position at a historical resistance level combined with multiple bearish technical signals, a cautious approach is warranted.
If the channel pattern holds true, the stock could reverse from this level and head downwards. A potential downside target in this scenario would be the support level near ₹1,065 . The price action in the coming sessions will be crucial to confirm this potential reversal.
Munjal Au (D) - Challenges Major Resistance with Strong MomentumMunjal Auto Industries is showing significant bullish strength, surging +5.28% today on the back of massive trading volume. The stock has successfully broken through one long-term resistance and is now positioned just below a second, even more significant, long-term resistance level.
This powerful move is part of a broader trend reversal that began in March 2025, following a downtrend from the stock's All-Time High in October 2024.
Overwhelmingly Bullish Technical Confirmation 👍
The positive outlook is supported by a rare and powerful alignment of bullish indicators across all major timeframes:
- Broad-Based Momentum: Both the short-term Exponential Moving Averages (EMAs) and the Relative Strength Index (RSI) are in a bullish crossover state on the monthly, weekly, and daily charts .
- Golden Crossover: A Simple Moving Average (SMA) Golden Crossover occurred a few days ago, providing a strong long-term bullish signal.
- Volume Thrust: The recent price gains have been accompanied by significant volume spikes , indicating strong buyer conviction.
Outlook and Key Levels
The stock is at a critical juncture, facing a major long-term resistance. A successful breakout is required to confirm the next leg of the uptrend.
- Bullish Case 📈: If the upward momentum is sustained and the stock decisively breaks through the current resistance, the next potential target is the ₹127 level.
- Bearish Case 📉: If the stock is rejected at this major resistance and momentum fades, it could pull back to find support near the ₹90 level.

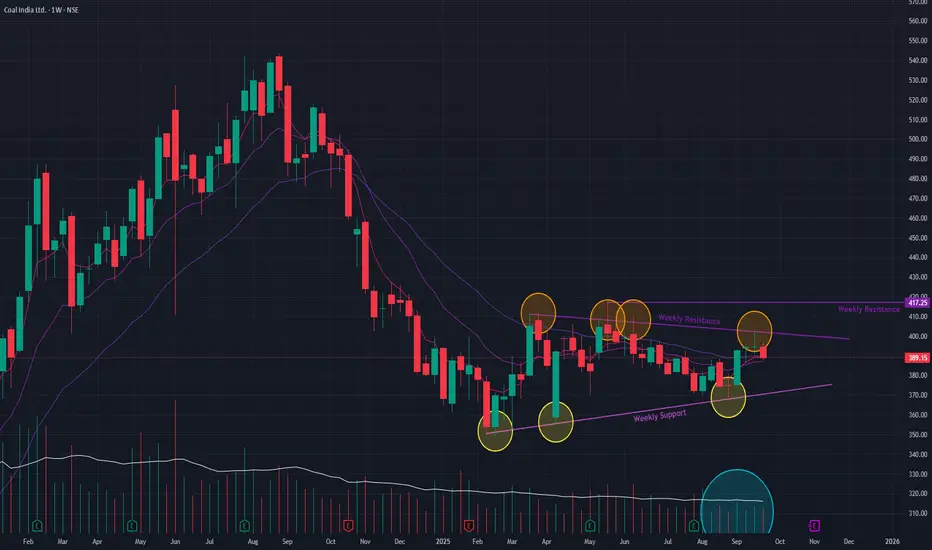
Coal India (W) - Consolidates in a Potential Bear Flag PatternFollowing a significant downtrend that began in August 2024, Coal India has entered a sideways consolidation phase, which has been in place since December 2024. This prolonged period of consolidation after a downtrend is forming what appears to be a Bear Flag , a classic continuation pattern that typically resolves to the downside.
The stock is currently trading within this pattern, approaching a critical juncture.
Bearish Indicators to Note 📉
The negative outlook is supported by key observations:
- Continuation Pattern: The formation of a Bear Flag itself suggests that the pause is likely a prelude to resuming the prior downtrend.
- Declining Volume: Trading volume has been noticeably drying up during this consolidation phase, which often indicates a lack of buying conviction and can precede a breakdown.
Outlook and Key Levels
The price action in the coming weeks will be crucial.
- Bearish Case: A breakdown below the lower trendline of the flag pattern, especially on a spike in volume, would confirm the continuation of the downtrend.
- Bullish Reversal: To invalidate the bearish pattern, the stock must stage a decisive breakout above the upper resistance trendline of the flag, supported by a massive surge in volume. Until such a breakout occurs, the prevailing technical bias remains bearish.
#ARIHANTCAPAsset: Arihant Capital Markets Ltd (ARIHANTCAP)
Breakout Level: 890
Potential Target: 1075
Stop Loss: 850 (~4%)
Timeframe: Short to Low Medium term
Risk to Reward ratio : 1:2
Rationale:
Fundamentals -
Fundamentally decent stock with the following attributes:
* ROCE - 21.3%
* ROE - 15.9%
* Debt to Equity - 0.25
* Stock PE 23.0 / Industry PE - 16.2 || Stock PBV 2.99 / Industry PBV 2.58 - Company is slightly overpriced
* EPS / Revenue - Increasing
Technicals -
⦁ Stock is forming a large rounding base pattern and surfing the 10/20 DMAs
⦁ Each time the price hits the moving averages, it tends to bounce back and continue up
⦁ The price is above the 200 DMA
⦁ RS line is picking up, momentum is picking up, ADR line is picking up
⦁ Price has climbed back to its ATH
Market analysis
⦁ Promoters are holding steady
Cons
⦁ Not much institutional participation
This analysis is for educational purposes only and should not be considered as financial advice. Trading and investing in financial markets involve significant risk, and past performance is not indicative of future results. You should conduct your own research and consult with a qualified financial advisor before making any trading or investment decisions. The author is not responsible for any financial losses or damages that may result from the use of this information.

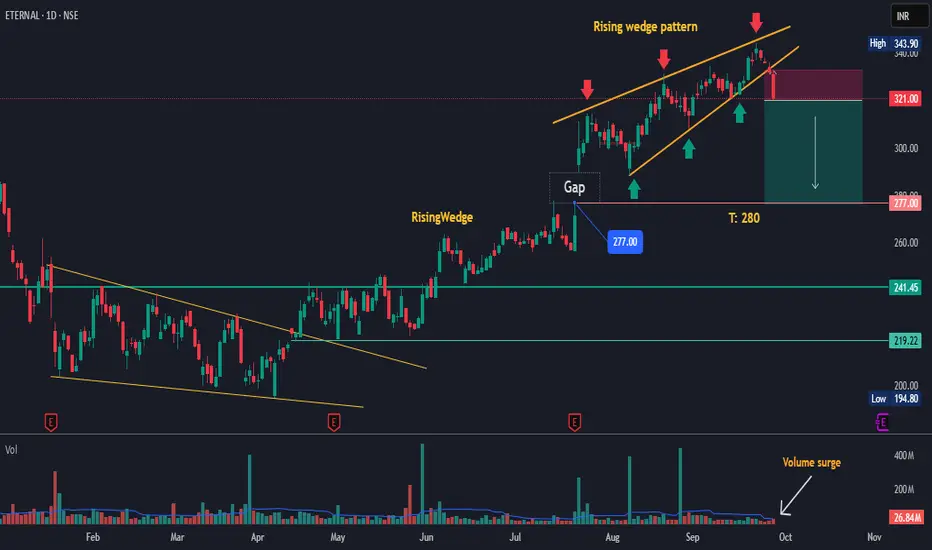
ETERNAL – Rising Wedge Breakdown Setup | Target: 280The stock has formed a Rising Wedge pattern after a strong rally, with multiple rejections from the upper trendline (marked by red arrows). previous price action shows weakness near the resistance zone, indicating a potential breakdown.
🔹 Key Highlights:
Rising Wedge Pattern visible on the daily chart – a bearish reversal setup.
Volume surge in recent sessions signals distribution at higher levels.
Gap Support at 277 – likely to be tested once breakdown confirms.
Immediate Target: 280, aligning with horizontal support.
Risk-to-Reward favored on the short side as price rejects resistance.
🔻 Breakdown Confirmation:
277 (Gap level)
241.45
219.22
This setup offers a clean technical short opportunity if downside momentum continues. Suitable for traders looking to capitalize on wedge breakdowns with volume confirmation.
Disclaimer : Risk management is crucial in this volatile market, so keep position sizing appropriate. This analysis is intended for educational purposes and not financial advice.
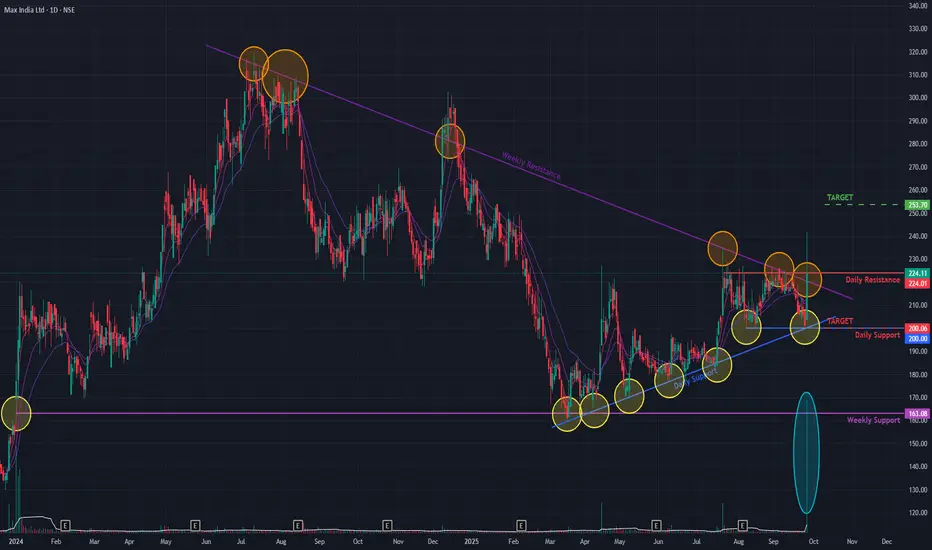
Max India (D) - Executes a Powerful Dual-Resistance BreakoutMax India has shown a significant bullish development, decisively breaking out of two key resistance levels today. The stock breached both a long-term angular resistance trendline from July 2024 and a short-term resistance from July 2025. This powerful move was confirmed by a massive surge of +14.95% on the back of exceptionally high trading volume, with the stock closing at ₹224.11 .
This breakout signals a potential acceleration of the reversal that began in March 2025, following a prolonged downtrend from the stock's All-Time High in July 2024.
A Mix of Bullish Indicators 👍
The technical landscape shows a confluence of positive signals, although some are still developing:
- Broad Momentum: The Relative Strength Index (RSI) is in a bullish crossover state on both the weekly and daily charts, confirming strong momentum.
- Long-Term Strength: A Golden Crossover appeared on the daily chart a few days ago, providing a strong long-term bullish signal.
- Developing Confirmation: While short-term Exponential Moving Averages (EMAs) show a bullish crossover on the weekly chart, they have not yet confirmed this on the daily timeframe, suggesting immediate-term momentum is still catching up.
Outlook: Awaiting Confirmation
While the breakout is powerful, re-confirmation is prudent. A common technical event is a retest of the broken resistance levels as new support.
- Bullish Case 📈: If the momentum continues and the breakout is sustained, the next potential target on the upside is the ₹250 resistance level.
- Bearish Case 📉: If the breakout fails to hold and momentum subsides, the stock could pull back to find support near the ₹200 level.
HINDCOPPER H&S BREAKOUTHindcopper breaking H&S pattern weekly
huge volume this week with bullish rsi above 60
target1 375 target2 416
trading above all key ema
NO BUY/SELL RECOMENDATION

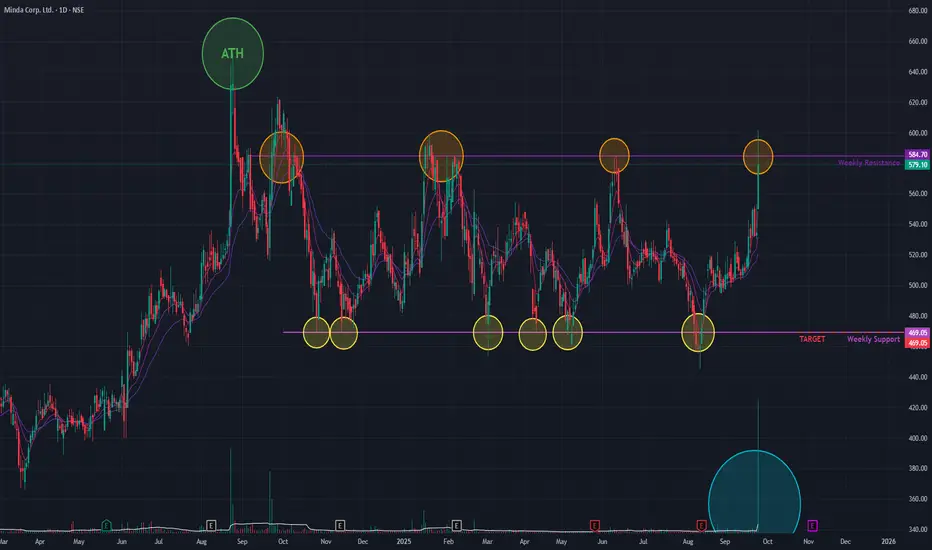
Minda Corp (D) - Challenges Major Resistance with Massive VolumeMinda Corp is making a powerful attempt to break out of a prolonged consolidation phase that has been in place since its All-Time High in August 2024. Today, the stock surged +8.34% on the back of exceptionally high trading volume —the largest spike seen in a considerable time.
The stock challenged a major resistance trendline that has been a barrier since September 2024, rejecting multiple breakout attempts. While today's price action breached this level intra-day, it failed to achieve a close above it , signaling that the battle between buyers and sellers at this critical juncture is not yet over.
Broad-Based Bullish Signals 👍
Despite the failed closing, the underlying technical picture is strong, with multiple indicators suggesting a bullish bias:
- Multi-Timeframe Strength: The short-term Exponential Moving Averages (EMAs) and the Relative Strength Index (RSI) are all indicating bullish crossovers on the monthly, weekly, and daily charts .
- Volume Thrust: Today's massive volume spike underscores the significant buying interest at this resistance level, even if it was not enough to secure a close above it.
Outlook: Awaiting a Decisive Close
The stock is at a critical inflection point. A decisive close above the resistance line on high volume is now required to confirm a true breakout.
- Bullish Case 📈: If a confirmed breakout occurs and the momentum is sustained, the next potential target is the resistance zone near ₹701 .
- Bearish Case 📉: If the stock is rejected again at this level, it could fall back to the lower end of its consolidation range, with a potential support level near ₹469 . The price action in the coming days will be crucial.
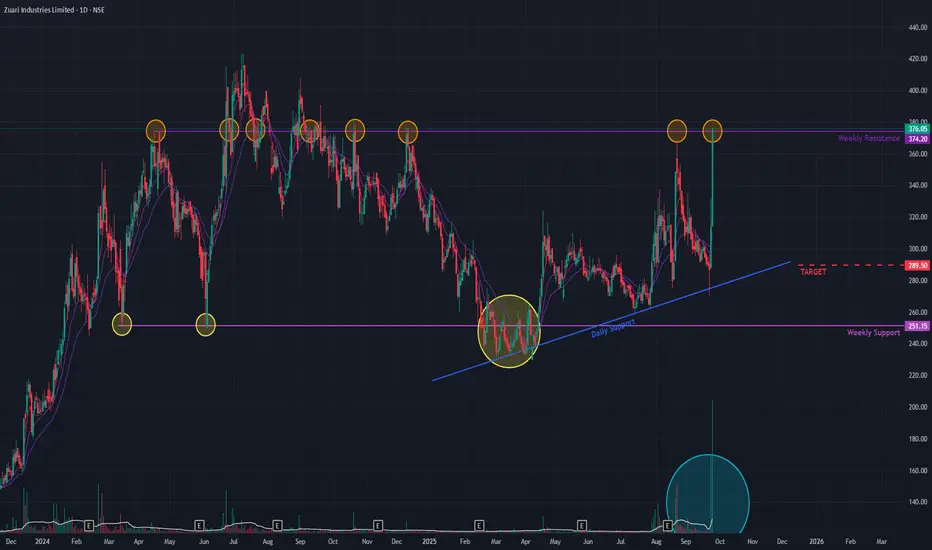
Zuari Ind (D) - Executes a Powerful BreakoutZuari Industries has decisively broken out of a prolonged consolidation phase, signaling a significant shift in momentum. Over the past two trading sessions, the stock has surged an incredible +29.72% , a move backed by a massive volume spike that validates the breakout from a key horizontal resistance level in place since April 2024. The stock closed today at ₹376.04 , hitting the 20% upper circuit.
This breakout appears more decisive than previous "fakeouts" due to the sheer force of the move and the exceptionally high volume. Furthermore, the strong closing candle, with its high and close being nearly identical, suggests intense buying pressure and a willingness for participants to push the price even higher.
Comprehensive Bullish Confirmation 👍
The bullish outlook is strongly supported by a rare alignment of positive indicators across all major timeframes:
- Multi-Timeframe Strength: Both the short-term Exponential Moving Averages (EMAs) and the Relative Strength Index (RSI) are indicating strong bullish crossovers on the monthly, weekly, and daily charts .
- Volume Thrust: The breakout was driven by enormous trading volume , indicating a high level of conviction and institutional participation.
Outlook and Key Levels
This powerful breakout has potentially initiated a new uptrend. The price action in the coming days will be crucial to confirm that buyers can absorb any profit-taking and hold the breakout level.
- Bullish Case 📈: If the current momentum is sustained, the next logical price target is the resistance zone near ₹497 .
- Bearish Case 📉: Should the breakout fail and momentum reverse, the stock could pull back to find support near the previous resistance (now support) level of ₹289 .
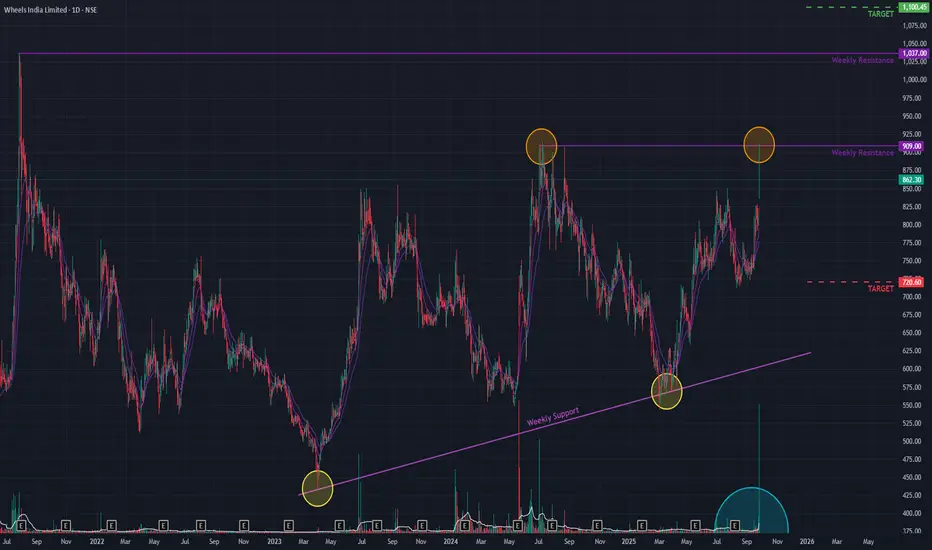
Wheels India (D) - Challenges Key Resistance with Massive VolumeWheels India is making another powerful attempt to break through a key horizontal resistance level that has been in place since July 2024. The stock, which has been in a long-term uptrend since March 2020, has been rejected at this level multiple times.
Today's session was marked by a gap-up opening and an exceptionally high trading volume , significantly larger than in previous attempts, signaling strong bullish intent. However, despite this strength, the stock closed at ₹862.30 , just below the critical resistance, indicating that the battle is not yet won.
Broad-Based Bullish Confirmation 👍
The underlying technical picture remains strong, with multiple indicators suggesting building positive pressure:
- Multi-Timeframe Strength: Both the short-term Exponential Moving Averages (EMAs) and the Relative Strength Index (RSI) are showing bullish crossovers on higher timeframes, confirming broad-based positive momentum.
- Volume Thrust: Today's massive volume spike indicates a significant increase in buyer participation at this crucial juncture.
Outlook: Awaiting a Decisive Close
The stock is at a critical inflection point. While the underlying indicators are bullish, a decisive close above the resistance is needed for confirmation.
- Bullish Case 📈: If the stock successfully breaks and holds above the current resistance, it could clear the path for a move towards the next major hurdle near the ₹1,100 level.
- Bearish Case 📉: If it is rejected once again and the momentum fades, the stock could pull back to find support near the ₹720 level. The price action in the coming days will be crucial.
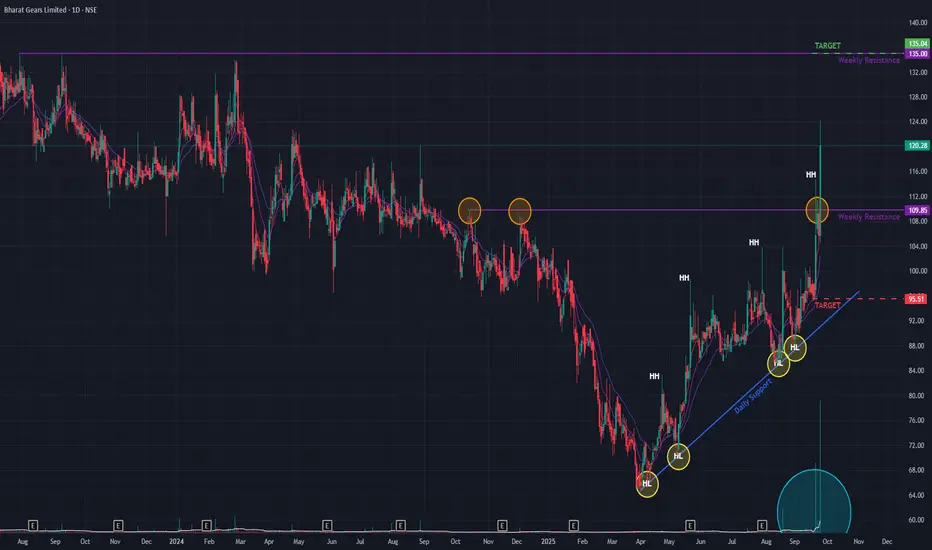
Bharat Gears (D) - Executes a Decisive BreakoutBharat Gears has confirmed a significant bullish development, decisively breaking out of a key resistance trendline. Today's powerful move saw the stock surge +13.74% to close at ₹120.28 , on the back of massive trading volume that was multiple times the recent average. This action reinforces the uptrend that began in April 2025, which has been characterized by a consistent pattern of higher highs and higher lows.
Notably, after several attempts over the past four days, today’s breakout was significant as the stock closed firmly above the resistance level, a strong technical confirmation.
Comprehensive Bullish Confirmation 👍
The breakout is validated by an overwhelmingly strong alignment of bullish signals across all major timeframes:
- Multi-Timeframe Momentum: The short-term Exponential Moving Averages (EMAs) are in a bullish crossover on the monthly, weekly, and daily charts .
- Dual Confirmation: This positive momentum is corroborated by the Relative Strength Index (RSI) , which also indicates a bullish crossover across all three timeframes.
- Volume Thrust: The breakout was accompanied by an exceptionally high volume spike , signaling strong conviction and participation from buyers.
Outlook and Key Levels
Following such a powerful breakout, the stock may potentially retest the breached resistance level as new support . This is a common technical pattern and would serve as further confirmation of the uptrend's strength.
- Bullish Case 📈: If the upward momentum is sustained, particularly on good volume, the next potential price target is the resistance zone around ₹135 .
- Bearish Case 📉: Conversely, if the breakout fails to hold and momentum is lost, the stock could pull back to find support near the ₹95 level.
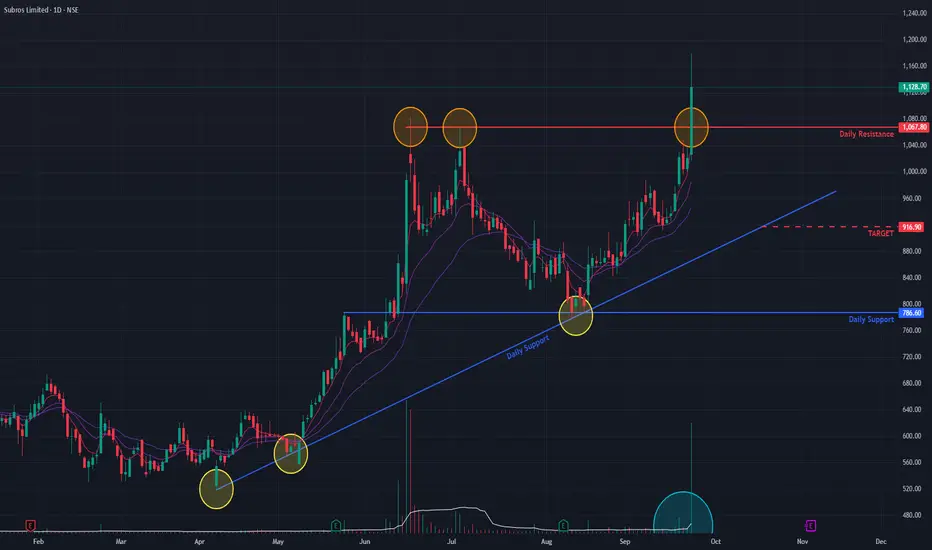
Subros (D) - Hits New ATH, Breaking Out of ConsolidationSubros has demonstrated exceptional strength, surging to a new All-Time High (ATH) today with a significant +10.45% gain . This powerful move was supported by a massive spike in trading volume, suggesting the potential end of the sideways consolidation phase that has been in place since June 2025.
Comprehensive Bullish Confirmation 👍
The breakout is validated by a strong alignment of bullish signals across all major timeframes:
- Multi-Timeframe Momentum: The Relative Strength Index (RSI) is indicating a bullish state on the monthly, weekly, and daily charts , showcasing broad-based strength.
- Short-Term Confirmation: The short-term Exponential Moving Averages (EMAs) are in a strong bullish crossover, confirming the immediate upward momentum.
- Volume Thrust: The breakout was accompanied by an exceptionally high volume spike , indicating strong conviction from buyers.
Outlook and Key Levels
Following a significant breakout, a retest of the previous resistance trendline as new support would provide strong confirmation of a continued uptrend.
- Bullish Case 📈: If the upward momentum is sustained, the next potential price target on the upside is ₹1,347 .
- Bearish Case 📉: Conversely, if the breakout fails to hold and momentum is lost, the stock could pull back to find support near the ₹916 level.
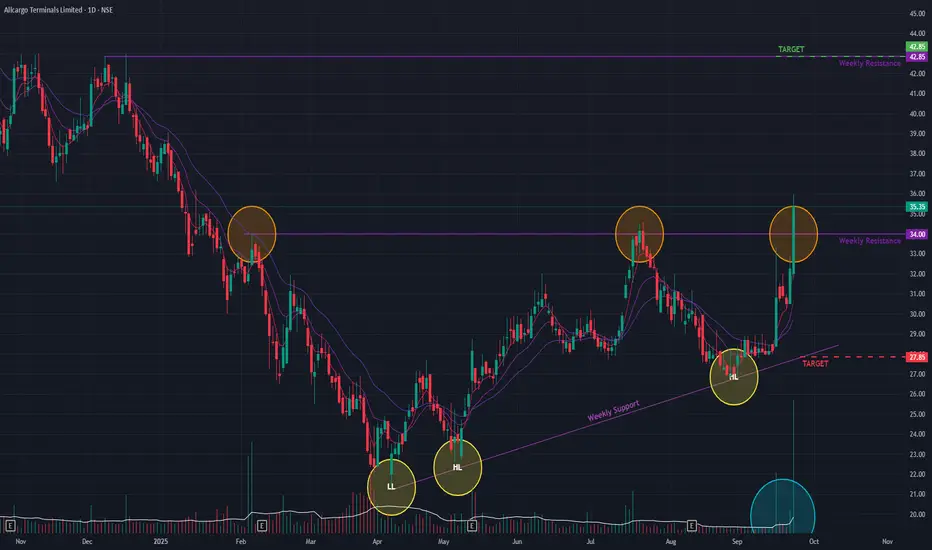
ATL (D) - Signals Bullish Reversal with Powerful BreakoutAllcargo Terminals has demonstrated a significant bullish development, suggesting its long-term downtrend may be reversing. Today, the stock decisively broke out of a key horizontal resistance trendline , a move confirmed by an impressive +9.61% price surge on the back of massive trading volume.
This breakout is the latest in a series of positive signs since May 2025, including the consistent formation of Higher Lows , which indicated a potential shift in market structure after the downtrend from January 2024.
Broad-Based Bullish Confirmation 👍
The positive outlook is strongly supported across multiple indicators and timeframes:
- Volume Thrust: The breakout was accompanied by exceptionally high volume , signaling strong conviction from buyers.
- Daily & Weekly Momentum: Both the short-term Exponential Moving Averages (EMAs) and the Relative Strength Index (RSI) are exhibiting bullish crossovers on both the daily and weekly charts, indicating synchronized positive momentum.
Outlook and Key Levels
Following a strong breakout, a common technical development is a retest of the former resistance level as new support . The price action in the coming days will be crucial for confirming the breakout's validity.
- Bullish Case 📈: If the momentum is sustained and the breakout level holds, the stock could proceed towards the next resistance target near ₹42 .
- Bearish Case 📉: However, if the stock fails to hold the breakout and momentum wanes, it could pull back towards the support level of ₹27 .
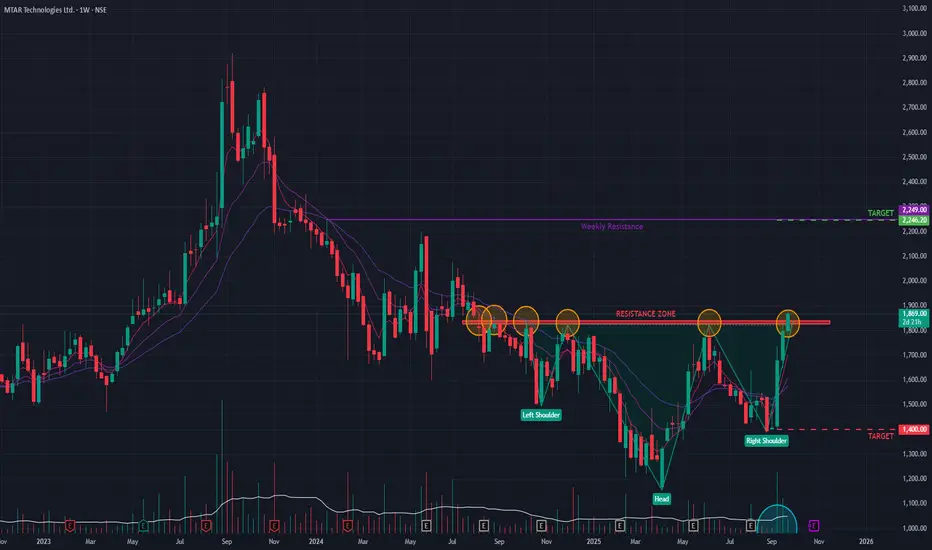
MTAR Tech (W) - Signals Bullish Reversal with Pattern BreakoutMTAR Tech has shown a significant sign of a potential long-term trend reversal. The stock, which has been in a prolonged downtrend since its All-Time High in September 2023, has decisively broken out of an Inverse Head & Shoulders pattern on the weekly chart today.
This classic bullish reversal pattern was confirmed by a strong upward move that breached the neckline, supported by decent trading volume .
Multi-Timeframe Confirmation 👍
The bullish thesis is strongly supported by momentum indicators across all major timeframes:
- Broad Momentum: The Relative Strength Index (RSI) is in a bullish crossover state on the monthly, weekly, and daily charts , indicating synchronized positive momentum.
- Volume Trend: The general trend of building volume suggests increasing buyer participation and conviction in the upward move.
Future Outlook and Key Levels
The breakout from this major reversal pattern suggests the downtrend that began in mid-2023 may be over. The price action in the coming days will be crucial for confirmation.
- Bullish Case 📈: If the breakout momentum is sustained, the stock could be on a path toward the next major resistance level near ₹2,245 .
- Bearish Case 📉: However, if the breakout fails to hold and momentum wanes, the stock could pull back to test support around the ₹1,400 level.
#SUBROSAsset: Subros Ltd (SUBROS)
Breakout Level: 890
Potential Target: 1075
Stop Loss: 850 (~4%)
Timeframe: Short to Low Medium term
Risk to Reward ratio : 1:2
Rationale:
Fundamentals -
Fundamentally decent stock with the following attributes:
* ROCE - 20.9%
* ROE - 14.7%
* Debt to Equity - 0.00
* Stock PE 36.3 / Industry PE - 33.3 || Stock PBV 5.19 / Industry PBV 4.21 - Company is slightly overpriced
* EPS / Revenue - Increasing
Technicals -
⦁ The price has started to bounce off of 50% retracement which coincided roughly with the 100 DMA
⦁ The 200 DMA slope is giving a positive expectancy
⦁ 10 DMA is beginning to go above the 20 DMA indicating a short term move
⦁ Low volume pull back / consolidation
⦁ Price was generally in an uptrend and then experienced a pull back of ~27% (less than 30%)
Market analysis
* FIIs and Promoters have held steady without any sign of dilution
⦁ MFs are increasing stake this quarter
Cons
* Upside potential forecast is limited however that is speculative
This analysis is for educational purposes only and should not be considered as financial advice. Trading and investing in financial markets involve significant risk, and past performance is not indicative of future results. You should conduct your own research and consult with a qualified financial advisor before making any trading or investment decisions. The author is not responsible for any financial losses or damages that may result from the use of this information.

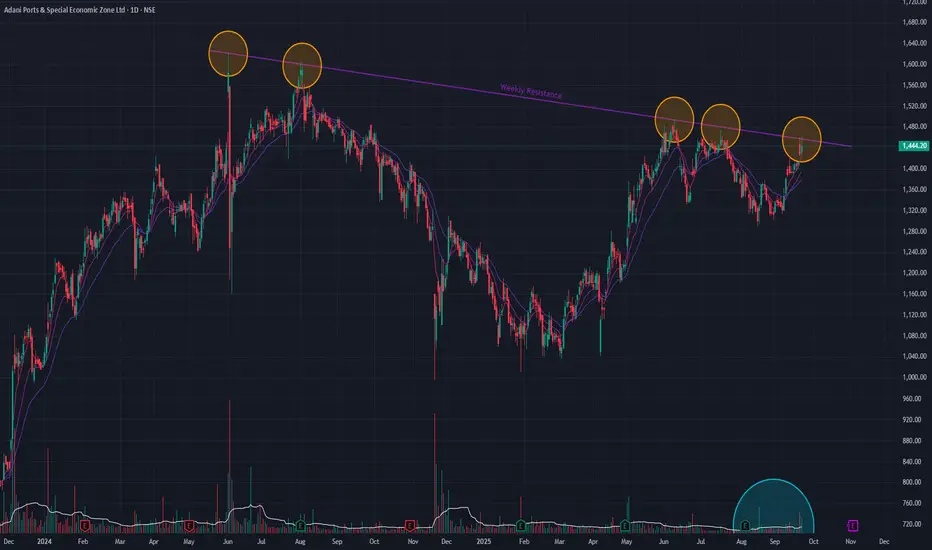
Adani Ports (Daily) - Coils for Potential BO at Critical ResAdani Ports is currently testing a significant long-term angular resistance trendline , a barrier that has persisted since the stock's All-Time High in June 2024. The stock has been in a sideways consolidation phase since March 2025, following a prolonged downtrend, and is now showing signs of building pressure against this key resistance.
Recent price action suggests a growing determination to break through, with breakout attempts becoming more frequent . Today's session saw a notable increase in trading volume, adding weight to this observation.
Broad-Based Bullish Signals 👍
The bullish case is strengthened by a confluence of indicators across multiple timeframes:
- Strong Momentum: On both the daily and weekly charts , short-term Exponential Moving Averages (EMAs) are in a bullish crossover state.
- Dual Confirmation: This is further corroborated by the Relative Strength Index (RSI) on both timeframes, which is also exhibiting a bullish crossover, confirming broad-based positive momentum.
Outlook: Awaiting Confirmation
The stock is at a critical inflection point. While multiple indicators are signaling a strong potential for an upward move, the long-term resistance remains a formidable obstacle. The price action in the coming days will be decisive. A confirmed breakout would signal the next major leg up, but until then, a cautious approach is warranted while waiting for the market to show its hand.
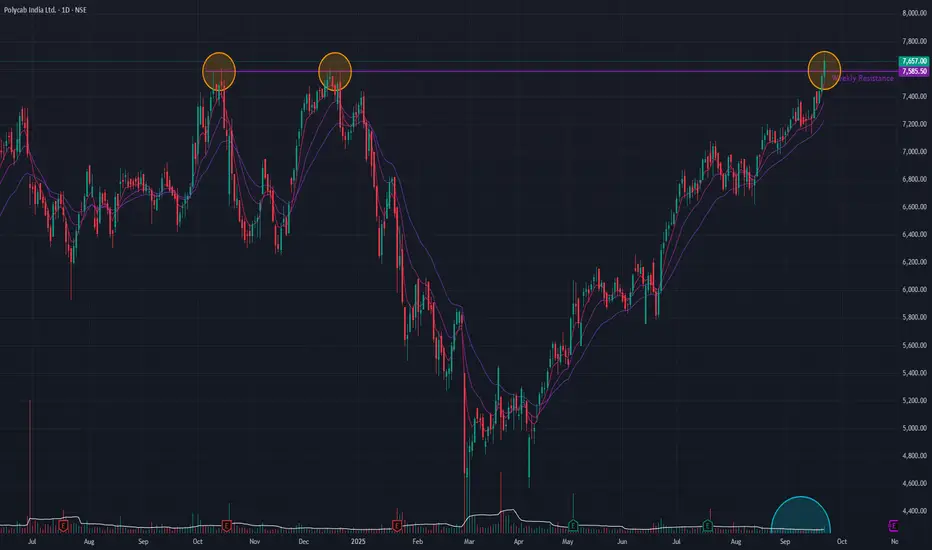
Polycab (Daily) - Reaches New ATH with Decisive BreakoutPolycab has demonstrated exceptional strength, achieving a new All-Time High (ATH) today. The stock decisively broke out of a significant long-term horizontal resistance level , a move that was confirmed by a healthy surge in trading volume.
This breakout is the latest milestone in a powerful rally that began from a Double-Bottom pattern in April 2025 . Since that point, the stock has surged over 65% to date.
Broad-Based Bullish Confirmation 👍
The bullish momentum is confirmed across multiple indicators and timeframes:
- Sustained Volume: Trading volume has remained consistently around the average in the recent past, indicating steady accumulation and persistent buyer interest.
- Daily Momentum: On the daily chart, both the short-term Exponential Moving Averages (EMAs) and the Relative Strength Index (RSI) are in a strong bullish crossover state.
- Weekly Strength: This positive sentiment is echoed on the weekly timeframe , where the EMAs and RSI also confirm a powerful bullish momentum, suggesting strength on a larger scale.
Outlook: Monitoring for Confirmation
Overall, Polycab is in a clear and powerful bullish trend. A common post-breakout behavior could involve the stock retesting the previous resistance level as new support .
The price action in the coming days will be crucial to watch. A successful retest would confirm the breakout's strength and suggest a continuation of the upward trend. Therefore, observing this near-term price action is vital before making any further decisions.
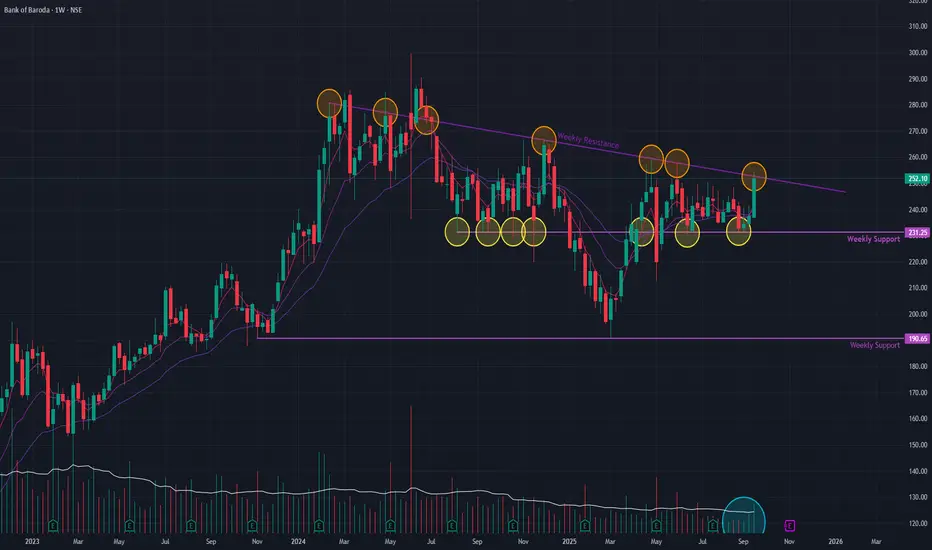
Bank of Baroda (Weekly) - Potential BreakoutBank of Baroda (BoB) is showing renewed strength as it challenges a key resistance level. The stock, which has been in a consolidation phase since its All-Time High in June 2024, made a significant upward move this week with a +6.15% price surge , backed by exceptionally high volume.
This powerful move brings the stock directly to a critical angular resistance trendline . This trendline has previously rejected several breakout attempts, establishing it as a major hurdle.
Bullish Indicators Signal Growing Strength 👍
The recent price action is supported by several positive technical signals:
- Volume Surge: The sharp price increase was accompanied by massive trading volume , indicating strong conviction from buyers.
- Momentum Confirmation: Both the short-term Exponential Moving Averages (EMAs) and the Relative Strength Index (RSI) have shifted into a positive crossover , confirming that bullish momentum is building.
Outlook: A Decisive Week Ahead
The stock is now at a critical juncture. The price action in the upcoming week will be crucial in determining whether this renewed momentum is strong enough to finally break through the persistent resistance. A successful breakout could signal the end of the consolidation phase, while another rejection could extend the sideways trend.