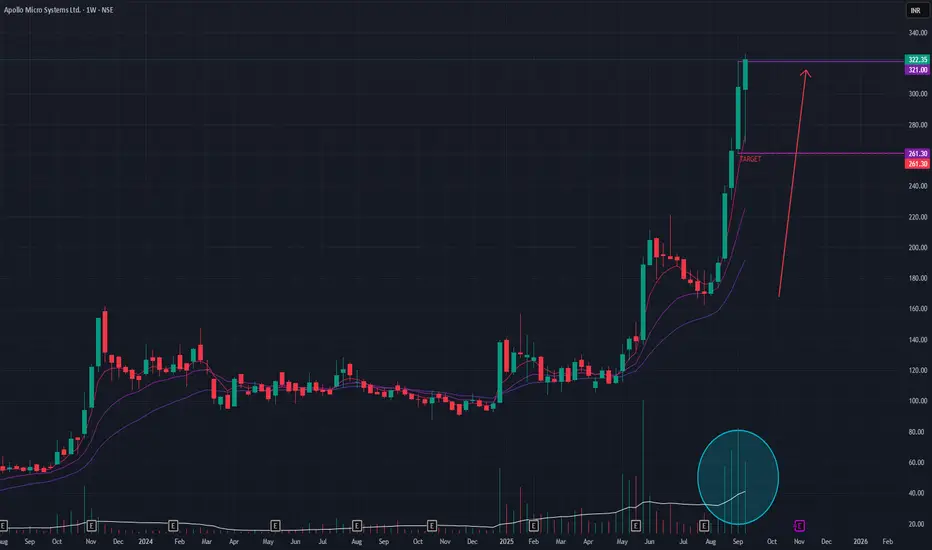
Apollo Micro Systems (Weekly Timeframe) - Momentum to continue ?Apollo Micro Systems has been in a steep, aggressive uptrend since August 2025, delivering a remarkable +92% return in a short period. The stock is exhibiting classic signs of strong bullish momentum, but the velocity of the rise warrants a closer look at its sustainability.
## Bullish Momentum Indicators 📈
Exceptional Volume: The rally has been supported by extraordinary trading volume for the past four to five weeks, indicating significant and sustained buying interest.
Technical Strength: The short-term Exponential Moving Averages (EMAs) are in a Positive Crossover (PCO) state, confirming the powerful upward momentum.
Buyer Conviction: The recently formed weekly candle indicates strong demand and suggests that buyers remain in control of the trend.
## Outlook and Key Levels
While the trend is undeniably strong, the rapid ascent raises the possibility of near-term profit-booking. Such a pullback could be a healthy correction, potentially offering more favorable entry points for those who missed the initial move.
Upside Potential: If the current momentum continues, the stock could surge towards the next logical target of ₹376.
Downside Risk: A correction or loss of momentum could see the stock pull back to test the support level around ₹261.
In summary, while the underlying trend remains powerful, traders should be mindful of the potential for increased volatility after such a sharp and rapid advance.
Volume
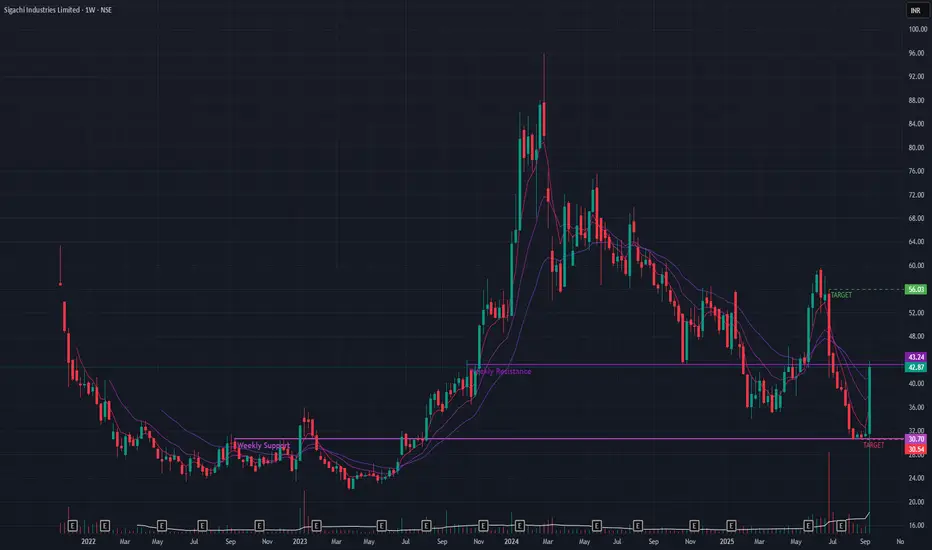
Sigachi Ind (Weekly Timeframe) - Is this the trend reversal?After a period of decline following its February 2024 peak, Sigachi Industries has shown a dramatic burst of momentum. However, the stock has now reached a critical juncture, and confirmation is required to suggest a sustainable trend reversal.
## Recent Price Action
A massive +36.27% rally last week, backed by exceptionally high volume , has put the stock back on the radar. This surge has pushed the price directly against a significant long-term resistance trendline . A breakout above this level would be a major technical victory for the bulls.
## Cautionary Signals to Consider
Despite the powerful rally, several indicators suggest a "wait-and-see" approach:
Trend Confirmation: The stock has not yet formed a higher low , a key technical signal required to confirm a reversal from a downtrend to an uptrend.
EMA Posture: The short-term Exponential Moving Averages (EMAs) have not yet achieved a Positive Crossover (PCO) . This indicates that the recent surge, while strong, has not yet been sustained long enough to reverse the short-term trend momentum.
## Key Levels and Outlook
The stock is at a clear decision point.
Bullish Scenario: A decisive breakout above the current resistance trendline, again on high volume , would be a strong bullish signal. If this occurs, the next potential upside target is the ₹56 level.
Bearish Scenario: If the stock fails to breach this resistance and the momentum fades, it could fall back to test support near the ₹30 level.
Wait for further price-action !!
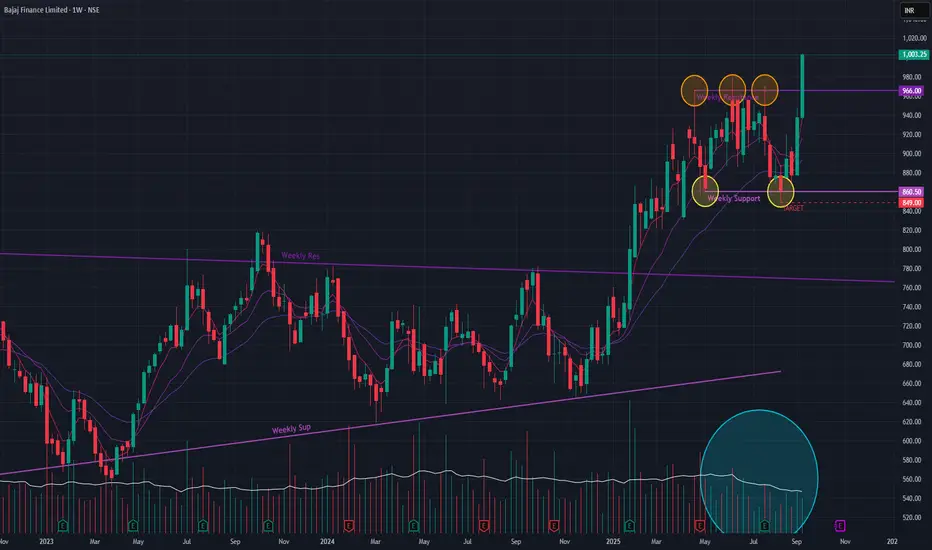
Bajaj Finance (Weekly Timeframe) - Making new ATHAfter a multi-month sideways consolidation from April to September 2025, Bajaj Finance has signaled a potential resumption of its primary uptrend. This recent price action mirrors a similar pattern seen from October 2021 to January 2025, which was followed by a powerful rally to new all-time highs.
## Recent Bullish Developments 📈
Pattern Breakout: The stock decisively broke out of its recent sideways range last week, surging +7% on strong volume & a new ATH. This move indicates a shift from balance to imbalance, with buyers taking firm control.
Sustained Momentum: The buying pressure has continued, resulting in a rally of over 14% in the past two weeks.
Technical Confirmation: The short-term Exponential Moving Averages (EMAs) are in a Positive Crossover (PCO) state, a classic bullish indicator that supports the case for continued upward momentum.
## Outlook and Key Levels
The breakout suggests that the stock is poised to challenge its previous highs.
Upside Potential: If the current momentum is sustained, the next logical price target in the near term is the ₹1,077 level.
Downside Risk: Should the breakout fail and momentum wane, the stock could pull back to test the support zone around ₹849 .
The key factor to watch is trading volume. While the initial breakout volume was good, sustained buying interest is needed to fuel the next leg of the rally.
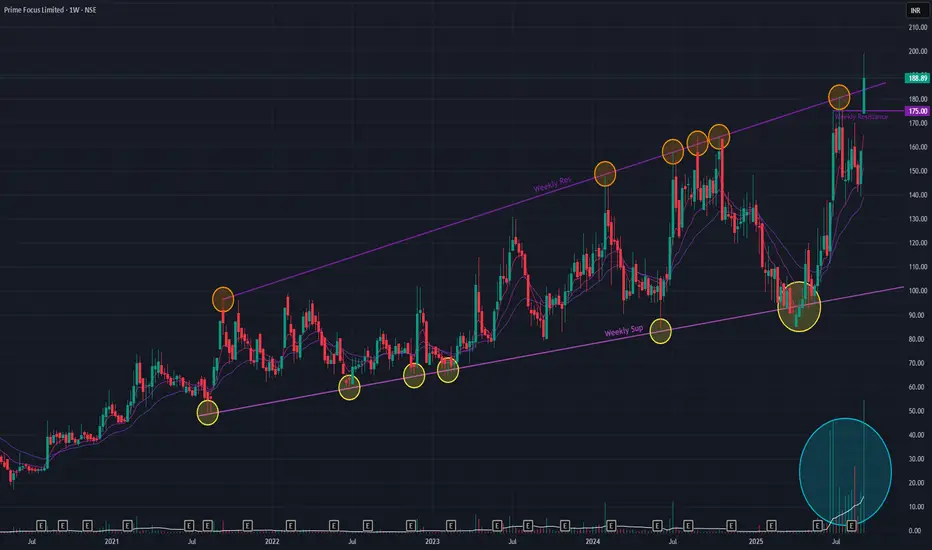
Prime Focus (Weekly Timeframe) - Will the momentum continue ?Prime Focus is exhibiting exceptional strength, building upon a remarkable long-term uptrend. Since May 2020, the stock has delivered a staggering 1,019% return. Recent price action suggests this rally is not only continuing but potentially accelerating.
## Key Bullish Developments 📈
Dual Resistance Breakout: Last week, the stock decisively broke through two critical levels: a short-term resistance trendline and, more importantly, a significant long-term angular resistance. This signals the resolution of a major consolidation phase in favor of the bulls.
Volume Confirmation: The breakout was validated by exceptionally high trading volume , indicating strong institutional interest and conviction behind the move, which culminated in a +19.27% surge for the week.
Technical Strength: The short-term Exponential Moving Averages (EMAs) are in a Positive Crossover (PCO) state, a classic bullish sign of underlying momentum. Furthermore, the stock has consistently respected its long-term support trendline throughout its multi-year advance.
## Outlook and Strategy
While the breakout is decisively bullish, a minor pullback or consolidation in the short term would be healthy due to potential profit-booking after such a sharp rally.
Overall, the powerful breakout on massive volume suggests that Prime Focus has entered a new phase of its uptrend. The stock is now well-positioned to challenge its previous All-Time Highs (ATHs) in the near future.
Watch the coming week's price-action !!
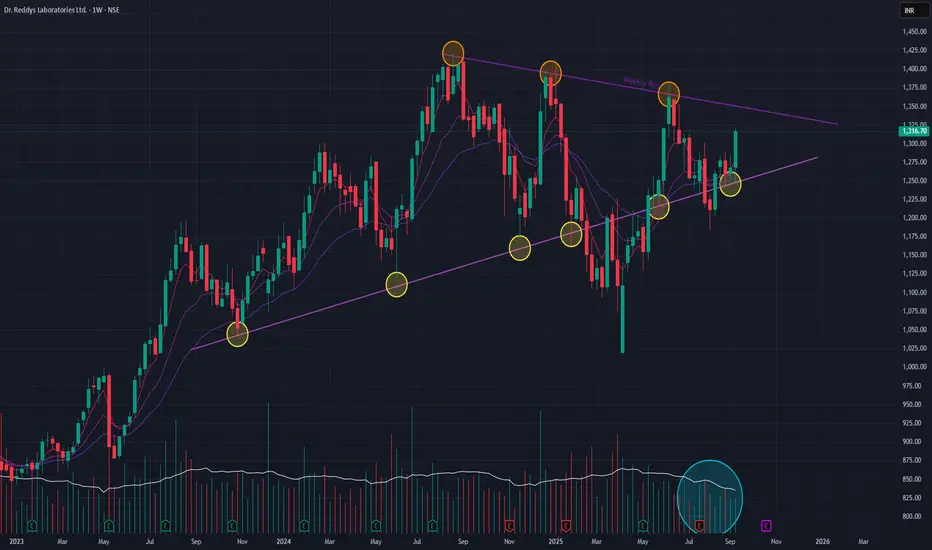
Dr. Reddy's (Weekly Timeframe) - Potential BreakOut?Dr. Reddy's Laboratories is currently in a phase of strategic consolidation. After a remarkable 93.63% uptrend that began in March 2022, the stock has settled into a well-defined triangle formation since August 2024. This pattern suggests a temporary equilibrium between buyers and sellers as the market digests previous gains.
The technical underpinnings remain constructive. The Positive Crossover (PCO) in the short-term EMAs provides a bullish undercurrent, and the resilience of key support levels indicates a solid foundation. The primary scenario we are monitoring is for a bullish continuation.
The key catalyst for the next leg up will be a volume-supported breakout above the triangle's resistance. Such a move would signal the end of the consolidation phase and could propel the stock towards retesting its All-Time High (ATH) . Investors should, however, remain watchful of the trading volume, as it will be the ultimate arbiter of the breakout's validity.
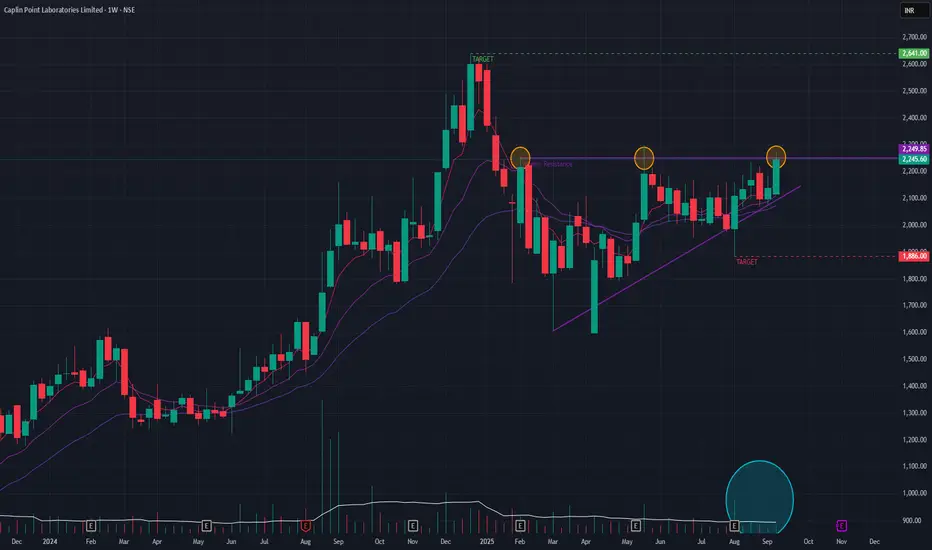
Caplin Point (Weekly Timeframe) - Will the uptrend continue ?After a brief downtrend, Caplin Point has formed a classic triangle pattern , which often acts as a continuation signal for the preceding long-term uptrend. Technical indicators are favorable, with the short-term EMAs arranged in a bullish formation that signals strong underlying momentum.
The one element of caution is that recent trading volumes have been average. Therefore, a breakout from the triangle must be accompanied by a significant increase in volume to validate buyer conviction. If such a breakout occurs, the next logical objective would be the all-time high, which also serves as a key resistance zone at ₹2640 . Conversely, if the pattern fails and momentum wanes, a pullback to the ₹1886 support level is possible.
Watchout for the price-action !!
Explosive Volume Breakout StocksHello Traders!
Today’s session we have an explosive breakout on record volumes. The setup is not only backed by price action but also confirmed by multiple technical indicators such as RSI, Bollinger Bands, SuperTrend, VWAP, and BB Squeeze. Let’s decode this in detail 👇
________________________________________________________________________________
________________________________________________________________________________
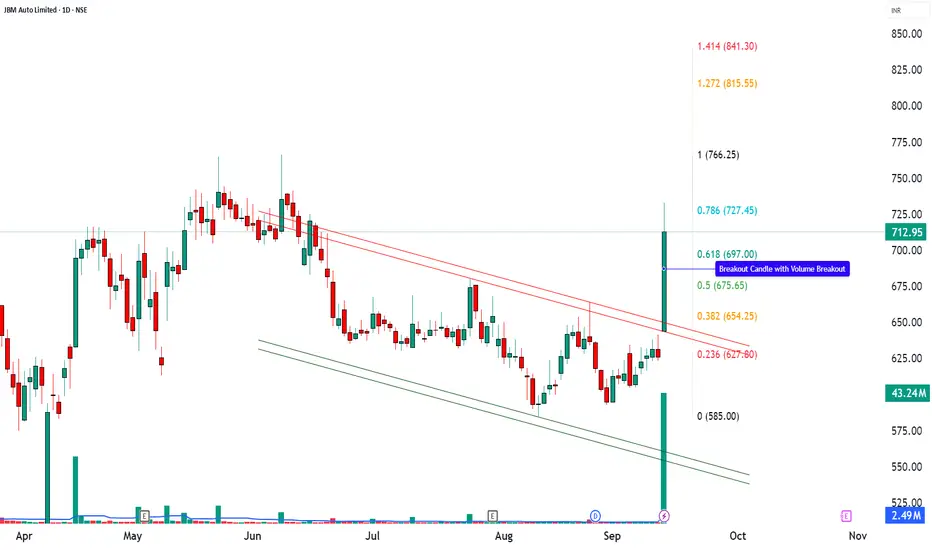
JBM Auto Ltd (NSE: JBMA)
CMP: 712.95 (+13.92%)
Breakout: Strong 52-week volume breakout with momentum
Key Supports: 660 / 608 / 571
Key Resistances: 749 / 785 / 838
Setup Explanation
JBM Auto delivered a powerful bullish breakout candle backed by 20x volume against its average, confirming strong accumulation. The stock has broken a long-term downtrend with a surge in momentum. This looks like a technically strong breakout setup as per chart patterns, but risks remain. The chart highlights multiple bullish signals: RSI breakout ⚡ shows renewed strength. Bollinger Band breakout 📊 signals volatility expansion. Bullish SuperTrend & VWAP align with upward momentum. BB Squeeze Off 🔥 confirms the end of consolidation and beginning of a trending move. As long as the stock holds above 697–712, momentum is likely to extend towards higher resistances, with 843 as a near-term swing target. A sustained close below 607 would negate the bullish structure.
Latest Update – JBM Auto (JBMA)
JBM Auto is buzzing after its subsidiary JBM Ecolife Mobility secured a $100 million investment from IFC, marking IFC’s largest e-mobility funding in India. The capital will accelerate deployment of over 1,400 electric buses across multiple states, boosting JBMA’s already strong ₹12,900 crore order book. The stock surged ~9–11% on record volumes as the news reinforced confidence in India’s EV and green mobility push.
While momentum is strong, analysts also flag elevated valuations, thin margins, and execution risks, making it important for traders to watch key levels closely.
Investment Outlook & Conclusion
Bullish Case – The stock has given a 52-week breakout with 20x average volumes. If momentum sustains, it may attempt levels of ₹749 → ₹785 → ₹815 → ₹838 → ₹843.
Bearish Case – A sustained slip below ₹622 could weaken the structure and open downside risk.
Momentum Case – Current price action with heavy volumes indicates a short-term momentum phase. However, this is a high-risk, high-reward scenario suitable only for aggressive swing setups.
Perspective – Short-term structure is positive, while long-term outcomes will depend on execution of EV bus orders, government policy support, and maintaining profitability margins.
📊 STWP Trade Analysis – JBM Auto (JBMA)
👉 In my chart study, I have marked ₹732.80 as an entry level with ₹621.95 as an invalidation level.
👉 If the stock dips towards ₹627–607 (Pullback Zone), I will treat it as a conservative re-entry with tighter risk.
Invalidation Level: A sustained move below ₹607 will negate my bullish view.
⚠️ This is my swing trading approach as long as supports hold, shared only for learning how I structure trades. It is not a buy/sell recommendation.
________________________________________________________________________________
________________________________________________________________________________
⚠️ Disclaimer – Please Read Carefully
The information shared here is meant purely for learning and awareness. It is not a buy or sell recommendation and should not be taken as investment advice. I am not a SEBI-registered investment advisor, and all views expressed are based on personal study, chart patterns, and publicly available market data.
Trading — whether in stocks or options — carries risk. Markets can move unexpectedly, and losses can sometimes exceed the money you have invested. Past performance or past setups do not guarantee future results.
If you are a beginner, treat this as a guide to understand how the market works — practice on paper trades before risking real money. If you are experienced, always assess your own risk, position sizing, and strategy suitability before entering trades.
Consult a SEBI-registered financial advisor before making any real trading decision. By engaging with this content, you acknowledge full responsibility for your trades and investments.
💬 Found this useful?
🔼 Give this post a Boost to help more traders discover clean, structured learning.
✍️ Drop your thoughts, questions, or setups in the comments — let’s grow together!
🔁 Share with fellow traders and beginners to spread awareness.
👉 “If you liked this breakdown, follow for more clean, structured setups with discipline at the core.”
🚀 Stay Calm. Stay Clean. Trade With Patience.
Trade Smart | Learn Zones | Be Self-Reliant 📊
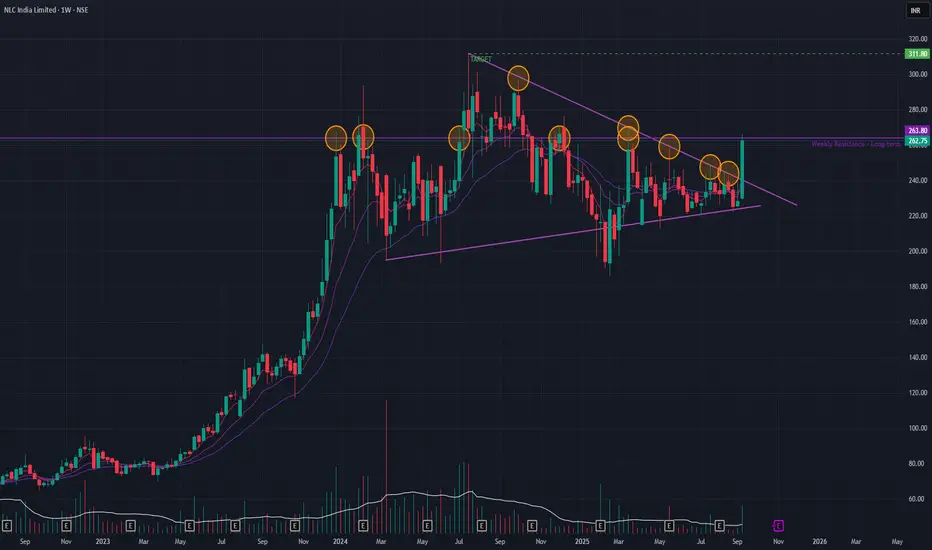
NLC India Ltd (Weekly Timeframe) - Potential BreakOut & ATH ??Following its all-time high, NLC India has been consolidating in a sideways pattern, which can be interpreted as a bullish triangle formation—often a precursor to an uptrend continuation. This thesis was strongly supported this past week by a powerful +14.97% rally on a massive volume spike, indicating a potential end to the consolidation phase.
However, the stock is now confronting a formidable, long-term horizontal resistance level that has been in place for over a decade (since December 2007). This same trendline has rejected multiple breakout attempts since December 2023. For the bullish momentum to translate into a new leg up, NLC India must decisively breach and hold above this historical barrier. A successful breakout could clear the path for a new all-time high and a near-term target of ₹311 .
Price-action will decide the way forward.
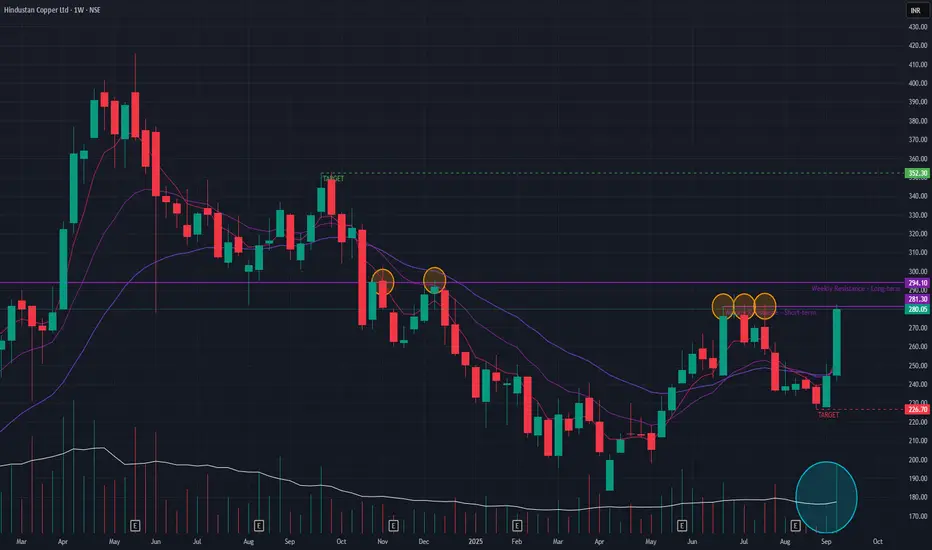
Hind Copper (Weekly Timeframe) - Potential BreakOut Candidate ??After a multi-year uptrend concluding in May 2024, Hindustan Copper entered a corrective downtrend. However, a potential reversal has been forming since April 2025, evidenced by a pattern of higher lows and a constructive setup in its short-term Exponential Moving Averages (EMAs).
This shift in sentiment has been confirmed by a powerful +23.5% rally over the past two weeks, backed by immense trading volume. For the uptrend to continue, the stock must overcome two key hurdles: a near-term horizontal resistance and, more importantly, a multi-year resistance trendline dating back to March 2012. A sustained breach of this long-term resistance would be a significant technical event, potentially paving the way for a move toward ₹352 . Should the breakout fail, a pullback to the ₹226 support zone is possible.
To be monitored !!
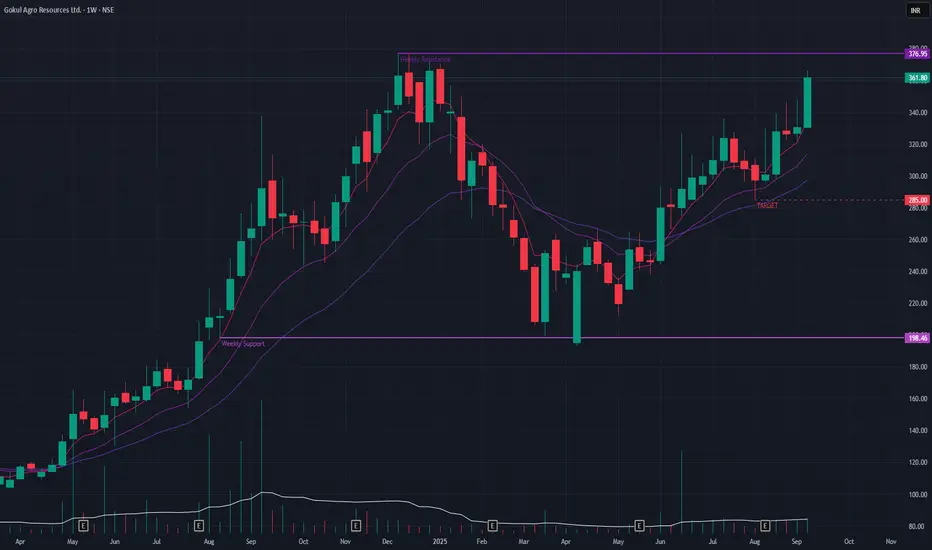
Gokul Agro (Weekly Timeframe) - Can it BreakOut & new ATH ?Gokul Agro has undergone a significant trend reversal, shifting from a downtrend that began in December 2024 to a renewed uptrend since April 2025. This recovery has brought the stock within striking distance of its all-time high (ATH).
Recent price action has been particularly strong, highlighted by a +9.39% gain last week, which was supported by healthy trading volumes, indicating strong buyer conviction. Further technical confirmation comes from the short-term EMAs, which are stacked in a bullish formation, signaling strong upward momentum.
A sustained push through the current resistance could propel the stock to a new ATH. Beyond that, the next projected technical target is the ₹490 level. Conversely, a failure to break out could see the price pull back to the primary support zone around ₹285 .
Monitor the price-action !!
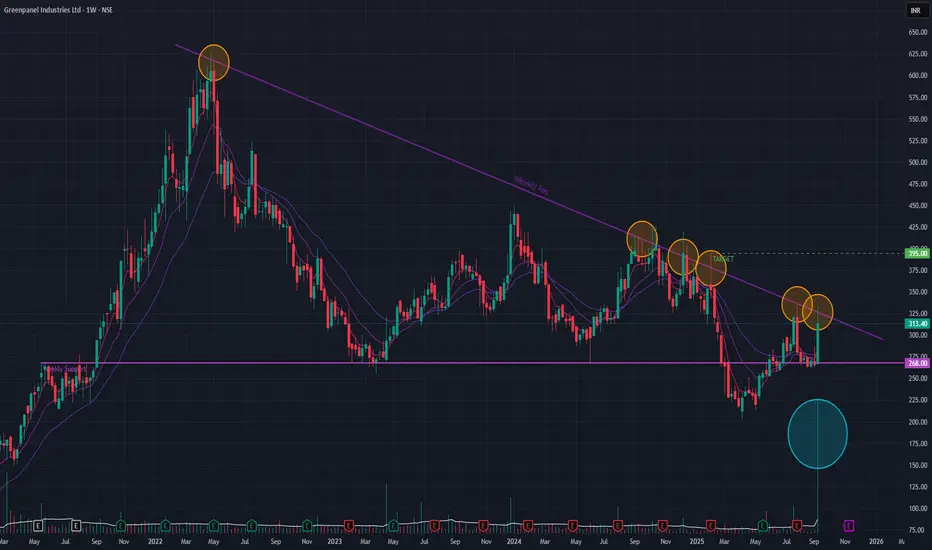
Greenpanel Ind (Weekly Timeframe) - Can it Breakout??After a prolonged downtrend since its peak in April 2022, Greenpanel is exhibiting noteworthy behavior. The stock has repeatedly faced rejection at a critical long-term angular trendline, a key resistance level. However, this past week marked a significant departure from that pattern, with the stock climbing +17.86% accompanied by a massive surge in volume.
This powerful move indicates strong accumulation and a potential exhaustion of sellers. Should the buying interest persist, a realistic near-term objective for Greenpanel would be the ₹395 price level.
Watchout for the price-action !!
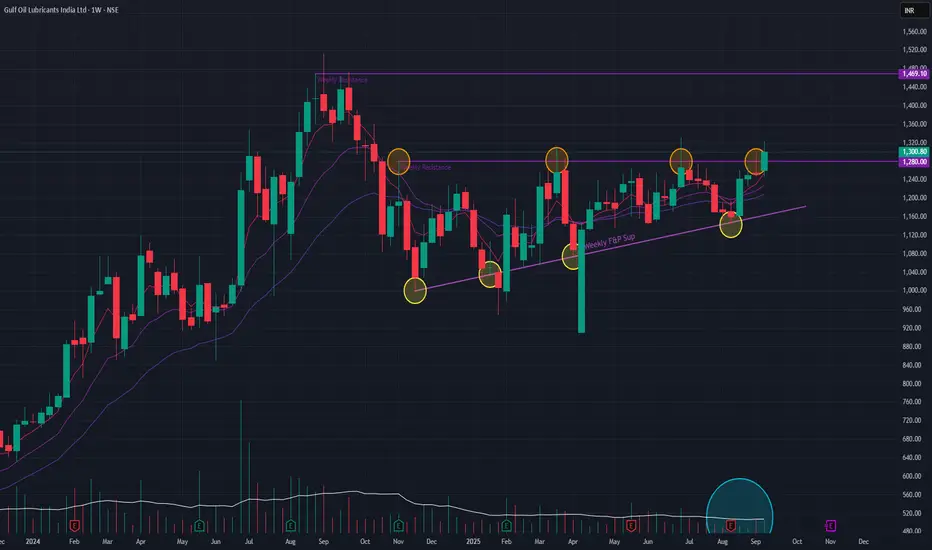
Gulf Oil (Weekly Timeframe) - Potential BreakOut & ContinuationTechnical analysis of Gulf Oil reveals a promising setup. The stock has formed a classic triangle pattern , indicating a period of consolidation before a likely continuation of its preceding uptrend. This week, we've observed a significant breakout attempt, which is notable as it follows multiple rejections from the pattern's upper trendline.
For this breakout to be considered valid, it must be accompanied by a surge in trading volume , confirming buyer conviction. If these conditions are met, the stock could challenge its all-time high of ₹1469 . Further reinforcing this positive sentiment, the short-term EMAs are in a bullish configuration, signaling that momentum is currently in favor of an upward move.
Mazagaon Dock Cmp 2925 Rectangle BOMazagaon Dock Cmp 2925 dated 12-9-2025
1. Rectangle BO done @ 2910
2. Rise in Volume
Buy above 2930 SL 2840 target 2950-2970-2985-
3000-3025-3040-3065-3095-3125-3140-3175-3200-
3225
It is just a view, please trade at your own risk.

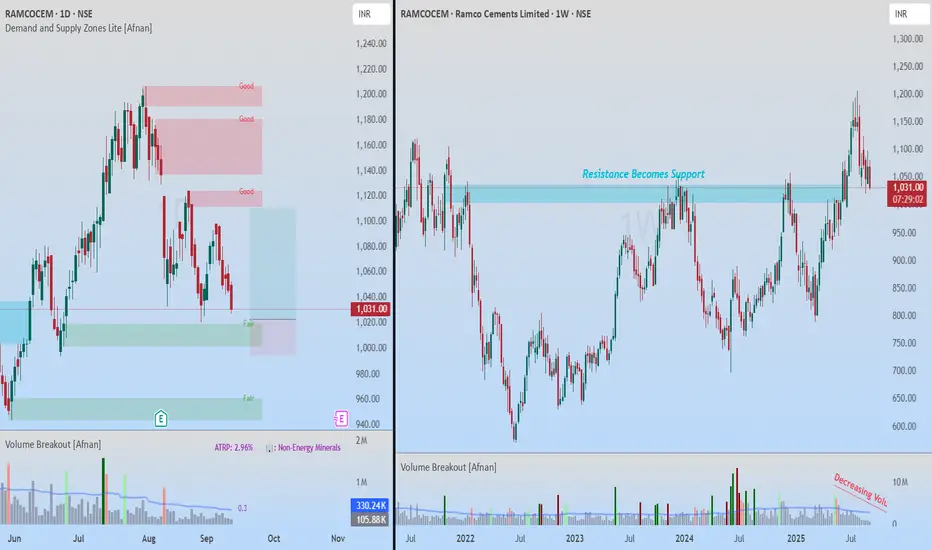
Dual Lens Analysis: Demand & Supply Meets Breakout Retest📊 Supply & Demand View 📊
Supply and demand zones are essentially institutional footprints . Large players never execute their full orders at once; instead, they build positions in chunks. This behavior leaves behind visible imbalances on the chart. Whenever price revisits these zones, strong reactions are often seen.
On the daily chart of Ramco Cements , price has reacted multiple times near a demand zone without fully testing it. Each time, we witnessed a bounce — a sign of heavy buying interest.
Now, the stock is once again approaching this zone for the third time, which statistically makes it a strong area to monitor. The weekly chart structure also shows higher highs and higher lows, signaling that the broader trend is bullish. With no immediate higher timeframe supply overhead, the setup offers a 1:3 favorable risk-to-reward scenario.
🚀 Breakout Retest View 🚀
On the weekly chart , Ramco Cements displays a textbook breakout retest. After years of respecting a major resistance level, price finally broke out, created fresh all-time highs, and is now pulling back to retest that very level.
This aligns perfectly with the principle of polarity: old resistance often flips into strong support.
Volume adds further conviction. Post-breakout, volume has been drying up during the pullback — an indication that sellers lack conviction.
✨ Final Takeaway ✨
Both perspectives — demand zone strength and breakout retest confirmation — are aligning bullishly. This confluence strengthens the case for Ramco Cements to resume its upward journey.
💡 Risk Management Reminder 💡
While the setup looks strong, risk management remains key. Always use SL and size positions carefully. Even the best setups can fail, but disciplined risk control ensures long-term success.
“In trading, patience and discipline are often the real edge.”
🔄 Stay disciplined, stay consistent — the market rewards those who wait! 🔄
This analysis is purely for educational purposes and is not intended as a trading or investment recommendation. I am not a SEBI registered analyst.
Explosive Volume Breakout StocksHello Traders! Today’s session was packed with action as several midcap names showed explosive breakouts on record volumes. These setups are not only backed by price action but also confirmed by multiple technical indicators such as RSI, Bollinger Bands, SuperTrend, VWAP, and BB Squeeze. Let’s decode them in detail 👇
1️ Greenpanel Industries Ltd (NSE: GREENPANEL)
CMP: ₹322.15 (+18.09%)
Breakout with Heavy Volumes
Key Supports: ₹288 / ₹254
Resistances: ₹341 / ₹361 / ₹395
🔑 Strong 52-week breakout with bullish follow-through. Sustaining above ₹288 could keep the momentum alive.
The stock witnessed a 52-week volume breakout, supported by a strong bullish candle that confirms aggressive buying interest. The RSI has broken out, highlighting fresh momentum, while the Bollinger Band breakout shows volatility expansion after a period of consolidation. Alongside this, the Bullish SuperTrend and VWAP indicators confirm trend alignment with volume, suggesting institutional participation. Interestingly, the BB Squeeze turning off signals that the low-volatility phase has ended, and the stock may now enter a trending move.
________________________________________
2️ Indoco Remedies Ltd (NSE: INDOCO)
CMP: ₹308.60 (+11.47%)
RSI Breakout + Volume Expansion
Key Supports: ₹280 / ₹252
Resistances: ₹334 / ₹360 / ₹388
🔑 Open = Low + strong bullish candle. Short-term traders may keep an eye on ₹280 as support.
Indoco Remedies also recorded a powerful 52-week volume breakout, signaling accumulation at higher levels. The RSI breakout validates the momentum shift, while the “open = low” pattern reflects intraday buying from the very start of the session. The Bollinger Band breakout points to volatility expansion, and the Bullish SuperTrend along with VWAP confirms that both trend and volume are favoring the bulls. Additionally, the BB Squeeze compression breakout shows that the stock has just moved out of a tight consolidation, opening the doors for a strong upside continuation.
________________________________________
3️ Piccadilly Agro Industries Ltd (NSE: PICCADIL)
CMP: ₹723.80 (-13.58%)
Strong Bullish Candle on Massive Volumes
Key Supports: ₹660 / ₹598
Resistances: ₹765 / ₹806 / ₹869
🔑 Despite closing off highs, volumes indicate institutional interest. Watch ₹660 as a key level.
Piccadilly Agro displayed a strong bullish candle backed by exceptional volumes, which suggests fresh interest from market participants. The RSI breakout supports the strength of the momentum, while the Bollinger Band breakout indicates that the stock has entered a new volatility phase. Both Bullish SuperTrend and VWAP confirm that the price move is well-supported by trend-following and volume-based systems. With the BB Squeeze off, the compression phase has ended, further confirming the possibility of an extended rally if key supports hold.
________________________________________
4️ SMS Pharmaceuticals Ltd (NSE: SMSPHARMA)
CMP: ₹300.55 (+12.14%)
52-Week Volume Breakout
Key Supports: ₹273 / ₹247
Resistances: ₹319 / ₹339 / ₹365
🔑 Stock showing bullish momentum with multiple indicator confirmations. A close above ₹319 may trigger the next leg.
SMS Pharma registered a 52-week volume breakout combined with short-term bullish momentum, indicating a strong change in trend. The RSI breakout highlights renewed momentum, and the Bollinger Band expansion reflects volatility returning after consolidation. The Bullish SuperTrend and VWAP are both in sync with the buyers, suggesting sustainable strength. The BB Squeeze turning off is another confirmation that the quiet phase is over, and the stock could witness directional movement. Overall, multiple indicators align to suggest that this breakout has solid backing from both price and volume action.
________________________________________
💡 Technical Takeaway:
When volume expansion aligns with RSI, Bollinger Bands, and SuperTrend confirmations, breakouts have higher chances of sustaining. Always track key support levels for validation.
⚠️ Disclaimer – Please Read Carefully
The information shared here is meant purely for learning and awareness. It is not a buy or sell recommendation and should not be taken as investment advice. I am not a SEBI-registered investment advisor, and all views expressed are based on personal study, chart patterns, and publicly available market data.
Trading — whether in stocks or options — carries risk. Markets can move unexpectedly, and losses can sometimes exceed the money you have invested. Past performance or past setups do not guarantee future results.
If you are a beginner, treat this as a guide to understand how the market works — practice on paper trades before risking real money. If you are experienced, always assess your own risk, position sizing, and strategy suitability before entering trades.
Consult a SEBI-registered financial advisor before making any real trading decision. By engaging with this content, you acknowledge full responsibility for your trades and investments.
💬 Found this useful?
🔼 Give this post a Boost to help more traders discover clean, structured learning.
✍️ Drop your thoughts, questions, or setups in the comments — let’s grow together!
🔁 Share with fellow traders and beginners to spread awareness.
👉 “If you liked this breakdown, follow for more clean, structured setups with discipline at the core.”
🚀 Stay Calm. Stay Clean. Trade With Patience.
Trade Smart | Learn Zones | Be Self-Reliant 📊
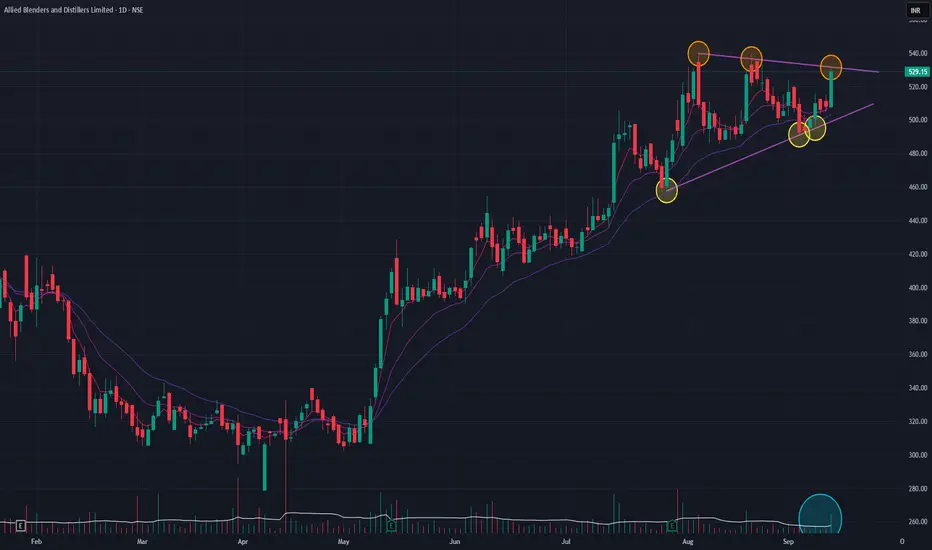
ABDL (Daily Timeframe) - Can it continue the uptrend ??ABDL is in a confirmed uptrend, having rallied over 90% since its April 2025 lows. The stock is now consolidating within a bullish triangle pattern , which typically signals a continuation of the prior trend.
This bullish outlook is supported by several key factors:
Today's significant price surge was accompanied by a massive spike in volume, confirming strong buyer interest and a potential breakout.
The short-term Exponential Moving Averages (EMAs) are in a Positive Crossover (PCO) state , indicating strong underlying momentum.
If the breakout from the triangle is sustained, the next potential price target is the ₹614 level.
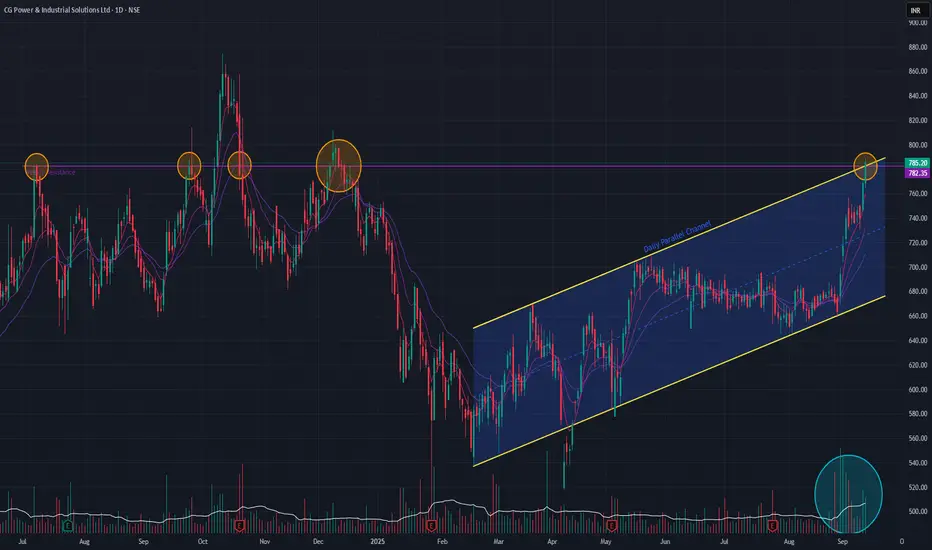
CG Power (Daily Timeframe) - Potential BreakOut CG Power has been consolidating below a major horizontal resistance line established in July 2024, which has so far prevented new all-time highs. Following a downtrend that began in October 2024, the stock has been trading within a well-defined parallel channel.
Today's price action is particularly bullish, as the stock is attempting a breakout from a confluence of resistance: the top of the parallel channel and the long-term horizontal trendline.
This significant move is supported by two key technical indicators:
The short-term EMAs are in a Positive Crossover (PCO) state.
An SMA Golden Cross occurred just a few days ago.
A sustained breakout above this confluence would be a strong signal that the uptrend is resuming.
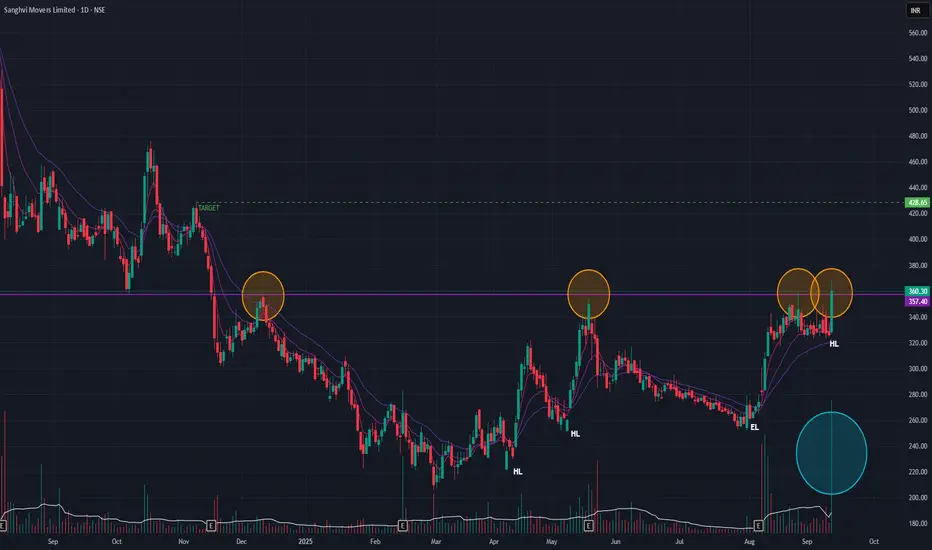
Sanghvi Movers (Daily Timeframe) - Potential BreakOut ??Sanghvi Movers has been in a corrective downtrend since peaking at its all-time high in May 2024. A notable shift in market structure appeared in March 2025, with the stock starting to print a series of higher lows —an early sign of a potential trend reversal.
A significant horizontal resistance, established in August 2023, has capped multiple rally attempts. Today, however, the stock challenged this level with conviction, closing +10.45% higher on massive volume , which suggests strong institutional interest. Bullish sentiment is further reinforced by a recent Simple Moving Average (SMA) Golden Cross.
While we await a confirmatory Positive Crossover (PCO) on the short-term Exponential Moving Averages (EMAs) , a sustained breakout above this resistance could signal the start of a new uptrend. The next logical price target on a successful breakout would be the ₹428 zone.
GreenPly Ind (Daily Timeframe) - Will it BreakOut?Greenply was in a downtrend since Aug 2024 and the trend reversed since Mar 2025. A Long-Term angular resistance that had formed since Aug 2024 has not been breached even after multiple tries. Today the stock made a positive BreakOut with exceptionally huge volume. At the same time, a Long-Term resistance from Dec 2017 is more significant. Short-term EMAs are yet to form PCO state, but we can already see Golden Cross-over since few days.
Will this BreakOut sustain? Let's watchout.

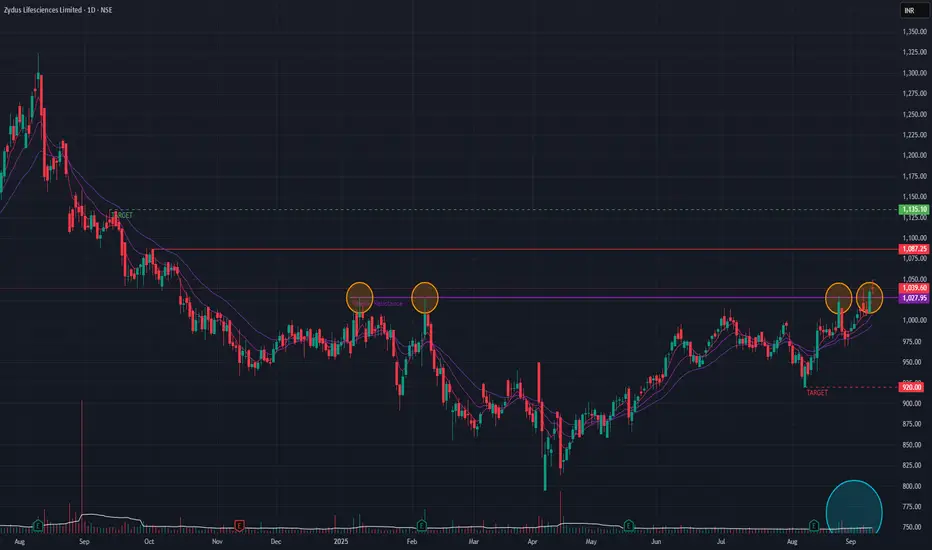
Zydus Life (Daily Timeframe) - Potential BreakOut candidate ??Zydus Lifesciences BrokeOut of a major resistance zone (since Oct 2024) couple of days back and it re-tested the zone again today. The volume is above average though. Short-term EMA's are in PCO state which indicates bullishness.
If the BreakOut sustains then we may see the stock reaching levels of 1135. We may see levels of 920 if the BreakOut does not sustain.
Price-action is to be monitored !!
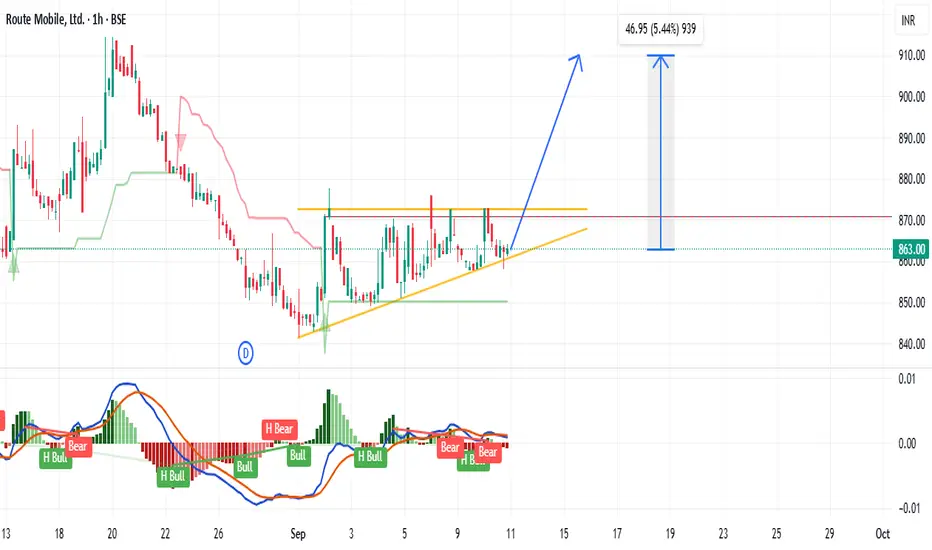
Route Mobile – Ascending Triangle Breakout Ahead on 1H timeframeRoute Mobile is showing strong technical momentum with an Ascending Triangle Breakout visible on the 1-hour chart. Price has broken above the resistance zone with notable volume support, signaling bullish strength.
Upside Potential: ~6% and possibly more if momentum sustains
Trigger Point: Breakout above resistance confirms fresh buying interest
Why this is significant:
The Ascending Triangle is a bullish continuation pattern. It forms when buyers steadily push prices higher with rising lows, while resistance holds firm. Once the resistance is decisively broken, it often unlocks strong upside potential as trapped sellers exit and fresh buyers enter with momentum.
Upside projection is based on the triangle’s height added to the breakout level, aligning with a potential 6% move. If volume sustains above breakout, there could be even more room for price appreciation.
🔎 Key takeaway: Breakout already in play, and Route Mobile looks poised for strong short-term momentum.
TVS Holdings (Daily Timeframe) - Can we expect new ATH ??TVSHLTD BrokeOut of a major resistance that formed since Nov 2024. On a daily basis, the stock did retest the trendline and moved up today which is a positive indication. This was accompanied with good volume. In the Weekly timeframe the stock is indicating bullish momentum as well as Short-term EMAs are in PCO state.
On the upside, we may see the stock reaching 14,495 levels if the momentum continues. While on the downside, it may reach 11,667 levels as well if there is a trend reversal.
Keep watching the price-action !!

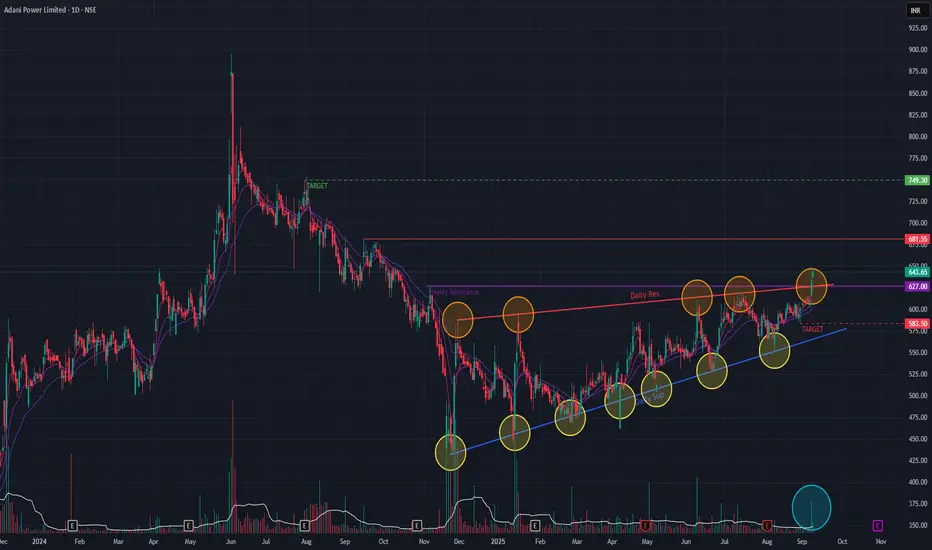
Adani Power (Daily Timeframe) - Bullish BreakOut or NotAdani Power has been in an uptrend since Nov 2024 & has formed a Triangle pattern. The past two days it has BrokenOut of the Triangle pattern with exceptionally huge volume indicating buyer interest. Short-term EMAs are in PCO state as well as the stock has breached two major resistance trendlines asserting Bullishness. A Golden Cross-over has formed since few days, indicating Bullishness
We may see levels of 749 if the momentum continues as well as a major resistance trendline is breached. It may go down to 583 levels if momentum is not sustained.
Keep monitoring the price-action !!