F&O Trading (Futures and Options Trading): A Comprehensive GuideUnderstanding F&O Trading
F&O trading is part of the derivatives market, where the value of contracts is derived from an underlying asset. The underlying asset can be stocks, stock indices (like NIFTY or BANK NIFTY), commodities, currencies, or interest rates. Unlike cash market trading, where investors buy or sell actual shares, F&O trading involves contracts that derive their value from price movements of these assets.
The two main instruments in this segment are Futures and Options, each with distinct characteristics and risk profiles.
Futures Trading Explained
A futures contract is a legally binding agreement between two parties to buy or sell an underlying asset at a predetermined price on a specified future date. In futures trading, both the buyer and seller are obligated to fulfill the contract at expiry unless they exit the position earlier.
Futures are widely used by traders to speculate on price direction. If a trader expects the price of a stock or index to rise, they take a long futures position. If they expect a fall, they take a short futures position. One of the defining features of futures trading is leverage, where traders need to pay only a margin (a fraction of the total contract value) to control a large position.
While leverage increases profit potential, it equally amplifies losses. A small unfavorable movement in price can result in significant losses, making risk management critical.
Options Trading Explained
An options contract gives the buyer the right but not the obligation to buy or sell the underlying asset at a specific price (called the strike price) before or on a specific date (expiry). The seller (or writer) of the option, however, has an obligation to fulfill the contract if the buyer exercises the option.
There are two main types of options:
Call Options: Give the right to buy the asset.
Put Options: Give the right to sell the asset.
Options buyers pay a premium, which is the maximum loss they can incur. This limited-risk feature makes options attractive to beginners. On the other hand, option sellers earn the premium but face potentially unlimited risk, especially in naked option selling.
Options trading allows traders to profit not only from price direction but also from factors like time decay (theta), volatility (vega), and price sensitivity (delta).
Key Differences Between Futures and Options
Futures contracts involve obligation for both parties, while options involve a right for the buyer and obligation for the seller. Futures have linear profit and loss, meaning gains and losses move directly with price changes. Options have non-linear payoffs, allowing for complex strategies such as hedging, income generation, and volatility trading.
Why Traders Use F&O Trading
One of the primary reasons for F&O trading is hedging. Investors use futures and options to protect their portfolios from adverse market movements. For example, an investor holding a large equity portfolio may buy index put options to hedge against a market crash.
Another major use is speculation. Traders attempt to profit from short-term price movements using leverage. Since derivatives require lower capital compared to the cash market, traders can take larger positions.
F&O trading also supports arbitrage opportunities, where price differences between the cash and derivatives markets can be exploited for low-risk returns.
Leverage and Margin in F&O Trading
Leverage is both an advantage and a risk in F&O trading. Traders are required to maintain initial margin and maintenance margin with their brokers. If the market moves against their position, they may receive a margin call, requiring them to add funds.
Poor understanding of margin requirements often leads to forced position closures and heavy losses, especially during volatile market conditions.
Risks Involved in F&O Trading
F&O trading carries significant risk, particularly for inexperienced traders. The major risks include:
High volatility risk, leading to sudden losses
Leverage risk, magnifying losses beyond expectations
Time decay, especially harmful for option buyers
Unlimited loss potential for option sellers
Emotional and psychological pressure, leading to poor decision-making
Many retail traders lose money in F&O trading due to overtrading, lack of strategy, and inadequate risk management.
Risk Management in F&O Trading
Successful F&O trading relies heavily on risk management. Traders must define position size, use stop-loss orders, and avoid risking more than a small percentage of capital on a single trade. Hedged strategies, such as spreads and straddles, help limit losses.
Maintaining discipline, following a trading plan, and avoiding revenge trading are equally important.
Role of Strategy in F&O Trading
F&O trading is not about prediction alone but about probability and strategy. Common futures strategies include trend following and breakout trading. Options strategies range from simple ones like buying calls or puts to advanced strategies such as iron condors, butterflies, calendar spreads, and straddles.
The choice of strategy depends on market conditions—whether the market is trending, range-bound, or highly volatile.
Who Should Trade in F&O?
F&O trading is best suited for traders with:
Strong understanding of market mechanics
Ability to handle risk and volatility
Adequate capital and emotional discipline
Knowledge of technical analysis and derivatives pricing
Beginners should start with education, paper trading, and small position sizes before committing significant capital.
Conclusion
F&O trading is a powerful financial tool that offers immense opportunities for profit, hedging, and portfolio optimization. However, it is not a shortcut to quick wealth. The same leverage that amplifies gains can also magnify losses. Success in F&O trading requires deep knowledge, disciplined execution, robust risk management, and continuous learning.
For traders who respect its complexity and approach it with patience and preparation, F&O trading can become a valuable component of long-term market participation. For those who treat it as gambling, it often results in significant financial loss. Understanding the mechanics, risks, and strategies is the first and most crucial step toward sustainable success in the F&O segment.
Wave Analysis

How Large-Scale Forces Shape Global Markets and EconomiesMacro Events Impact:
Macro events are large-scale economic, political, financial, and social developments that influence entire countries, regions, or the global system. Unlike company-specific or sector-specific factors, macro events operate at a broader level and often create ripple effects across markets, industries, currencies, and investor sentiment. Understanding the impact of macro events is essential for policymakers, businesses, investors, and individuals, as these forces determine economic cycles, capital flows, and long-term growth trends.
1. Understanding Macro Events
Macro events refer to significant developments that affect the overall economic environment. These include interest rate changes, inflation trends, geopolitical conflicts, pandemics, technological disruptions, climate events, and major policy decisions. Because they influence supply, demand, liquidity, and confidence at a systemic level, macro events often trigger widespread reactions across financial markets and real economies.
Such events are usually beyond the control of individual firms or investors, yet their impact can be profound. A single macro decision—such as a central bank raising interest rates—can alter borrowing costs, investment behavior, consumption patterns, and asset valuations globally.
2. Monetary Policy and Interest Rate Decisions
One of the most powerful macro events is a change in monetary policy by central banks. Interest rate hikes or cuts influence inflation control, economic growth, and currency strength. When rates rise, borrowing becomes expensive, slowing down consumption and investment. Equity markets often react negatively, while bonds and currencies may strengthen depending on expectations.
Conversely, rate cuts aim to stimulate economic activity by encouraging spending and investment. Liquidity injections through quantitative easing can push asset prices higher, sometimes creating asset bubbles. Markets closely track central bank communication, as even small signals or guidance can cause volatility.
3. Inflation and Economic Growth Data
Inflation reports, GDP growth numbers, employment data, and industrial production figures are key macro indicators. Higher-than-expected inflation reduces purchasing power and forces policymakers to tighten monetary conditions. This can lead to stock market corrections, higher bond yields, and currency fluctuations.
Strong economic growth data usually supports equity markets, but if growth is accompanied by rising inflation, the positive effect may be short-lived. Weak data, on the other hand, raises fears of recession, reducing risk appetite and increasing demand for safe-haven assets like gold or government bonds.
4. Fiscal Policy and Government Decisions
Government spending, taxation policies, subsidies, and budget deficits also represent critical macro events. Expansionary fiscal policy, such as increased infrastructure spending or tax cuts, can boost economic activity in the short term. Sectors like construction, manufacturing, and consumer goods often benefit from such measures.
However, excessive fiscal deficits can raise concerns about debt sustainability, leading to higher bond yields and currency depreciation. Markets assess not only the size of fiscal measures but also their long-term impact on economic stability and growth.
5. Geopolitical Events and Global Uncertainty
Wars, trade disputes, sanctions, and diplomatic tensions significantly affect global markets. Geopolitical instability disrupts supply chains, raises commodity prices, and increases uncertainty. Energy markets are particularly sensitive to conflicts in oil- and gas-producing regions.
Trade wars and sanctions can reduce global trade volumes, affect corporate profitability, and slow economic growth. Investors often respond by reducing exposure to risky assets and shifting capital toward safer regions or instruments.
6. Global Crises and Black Swan Events
Unexpected macro events such as financial crises, pandemics, or systemic banking failures have far-reaching consequences. These “black swan” events typically cause sharp market sell-offs, liquidity shortages, and economic contractions.
The global financial crisis demonstrated how interconnected financial systems amplify shocks. Similarly, pandemics can simultaneously affect supply, demand, labor markets, and consumer behavior. Recovery from such events often requires coordinated global policy responses.
7. Currency Markets and Capital Flows
Macro events strongly influence currency valuations. Interest rate differentials, economic stability, and political confidence drive capital flows between countries. A strong currency can reduce export competitiveness, while a weak currency can increase inflation through higher import costs.
Emerging markets are particularly vulnerable to macro shocks such as sudden changes in global interest rates or risk sentiment. Capital outflows during periods of global uncertainty can pressure currencies, stock markets, and foreign exchange reserves.
8. Commodity Prices and Inflation Transmission
Commodities such as oil, metals, and agricultural products are highly sensitive to macro events. Supply disruptions, geopolitical tensions, and weather-related events can cause sharp price movements. Rising commodity prices often feed into inflation, affecting consumers and businesses alike.
Energy prices, in particular, play a crucial role in shaping inflation trends and economic growth. Sustained high energy costs can reduce corporate margins and household spending power.
9. Impact on Financial Markets
Equity markets, bond markets, and alternative assets all respond differently to macro events. Stocks are influenced by growth expectations and corporate earnings, while bonds react to inflation and interest rate outlooks. Gold and other safe-haven assets tend to perform well during periods of uncertainty.
Market volatility often increases around major macro announcements. Investors adjust portfolios based on changing risk perceptions, leading to sector rotation and shifts between asset classes.
10. Long-Term Structural Implications
Some macro events create lasting structural changes. Technological advancements, demographic shifts, climate policies, and globalization trends reshape economies over decades. These long-term macro forces influence labor markets, productivity, and competitive dynamics across industries.
Understanding these structural impacts helps investors and policymakers make informed decisions beyond short-term market reactions.
Conclusion
Macro events are powerful forces that shape economic outcomes and financial market behavior. From central bank policies and inflation trends to geopolitical conflicts and global crises, these events influence growth, stability, and investor confidence at a systemic level. While macro events often create uncertainty and volatility, they also present opportunities for those who understand their implications. A comprehensive awareness of macro impacts enables better risk management, strategic planning, and long-term decision-making in an increasingly interconnected global economy.

NIFTY INDEX 14.01.2025NIFTY INDEX 14.01.2025 Technical Level for today,
• Indian markets look set for a muted and cautious session as Gift Nifty indicates limited upside, with weak global cues and foreign selling pressure.
• Nifty has formed technical signs of indecision after recent losses, hinting at range-bound trading unless key levels break.
• Yesterday’s trade ended marginally lower, influenced by weekly F&O expiry and profit booking.

BAJFINANCE : AT A GOOD SWING
Timeframe: Daily
Current Spot Price: ~₹949
Trend Context: Primary uptrend intact | Ongoing corrective phase
🔍 Technical Structure Overview
Bajaj Finance has completed a corrective ABC structure, where:
Wave (a) initiated the correction,
Wave (b) retraced upward,
Wave (c) is nearing completion near a high-probability demand zone.
The ABC completion zone (₹934–₹945) coincides with:
Rising trendline support
Prior structure demand
Short-term mean reversion support (7-SMA)
This confluence increases the probability of a trend resumption bounce rather than a breakdown.
🟩 Swing Trade – Buying Strategy (Cash / Futures)
✅ Buy Zone (Accumulation Range):
₹945 – ₹935 (staggered buying preferred)
🎯 Swing Targets:
Target 1: ₹981
Target 2: ₹1,020
Extended Target: ₹1,066 (only if momentum sustains)
🛑 Stop Loss (Strict):
₹903 (Daily candle close basis)
Risk–reward remains favorable as long as price holds above the ABC completion zone and trendline support.
🟨 Options Trade Strategy – January Expiry
📌 Directional Bias: Moderately Bullish (Buy on Dip)
▶️ Call Buying Setup
Buy: 960 CE or 980 CE (January Expiry)
Ideal Entry: When spot sustains above ₹950–₹955 after pullback confirmation
🎯 Option Targets:
On move towards ₹981–₹1,020 in spot, expect healthy premium expansion
🛑 Option Stop Loss:
Spot-based SL: Hourly close below ₹931
OR 40–45% premium SL, whichever is hit earlier
Avoid aggressive OTM calls; prefer ATM or slightly ITM strikes for better theta and delta balance.
⚠️ Risk Management Notes
If price fails to hold ₹931 on an hourly closing basis, the bullish structure weakens.
A daily close below ₹903 invalidates the swing setup and may open deeper correction.
Position sizing should be conservative due to January expiry volatility.
📌 Summary View
Bias: Buy on dips near demand
Structure: ABC correction nearing completion
Edge: Trendline + demand zone confluence
Best Approach: Staggered swing buying + disciplined option positioning
⚠️ Disclaimer
This analysis is for educational purposes only. I am not a SEBI-registered analyst. Traders should manage risk responsibly and consult their financial advisor before taking positions.

XauUsd 4HR, Tow possible scenario Gold is currently trading on a new all time high level which is 4630 area.
This week the price broke above the upper resistance trend line, suggesting an acceleration of the bullish momentum or a potential new, steeper channel formation.
Seems like gold is targeting to break last ATH and heading towards 4700 area.
Remember any 4hr candle close inside the drawn
Accending triangle would totally change the scenario. It might test the nearest support area which is 4550 and breaking that support will force more down power to 4400 area.

NIFTY : Trading levels and Plan for 14-Jan-2026📊 NIFTY Trading Plan – 14 Jan 2026
Timeframe: 15-min
Gap Consideration: 100+ points
Market Context: Short-term corrective structure with defined intraday support & resistance
🔼 SCENARIO 1: GAP UP OPENING (100+ points) 🚀
If NIFTY opens above 25,816, it indicates bullish intent toward the previous supply area.
Immediate focus will be on 25,816 (Opening Resistance).
Sustained price action above 25,816 with volume can trigger short-covering.
Upside targets:
• 25,921 (Last Intraday Resistance)
• Partial profit booking recommended near resistance.
Rejection near 25,816–25,921 zone may lead to intraday pullback.
📌 Options Strategy (Gap-Up):
• Bull Call Spread (Buy ATM CE, Sell OTM CE)
• Avoid aggressive naked CE buying near resistance
• Trail stop once premium doubles 📈
➡️ SCENARIO 2: FLAT / RANGE OPENING ⚖️
If NIFTY opens between 25,672 – 25,816, expect consolidation and option decay.
This zone acts as Opening Support/Resistance (No Trade Zone).
Directional trades only after clear breakout or breakdown.
Above 25,816 → bias shifts bullish.
Below 25,672 → selling pressure likely.
📌 Options Strategy (Flat Market):
• Short Strangle / Iron Fly (experienced traders only)
• Focus on theta decay ⏳
• Book profits early, avoid late-day overconfidence
🔽 SCENARIO 3: GAP DOWN OPENING (100+ points) 📉
If NIFTY opens below 25,672, initial sentiment remains weak.
First support to watch: 25,559 (Last Intraday Support).
A bounce from 25,559 can offer a quick pullback trade.
Breakdown below 25,559 opens downside targets:
• 25,483
Avoid counter-trend longs without confirmation.
📌 Options Strategy (Gap-Down):
• Bear Put Spread or ATM PE with strict SL
• Avoid selling PE in trending weakness
• Trail profits aggressively 📉
🧠 Risk Management Tips for Options Traders 🛡️
Risk only 1–2% of capital per trade.
Expiry-week trades demand faster exits.
Prefer spreads over naked options to manage theta & IV risk.
Wait for first 15-min candle structure before committing.
One clean trade > multiple emotional trades.
📌 Summary & Conclusion ✨
NIFTY is trading within a defined intraday range.
📍 25,672–25,816 remains the key decision zone.
Directional clarity will emerge only after acceptance outside this range.
Trade what the market confirms — not what you assume.
⚠️ Disclaimer
This analysis is shared strictly for educational purposes only.
I am not a SEBI-registered analyst.
Markets are uncertain, and I may be wrong.
Please consult your financial advisor before taking any trades.

INDIAN HOTELS (INDHOTEL) – Swing Trade SetupINDIAN HOTELS (INDHOTEL): CMP: 748.65; RSI: 51.47
✅ Trend: Strong Bullish (Weekly Golden Cross)
📐 Pattern: Flag consolidation → Breakout setup
🔔 Entry:
• Above ₹770 (weekly close / breakout confirmation)
⛔ Stop Loss:
• ₹700 (below flag support & recent swing low)
🎯 Targets:
• T1: ₹820–830 (partial profit)
• T2: ₹880–900 (flag pole projection / Wave-V zone)
📌 Risk–Reward: ~1:2.5 to 1:3
⚠️ Note:
• Enter only on breakout with volume
• Trail SL once T1 is achieved
📈 Trend is up. Consolidation is healthy. Breakout can lead to next expansion leg.
📌 Thanks a ton for checking out my idea! Hope it sparked some value for you.
🙏 Follow for more insights
👍 Boost if you found it helpful
✍️ Drop a comment with your thoughts below!

DLF likely to double in 1 yearDLF nearly bottoming out. Buy on dip with a stop loss of 600. Will likely double in a year’s time frame give or take.

Nifty Analysis for Jan 13, 2026Wrap up:-
Nifty is heading towards wave c of y of 5. In wave C, Wave 1, 2 and 3 of major wave 1 of c were completed today and wave 4 is expected to be completed by tomorrow morning near 25800. Thereafter, Nifty will head towards wave 5 of major wave 1 of c.
What I’m Watching for Jan 09, 2026 🔍
Buy Nifty near 25800 sl 25700 (15 min. candle closing basis) for a target of 25898-25960-26061.
Disclaimer: Sharing my personal market view — only for educational purpose not financial advice.
"Don't predict the market. Decode them."

Option Trading1. Common Mistakes by Retail Traders
Buying far OTM options
Overtrading
No stop-loss
Ignoring volatility
Selling naked options without hedge
Trading near expiry without plan
Following tips blindly
2. Best Practices for Option Trading
✔ Trade with a system
✔ Check trend (market structure)
✔ Use option Greeks
✔ Focus on liquidity
✔ Avoid gambling with OTM
✔ Use spreads to reduce risk
✔ Journal your trades

Part 2 Candle Stick Patterns Intraday vs Positional Option Trading
Intraday
Quick profits
Higher volatility
Good for scalping
Needs strict discipline
Positional
Rely on swings
Theta decay risk
Good for spreads

Gold reaches new ATH — Smart Money rotates.🟡 XAUUSD – Intraday Smart Money Plan | by Ryan_TitanTrader (13/01)
📈 Market Context
Gold has officially printed a new All-Time High (ATH), confirming higher-timeframe bullish dominance. However, after delivering buy-side liquidity into premium, price action is no longer impulsive. Instead, Smart Money is transitioning into controlled distribution and rotation, engineering liquidity rather than chasing continuation.
With price stretched deep into premium and resting above prior structure, today’s environment favors liquidity sweeps, inducement, and mean reversion, not blind breakout trading. Execution must be precise, level-based, and confirmation-driven.
🔎 Technical Framework – Smart Money Structure (H1–M15)
Current Phase:
HTF bullish structure intact, but intraday corrective rotation active from premium after ATH print.
Key Idea:
Expect Smart Money to distribute near ATH supply (4630–4632), or rebalance deeply into discount (4492–4490) before the next expansion leg.
Structural Notes:
• Clear HTF BOS confirms bullish dominance
• New ATH delivered buy-side liquidity
• Price reacting from premium with corrective characteristics
• Internal FVG + liquidity pocket acting as magnet below
• Discount OB zone aligns with higher-timeframe demand
💧 Liquidity Zones & Triggers
• 🔴 SELL GOLD 4630 – 4632 | SL 4640
• 🟢 BUY GOLD 4492 – 4490 | SL 4482
🧠 Institutional Flow Expectation
Liquidity sweep → MSS / CHoCH → BOS → displacement → OB/FVG retest → expansion
🎯 Execution Rules
🔴 SELL GOLD 4630 – 4632 | SL 4640
Rules:
✔ Price taps ATH premium supply
✔ Buy-side liquidity taken above highs
✔ Bearish MSS / CHoCH on M5–M15
✔ Clear downside BOS confirming distribution
✔ Entry via bearish FVG refill or supply OB
Targets:
• 4588 — internal reaction
• 4560 — FVG mitigation
• Trail aggressively (intraday distribution play)
🟢 BUY GOLD 4492 – 4490 | SL 4482
Rules:
✔ Liquidity sweep into discount demand
✔ Confluence with OB + FVG + strong liquidity pool
✔ Bullish MSS / CHoCH on M5–M15
✔ Strong upside BOS with displacement
✔ Entry via refined bullish OB or FVG mitigation
Targets:
• 4520 — first reaction
• 4580 — internal liquidity
• 4630+ — ATH retest if expansion resumes
⚠️ Risk Notes
• New ATH zones are liquidity traps by nature
• Expect false breakouts and aggressive stop hunts
• No trades without MSS + BOS confirmation
• Size down near ATH — volatility can expand rapidly
📍 Summary
Gold is bullish by structure, but today is about rotation, not continuation:
• A reaction at 4630–4632 may deliver a Smart Money sell back into liquidity, or
• A sweep into 4492–4490 may reload longs for the next ATH extension.
Let liquidity move first.
Let structure confirm second.
Smart Money engineers — patience profits. ⚡️
📌 Follow Ryan_TitanTrader for daily Smart Money gold breakdowns.

CANDLESTICK PATTERNSCandlesticks originated in Japan over 300 years ago. They show four key pieces of information:
Open
High
Low
Close
Candlestick patterns help traders understand short-term price action, momentum, and market psychology.
Candle patterns fall into:
1. Bullish Patterns
2. Bearish Patterns
3. Indecision Patterns
4 .Continuation Patterns

TITAN 1 Week Time Frame 📌 Current Price Context
• The stock is trading around ₹4,230 – ₹4,260 on NSE/BSE today.
• It hit a 52-week high ~₹4,312 recently after strong quarterly results.
📊 Weekly Support & Resistance Levels (1-Week Timeframe)
(Based on pivot analysis for the current weekly chart)
🔼 Resistance Levels
R1 (Immediate): ₹4,327
R2: ₹4,453
R3: ₹4,593
These are key upside hurdles this week — above these, stronger bullish bias.
🔽 Support Levels
S1 (Immediate): ₹4,061
S2: ₹3,921
S3: ₹3,795
If price breaks below S1 → deeper correction risk toward S2/S3.
📌 Weekly Pivot Base
Weekly central pivot zone: ~₹4,186–₹4,218
This can act as a short-term balance area for price rotation this week.
🧠 Quick Reference Table — Weekly Levels
Level Price (₹) Significance
R3 ~4,593 Major weekly upside limit
R2 ~4,453 Secondary resistance
R1 ~4,327 Immediate upside barrier
Pivot zone ~4,186–4,218 Weekly balance level
S1 ~4,061 Immediate support
S2 ~3,921 Next support if S1 breaks
S3 ~3,795 Deep support zone
💡 Summary: Titan’s 1-week view shows a short-term bull bias while above ₹4,061, with upside resistance near ₹4,327–₹4,453 and strong weekly range ₹4,061–₹4,453. A break below support levels opens room for deeper correction.

XAUUSD Full Technical AnalysisGold remains in a **strong bullish structure** after an impulsive move higher, now transitioning into a **healthy consolidation phase**. On the **1H timeframe**, price is holding above the key demand zone around **4,575–4,585**, which previously acted as an accumulation area. The market respected this zone and bounced, confirming it as a strong **support base**.
Price is currently trading near **4,595–4,600**, facing **short-term resistance** just below **4,620–4,630**, where previous highs and supply are stacked. Multiple rejections in this area indicate **profit booking**, but not trend reversal.
On the **lower timeframe (5m)**, structure remains bullish with **higher lows**, and price is holding above the trailing support (trend line / dynamic support). Volume has cooled, suggesting **compression before expansion**.
### 🔑 Key Levels
* **Resistance:** 4,620 → 4,650
* **Immediate Support:** 4,585
* **Major Support:** 4,560–4,550
### 📈 Bias & Scenarios
* **Bullish continuation:** A clean break and hold above **4,620** could trigger upside toward **4,650–4,700**.
* **Pullback scenario:** Failure at resistance may lead to a controlled retracement into **4,585–4,560**, which would still be **buy-the-dip territory** as long as structure holds.
### 🎯 Conclusion
Overall bias remains **bullish**, with price consolidating below resistance. Market participants should watch for either a **breakout confirmation above 4,620** or a **liquidity sweep into support** for continuation trades.

#Nifty Directions and Levels for Jan 13thThe structure suggests that the market could consolidate between today’s high and the immediate support level. However, if it breaks either above today’s high or below today’s low, we can expect gradual ups and downs toward the next targets

#Banknifty Directions and Levels for Jan 13thThe structure suggests that the market could consolidate between today’s high and the immediate support level. However, if it breaks either above today’s high or below today’s low, we can expect gradual ups and downs toward the next targets.

XAUUSD H4 – Structure hints at corrective moveAfter the recent impulsive move, price is now reacting near a higher-timeframe supply area.
Momentum has started to slow down, suggesting a corrective phase may be developing.
As long as the lower-high structure remains intact, a pullback toward the 4370 region
cannot be ruled out. This would align with a natural mean-reversion move
after the prior expansion.
Time-wise, this scenario fits within the 20–21 January window,
assuming no strong bullish continuation above current highs.
This is a structure-based market observation only.
Not a trade recommendation.

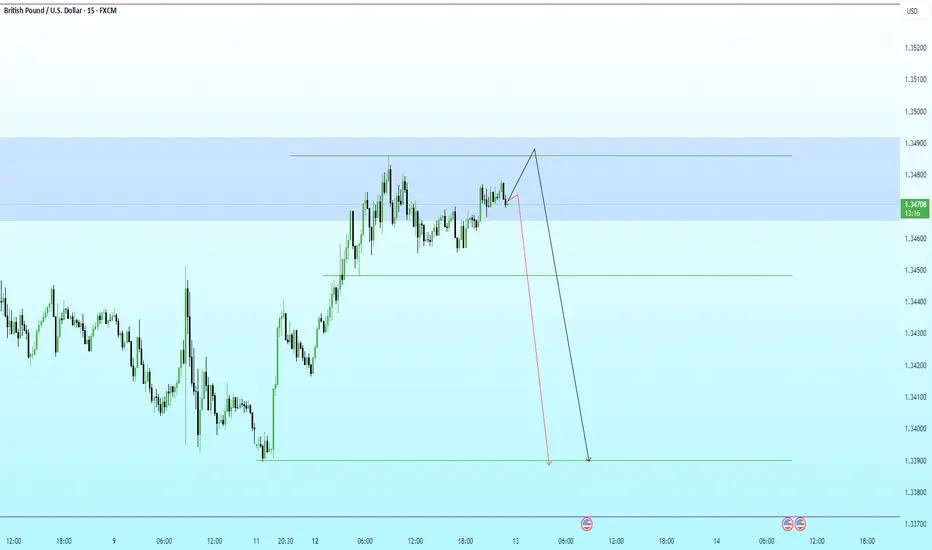
GBPUSD · 15M · SMC OutlookPrice is trading deep into premium, pressing against a well-defined HTF supply zone.
HTF Framework
Clear bullish leg already completed.
Buy-side liquidity resting above recent highs.
Premium zone aligns with prior distribution and weak highs.
LTF Structure
Momentum is slowing near the highs.
Price is consolidating under resistance, hinting at distribution.
Minor pullbacks are being absorbed, classic liquidity buildup behavior.
Expectation
A final push higher to sweep buy-side liquidity.
Reaction from supply after the sweep.
Strong bearish displacement targeting:
Internal range low
Prior demand imbalance
HTF discount zone below
Execution Plan
Avoid longs in premium.
Wait for:
Liquidity sweep above highs
Bearish displacement
LTF MSS for confirmation
Shorts favored post-confirmation.
Partial profits at range low, runners into discount.
HIND ZINC SHORT TRADE -RISKYTechnical Analysis
Parabolic Extension: The stock has seen a massive, nearly vertical rally from the ~400 levels to highs near 670 in a very short span. Such parabolic moves are rarely sustainable without a significant correction or consolidation phase.
Rejection at Highs: The price action shows a sharp pullback from the recent high of 661.55, indicating that profit booking is kicking in and buyers are exhausted at these elevated levels.
Risk/Reward Ratio: The current setup offers a favorable Risk/Reward ratio for a short position. The stop loss is tight relative to the potential downside move as the stock attempts to revert to the mean.
Volume Profile: High volume during the ascent suggests strong participation, but upcoming sessions should be watched for distribution volume (selling pressure) to confirm the top.
Trade Setup (Short)
Entry Zone: 661 (Looking for rejection near the highs)
Stop Loss: 697.40 (Strict SL above recent swing high to protect against a "blow-off top")
Target: 564.45 (Targeting the gap fill/retracement to previous structure support)
Potential R:R: ~ 1:2.6
⚠️ Disclaimer: This chart analysis is shared for educational and informational purposes only. It does not constitute financial or investment advice. I am not a SEBI registered research analyst. Trading in the stock market involves a high degree of risk. Please consult with a certified financial advisor and perform your own due diligence before making any trading decisions.

NIFTY : Trading levels and Plan for 13-Jan-2025
Timeframe: 15-min
Gap Consideration: 100+ points
Market Structure: Pullback after sharp recovery, now approaching key supply zone
🔼 SCENARIO 1: GAP UP OPENING (100+ points) 🚀
If NIFTY opens above 25,923, it indicates a continuation attempt into the previous intraday supply zone.
Initial reaction near 25,923–26,005 is crucial (previous resistance).
Sustainability above 25,923 with volume = bullish acceptance.
Upside targets:
• 26,005 (last intraday resistance)
• 26,075 (upper resistance / supply zone)
Failure to hold above 25,923 may lead to pullback toward the opening range.
📌 Options Strategy (Gap-Up):
• Bull Call Spread (e.g., Buy ATM CE & Sell OTM CE)
• Avoid naked CE buying near resistance
• Partial profit booking recommended near 26,005+
➡️ SCENARIO 2: FLAT / RANGE-BOUND OPENING ⚖️
If NIFTY opens between 25,743 – 25,816, expect range behaviour and option decay.
This zone acts as Opening Support/Resistance + No-Trade Area.
Wait for a clear breakout or breakdown before initiating trades.
Above 25,816 with hold → bullish continuation possible.
Below 25,743 → weakness resumes toward lower supports.
📌 Options Strategy (Flat Market):
• Short Strangle / Iron Fly (only for experienced traders)
• Focus on theta decay, tight SL mandatory
• Book profits early; do not hold till late expiry hours
🔽 SCENARIO 3: GAP DOWN OPENING (100+ points) 📉
If NIFTY opens below 25,743, selling pressure may dominate initially.
First support to watch: 25,640 (last intraday support).
A bounce from 25,640 can give a pullback trade.
Breakdown below 25,640 opens downside targets:
• 25,545
• Further weakness if momentum accelerates
Avoid aggressive longs unless strong reversal confirmation appears.
📌 Options Strategy (Gap-Down):
• Bear Put Spread or ATM PE buy with strict SL
• Avoid selling PE in trending breakdown
• Trail profits aggressively on downside moves
🧠 Risk Management Tips for Options Traders 🛡️
Never risk more than 1–2% of capital per trade.
Expiry trades require faster exits — do not expect positional moves.
Prefer spreads over naked options to control theta & volatility risk.
Trade only after first 15-min structure is clear.
One good trade is enough — overtrading kills edge.
📌 Summary & Conclusion ✨
NIFTY is currently at a decision zone after a sharp pullback recovery.
📍 25,743–25,816 remains the key battle area.
Directional bias will only be clear after acceptance outside this range.
Let price confirm — react, don’t predict.
⚠️ Disclaimer
This analysis is shared strictly for educational purposes only.
I am not a SEBI-registered analyst.
Markets are uncertain, and I may be wrong.
Please consult your financial advisor before taking any trades.

TCS: Quietly ConstructiveQuarterly Results Snapshot
TCS reported a better-than-expected quarterly performance , with EPS of ₹37.14 versus Dalal Street expectations of ₹35.97 . Revenue also came in marginally higher at ₹670.9 billion compared to estimates of ₹668.3 billion .
While the beat is not outsized, it does clear a low expectations bar and provides a supportive fundamental backdrop as price trades near key technical levels.
Technical Structure
On the daily chart, price action continues to respect an impulsive Elliott Wave structure , with a clear extension in Wave 3 . The ongoing pullback remains orderly and corrective, fitting well as a Wave 4 consolidation rather than a trend failure.
The stock is holding support at the 50-DMA and closed above the 200-DMA , a combination that typically favors continuation.
RSI holding above the 50 zone suggests momentum remains biased to the upside, even as price pauses.
Levels That Matter
A sustained move above the recent swing highs would strengthen the case for a Wave 5 advance toward the 3,377 zone .
The bullish structure remains valid as long as price holds above the 3,070 invalidation level .
Conclusion
With earnings clearing expectations and the technical structure remaining constructive , TCS appears to be setting the stage for the next leg higher . While confirmation is still required, the balance of evidence currently leans in favor of continuation rather than reversal .
Disclaimer: This analysis is for educational purposes only and does not constitute investment advice. Please do your own research (DYOR) before making any trading decisions.

Resistance to Flip + Equilibrium Mastery: Pure Price ActionLeft Chart (Monthly TF):
- Classic resistance-turned-support flip. Price tested this level multiple times historically (data >3 months old), holding firm as dynamic support. Proof that prior barriers evolve with pure price behaviour.
Right Chart (Weekly TF):
- Equilibrium at 0.5: Stock has danced around this pivot, building multiple resistances above/below—trading in balance like clockwork.
- Parallel Channel Magic( Red lines ): Counter-trendline + parallel upper line forms a textbook channel, showcasing how price respects geometry over time.
- Respected Demand Zone (Green): Multiple bounces here confirm its strength—demand alive and kicking historically.
Disclaimer: This is for educational purposes only, showcasing historical price action (>3 months old). Not financial advice, trade recommendations, or predictions. Always DYOR and trade at your own risk.
