XAUUSD H4 – Structure hints at corrective moveAfter the recent impulsive move, price is now reacting near a higher-timeframe supply area.
Momentum has started to slow down, suggesting a corrective phase may be developing.
As long as the lower-high structure remains intact, a pullback toward the 4370 region
cannot be ruled out. This would align with a natural mean-reversion move
after the prior expansion.
Time-wise, this scenario fits within the 20–21 January window,
assuming no strong bullish continuation above current highs.
This is a structure-based market observation only.
Not a trade recommendation.
Wave Analysis

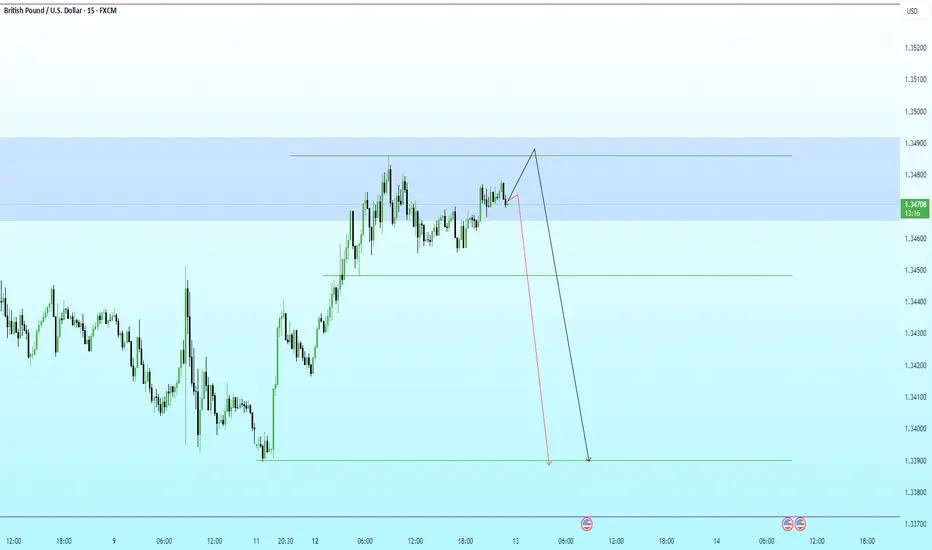
GBPUSD · 15M · SMC OutlookPrice is trading deep into premium, pressing against a well-defined HTF supply zone.
HTF Framework
Clear bullish leg already completed.
Buy-side liquidity resting above recent highs.
Premium zone aligns with prior distribution and weak highs.
LTF Structure
Momentum is slowing near the highs.
Price is consolidating under resistance, hinting at distribution.
Minor pullbacks are being absorbed, classic liquidity buildup behavior.
Expectation
A final push higher to sweep buy-side liquidity.
Reaction from supply after the sweep.
Strong bearish displacement targeting:
Internal range low
Prior demand imbalance
HTF discount zone below
Execution Plan
Avoid longs in premium.
Wait for:
Liquidity sweep above highs
Bearish displacement
LTF MSS for confirmation
Shorts favored post-confirmation.
Partial profits at range low, runners into discount.
Elliott Wave Analysis – XAUUSD | January 13, 2025
Momentum
– Daily (D1) momentum is currently compressing and overlapping, indicating an overextended bullish move.
– This condition suggests that price may still continue higher, however the momentum is clearly weakening, and a reversal can occur at any time.
– H4 momentum is preparing to move into the oversold zone, therefore in the near term we may see a short-term bullish rebound lasting several H4 candles.
– H1 momentum has already reversed to the upside, which supports the possibility of a short-term bullish move over the next few H1 candles.
Wave Structure (Elliott Wave)
Daily (D1)
– Yesterday’s daily candle closed above the previous high at 4549, however D1 momentum remains in the overbought zone.
– Although momentum compression suggests the bullish move may extend, the risk of reversal remains high.
– Previous wave-count scenarios have not been fully invalidated, while the new wave count has not yet received strong confirmation.
– For this reason, on the D1 timeframe we continue to observe and wait for clearer confirmation.
H4 Timeframe
– Price is currently trading near the target zone at 4616.
– H4 momentum is approaching the oversold area and showing signs of a potential bullish reversal.
– At this stage, monitoring H4 momentum is critical. We will focus on structural breaks that align with momentum reversals to confirm the next directional move.
– In addition, we can trade along the short-term bullish H4 momentum until a clear break in structure occurs, forming lower highs and lower lows, accompanied by a confirmed H4 momentum reversal. At that point, the probability of a trend reversal will increase.
H1 Timeframe
– I have drawn a temporary price channel for the ABC wave structure (blue).
– Price is currently trading within this channel and is confluent with the 4600 resistance zone.
– In this scenario, we should wait for a clear candle close above 4600 before looking for buy opportunities.
– If both H4 and H1 momentum move into the overbought zone while price remains trapped below 4600, we will look for sell opportunities.
– The 4520 area becomes a potential short-term target, and this zone is also a potential scalp buy area if price reaction confirms.
Trading Plan
– Wait for confirmation before executing sell setups, as outlined above.
– Watch for price reaction at high-liquidity zones if price pulls back toward 4520.
Buy Zone: 4522 – 4520
Stop Loss: 4500
TP1: 4549
TP2: 4600

TCS: Quietly ConstructiveQuarterly Results Snapshot
TCS reported a better-than-expected quarterly performance , with EPS of ₹37.14 versus Dalal Street expectations of ₹35.97 . Revenue also came in marginally higher at ₹670.9 billion compared to estimates of ₹668.3 billion .
While the beat is not outsized, it does clear a low expectations bar and provides a supportive fundamental backdrop as price trades near key technical levels.
Technical Structure
On the daily chart, price action continues to respect an impulsive Elliott Wave structure , with a clear extension in Wave 3 . The ongoing pullback remains orderly and corrective, fitting well as a Wave 4 consolidation rather than a trend failure.
The stock is holding support at the 50-DMA and closed above the 200-DMA , a combination that typically favors continuation.
RSI holding above the 50 zone suggests momentum remains biased to the upside, even as price pauses.
Levels That Matter
A sustained move above the recent swing highs would strengthen the case for a Wave 5 advance toward the 3,377 zone .
The bullish structure remains valid as long as price holds above the 3,070 invalidation level .
Conclusion
With earnings clearing expectations and the technical structure remaining constructive , TCS appears to be setting the stage for the next leg higher . While confirmation is still required, the balance of evidence currently leans in favor of continuation rather than reversal .
Disclaimer: This analysis is for educational purposes only and does not constitute investment advice. Please do your own research (DYOR) before making any trading decisions.

Nifty Analysis for Jan 13, 2026Wrap up:-
Nifty is heading towards wave c of y of 5. In wave C, Wave 1, 2 and 3 of major wave 1 of c were completed today and wave 4 is expected to be completed by tomorrow morning near 25800. Thereafter, Nifty will head towards wave 5 of major wave 1 of c.
What I’m Watching for Jan 09, 2026 🔍
Buy Nifty near 25800 sl 25700 (15 min. candle closing basis) for a target of 25898-25960-26061.
Disclaimer: Sharing my personal market view — only for educational purpose not financial advice.
"Don't predict the market. Decode them."

Nifty long confirmation Currently Nifty is reacting from a demand zone, for confirmation we’ll need to wait for change of character.
Once smaller timeframe is also bullish, we can take longs on retest of breakout area or any smaller timeframe demand zone in discount zone.
*Taking confluence of GIFT Nifty and Nifty.*

Part 1 Intraday Master Class How Options Work: Buyer vs Seller
Option trading is essentially a contract between two participants:
Option Buyer (Holder)
Option Seller (Writer)
1. Role of the Option Buyer
The buyer pays a premium and gets rights:
Buy (Call Buyer)
Sell (Put Buyer)
Buyers have:
✔ Limited Risk
✔ Unlimited Profit Potential
✔ No Obligations
If the market doesn’t move favorably, a buyer can simply let the option expire.
Maximum loss = premium paid.
2. Role of the Option Seller
Sellers take on obligations.
Call Seller: must sell at strike price
Put Seller: must buy at strike price
Sellers have:
✔ Limited Profit (premium only)
✘ High risk if market moves against them
✘ Obligations to fulfill the contract
Option sellers usually benefit from:
Time decay
Range-bound markets
High implied volatility
Yet, they must manage risk strictly because one bad trend can cause huge losses.

Gold (XAUUSD) – Detailed Technical Analysis
Gold remains **structurally bullish** across the intraday and higher-timeframe charts.
**Trend & Structure**
* On the **1H timeframe**, price is in a strong **impulsive uptrend**, printing higher highs and higher lows.
* The sharp rally from the **4520–4540 demand zone** confirms aggressive buyer participation and trend strength.
* Current price is consolidating just below the recent high near **4600–4610**, forming a **bullish pause/flag**, not a reversal.
**Key Levels**
* **Immediate Resistance:** 4600–4610 (recent high & supply zone)
* **Major Support:** 4560–4550 (intraday demand & prior breakout)
* **Deeper Support:** 4520–4500 (HTF demand, trend invalidation below)
**Lower Timeframe (5M) Insight**
* Price is holding above the **VWAP / value area low**, suggesting smart money accumulation.
* Consolidation above **4560** shows sellers failing to gain control, increasing odds of continuation.
**Momentum & Volume**
* Volume expanded strongly during the impulsive leg up and has now cooled — a **healthy consolidation**.
* No signs of distribution yet; selling pressure remains weak.
**Bias & Scenarios**
* **Bullish continuation favored** above **4560** → upside targets at **4600 → 4630 → 4680**
* A clean break below **4550** may trigger a **pullback toward 4520**, still buy-the-dip unless structure breaks.
**Conclusion**
Gold is **resting before the next leg higher**. As long as price holds above key demand, the path of least resistance remains **upward**. Bulls remain in control, and any dips into support are likely to attract fresh buyers. 🟡📊

IEX 1 Day Time Frame 📊 Daily Support & Resistance (Short‑Term Levels)
Pivot‑based Daily Levels (from classical pivot calculations):
Resistance 1 (R1): ~₹145.5
Resistance 2 (R2): ~₹147.1
Resistance 3 (R3): ~₹148.2
Pivot Point: ~₹144.5
Support 1 (S1): ~₹142.9
Support 2 (S2): ~₹141.8
Support 3 (S3): ~₹140.2
➡️ These are typical classic pivot levels for the current trading day based on the previous day’s price action.
📈 Modern Technical Levels
From recent pivot analysis on a broader timeframe (but still relevant for daily intraday levels):
Immediate Resistance: ~₹183.7
Next Resistance: ~₹188.5
Higher Resistance: ~₹191.1
Immediate Support: ~₹176.3
Lower Support: ~₹173.7
Further Support: ~₹168.9
⚠️ These levels above are from recent pivot indicators (likely based on slightly longer lookback than 1D but often used by traders together with daily pivots).
✨ How to Use These Levels in 1‑Day Trading
Resistance levels → Possible price rejection or profit‑taking zones on upside rallies.
Support levels → Areas where price might find buying or bounce if selling pressure eases.
Pivot level (~₹144–145) → Balance point useful for gauging daily bias (above → bullish, below → bearish).

DMART 1 Week Time Frame 📊 Recent Price Range (Last Week)
Stock was trading around ₹3,780–₹3,900 in the recent trading sessions.
Weekly price change has been relatively modest, showing a small rise over the past week (~+1–2%) in some data and a slight variation in others due to different closing levels.
🛑 Weekly Support Levels
These are key zones where the price may find buying interest / downside support over a short 1‑week horizon:
1. ₹3,665–₹3,705 — Short-term pivot/support cluster (near prior recent lows).
2. ₹3,531–₹3,597 — Lower support range that may act if the stock breaks below near‑term levels.
3. ₹3,340 — Broader 52‑week low area (reference of major historical support).
📈 Weekly Resistance Levels
These are zones where the price may see selling pressure / upside barriers in the near term:
1. ₹3,841–₹3,881 — Near current pivot and first resistance for short‑term trading.
2. ₹3,929–₹3,950+ — Next upside resistance from classic pivot methods.
3 .Above ~₹4,000 — Psychological and technical interest level (also broker target levels in wider timeframe).
📌 Summary — 1‑Week Key Levels to Watch
Level Type Price Zone
Immediate Support ₹3,665 – ₹3,705
Deeper Support ₹3,531 – ₹3,597
Short‑Term Resistance ₹3,841 – ₹3,881
Higher Resistance ~₹3,929 – ₹3,950+

Mastering High-Speed Profits in the Stock MarketIntraday Scalping:
Intraday scalping is one of the most fast-paced and skill-intensive trading strategies in financial markets. It focuses on capturing small price movements multiple times within a single trading day, often within minutes or even seconds. Unlike swing trading or positional investing, scalping does not rely on large trends. Instead, it exploits micro-price fluctuations, liquidity, and volatility to generate consistent profits through volume and precision.
Below is a detailed 1000-word explanation of intraday scalping, covering its philosophy, tools, strategies, risks, and mindset.
1. What Is Intraday Scalping?
Intraday scalping is a short-term trading technique where traders:
Enter and exit trades within the same trading session
Hold positions for a few seconds to a few minutes
Target small price movements
Execute multiple trades per day
The core idea is simple: small profits × high frequency = meaningful returns.
Scalpers do not carry positions overnight, avoiding gap risk, global news shocks, and overnight volatility.
2. Why Scalping Works in Intraday Markets
Scalping thrives because markets constantly fluctuate due to:
Order flow imbalance
High liquidity in index stocks and derivatives
Algorithmic trading activity
Institutional participation
News-driven momentum bursts
In highly liquid instruments, prices rarely stay still. Scalpers capitalize on these continuous movements with disciplined execution.
3. Key Characteristics of a Scalping Strategy
Intraday scalping has distinct features:
Very Short Timeframes
Common charts include 1-minute, 2-minute, and 5-minute
High Trade Frequency
10–50 trades per session is common for active scalpers
Small Stop Loss & Target
Typical risk-reward ranges from 1:1 to 1:1.5
High Accuracy Over High Reward
Win rate matters more than big profits per trade
Strict Discipline
No emotional trading, no hope-based holding
4. Instruments Best Suited for Scalping
Not all instruments are suitable for scalping. The best ones offer high liquidity and tight spreads:
Index futures (NIFTY, BANK NIFTY, FINNIFTY)
Large-cap stocks with high volume
Highly liquid options (near-ATM strikes)
Forex major pairs (for global traders)
Index ETFs
Illiquid stocks are avoided due to slippage and erratic price behavior.
5. Technical Tools Used in Intraday Scalping
Scalpers rely heavily on technical analysis and market structure:
A. Moving Averages
9 EMA, 20 EMA, VWAP
Used for trend direction and dynamic support/resistance
B. VWAP (Volume Weighted Average Price)
A critical tool for intraday bias
Above VWAP = bullish sentiment
Below VWAP = bearish sentiment
C. Support & Resistance
Previous day high/low
Opening range
Intraday demand and supply zones
D. Momentum Indicators
RSI (short periods like 7 or 9)
Stochastic Oscillator
MACD histogram for momentum bursts
E. Volume & Price Action
Volume spikes confirm breakout validity
Candlestick patterns like engulfing, pin bars, and inside bars
6. Popular Intraday Scalping Strategies
1. VWAP Rejection Strategy
Trades are taken when price rejects VWAP with strong volume confirmation.
2. Opening Range Breakout (ORB) Scalping
The first 5–15 minutes define a range. Breakout with volume leads to quick scalps.
3. Pullback Scalping
Trade in the direction of the main trend after a shallow retracement to EMA or VWAP.
4. Momentum Burst Scalping
Quick entries during sudden volume and price expansion caused by news or institutional orders.
5. Range Scalping
Buying near support and selling near resistance in sideways markets.
7. Risk Management in Scalping
Risk control is the foundation of successful scalping:
Fixed stop loss for every trade
Risk only 0.25%–0.5% of capital per trade
Daily maximum loss limit
Stop trading after consecutive losses
Never average losing trades
In scalping, capital protection is more important than profit chasing.
8. Psychology of a Successful Scalper
Scalping is mentally demanding. Successful scalpers develop:
Emotional neutrality
Ability to accept small losses quickly
High focus and alertness
Discipline to follow rules strictly
Detachment from individual trade outcomes
Overtrading, revenge trading, and hesitation are the biggest enemies of scalpers.
9. Technology & Execution Speed
Because scalping depends on precision:
Fast internet connection is essential
Reliable trading platform
Low brokerage and transaction costs
Quick order execution
Direct market access where possible
Even a small delay can turn a profitable trade into a loss.
10. Advantages of Intraday Scalping
No overnight risk
Quick feedback and learning curve
Works in both trending and ranging markets
Capital efficiency
Clear entry and exit rules
11. Challenges and Risks
High stress and screen time
Requires constant attention
Transaction costs can eat profits
Emotional fatigue
Not suitable for part-time traders
Scalping is not a shortcut to quick money—it is a professional-level trading approach.
12. Who Should Choose Scalping?
Intraday scalping is ideal for traders who:
Can monitor markets actively
Have strong discipline
Enjoy fast decision-making
Are comfortable with frequent trades
Prefer short exposure durations
It is not suitable for investors or traders who dislike screen-based work.
Conclusion
Intraday scalping is a precision-driven, high-discipline trading methodology designed for traders who thrive in fast environments. Success in scalping does not come from prediction, but from probability, execution, and consistency. When combined with proper risk management, sound psychology, and robust technical frameworks, scalping can become a powerful tool for generating steady intraday income.

Indian IPO and SME Boom Play: The Next Wave of Growth in CapitalThe Rise of the Indian IPO Market
Over the last few years, India has emerged as one of the most active IPO markets globally. Companies across sectors such as technology, manufacturing, renewable energy, healthcare, financial services, and consumer goods are tapping the public markets to fund expansion, reduce debt, and provide exits to early investors.
Several factors are driving this IPO momentum. First, India’s strong macroeconomic fundamentals—robust GDP growth, a large domestic market, and rising consumption—have increased confidence among promoters and investors alike. Second, reforms by market regulators have improved transparency, governance standards, and ease of raising capital. Third, domestic liquidity has surged due to the rapid growth of retail investors, mutual funds, insurance companies, and pension funds.
Unlike earlier cycles dominated by a few large conglomerates, the current IPO wave reflects diversity. New-age technology firms, export-oriented manufacturers, and niche service providers are all entering the market. This diversification has expanded investment opportunities and reduced concentration risk for investors.
SME IPOs: The Silent Powerhouse
While mainboard IPOs attract headlines, the real structural change is happening in the SME segment. SME platforms on Indian stock exchanges have become a powerful fundraising avenue for small and mid-sized businesses that were earlier dependent on bank loans or private funding.
SME IPOs allow growing companies to raise capital at an early stage, strengthen their balance sheets, and gain credibility through public listing. For investors, SME listings offer exposure to high-growth, under-researched companies at relatively early stages of their business lifecycle.
The boom in SME listings reflects India’s entrepreneurial depth. Many of these companies operate in specialized niches—engineering components, chemicals, logistics, packaging, IT services, and agro-processing—areas closely linked to domestic manufacturing and export growth. As India pushes initiatives like “Make in India,” “Atmanirbhar Bharat,” and global supply chain diversification, SMEs stand to benefit disproportionately.
Why IPO and SME Boom Matters for the Economy
The IPO and SME boom has broader economic implications beyond capital markets. Public listings improve corporate governance, enhance transparency, and encourage professional management. This strengthens the overall business ecosystem.
Capital raised through IPOs is often used for capacity expansion, technology upgrades, research and development, and market expansion. These investments create jobs, boost productivity, and support long-term economic growth. For SMEs, access to equity capital reduces over-reliance on debt, making businesses more resilient during economic cycles.
From a policy perspective, a vibrant IPO market reflects confidence in the economy. It also helps channel household savings into productive assets, reducing dependence on speculative or unproductive investments.
Investor Participation and Behavioral Shift
One of the most striking features of the current boom is the surge in retail participation. Millions of new demat accounts have been opened, and retail investors are actively applying for IPOs and SME issues. This reflects a shift in mindset—from traditional savings instruments to equity ownership.
Technology has played a key role in this transition. Easy access to online trading platforms, simplified IPO application processes, and increased availability of information have democratized market participation. Social media, financial influencers, and digital education platforms have further increased awareness, though they also highlight the need for investor caution and due diligence.
Institutional investors, both domestic and foreign, continue to play a crucial role by providing stability and price discovery. Their participation validates business models and sets valuation benchmarks, especially for large IPOs.
Opportunities in the IPO and SME Boom Play
For investors, the IPO and SME boom presents multiple opportunities. Early-stage participation in high-quality businesses can generate significant long-term wealth if the company executes well. SME stocks, in particular, can deliver outsized returns due to their smaller base and faster growth potential.
Sectoral trends such as renewable energy, defense manufacturing, specialty chemicals, infrastructure, logistics, digital services, and healthcare are creating fertile ground for new listings. Investors who understand these themes and align them with strong company fundamentals can benefit from structural growth.
From a trading perspective, IPO listings often generate short-term momentum, offering opportunities for listing gains. However, long-term investors focus on business quality, scalability, management credibility, and industry tailwinds rather than short-term price action.
Risks and Challenges to Consider
Despite the optimism, the IPO and SME boom is not without risks. Overvaluation is a key concern, especially during periods of excessive enthusiasm. Not all listed companies will succeed, and some may struggle to meet growth expectations post-listing.
SME stocks, while attractive, come with higher volatility, lower liquidity, and greater information asymmetry. Corporate governance risks, execution challenges, and dependence on a limited client base are common issues in smaller companies.
Market cycles also play a role. IPO activity tends to slow during periods of global uncertainty, rising interest rates, or sharp market corrections. Investors must be prepared for volatility and avoid herd behavior.
Strategic Approach to the IPO and SME Boom
A disciplined approach is essential to navigate this space effectively. Investors should focus on business fundamentals, financial health, promoter track record, and industry prospects. Diversification across sectors and market segments helps manage risk.
Long-term investors may consider holding quality IPOs through market cycles, allowing compounding to work over time. For SME investments, a portfolio approach—investing smaller amounts across multiple companies—can help balance risk and reward.
Continuous monitoring is crucial. Public listing is just the beginning of a company’s journey, not the end. Post-listing performance, earnings growth, capital allocation decisions, and governance practices determine long-term success.
Conclusion: A Structural Growth Story
The Indian IPO and SME boom is more than a market trend—it is a reflection of India’s evolving economic and entrepreneurial landscape. As businesses increasingly turn to capital markets for growth and investors embrace equity participation, this ecosystem will continue to mature.
For investors, the IPO and SME boom play offers a unique opportunity to participate in India’s growth story from the ground up. While risks exist, informed decision-making, patience, and discipline can help transform this wave of listings into a powerful long-term wealth creation journey.

NIFTY FUTUTR VIEW nifty possible move
Wave 4 , 25900, 26050 reversal possible
Wave 5 25350 ,25100
view is for study purpose only , we are not recommend ant trade or investment
Always do your own analysis

Elliott Wave Analysis XAUUSD Week 2 – January 2026
1. Momentum
Weekly (W1)
– Weekly momentum is currently declining
– This suggests the broader bearish trend remains intact
– Price is likely to continue correcting until weekly momentum reaches the oversold zone
Daily (D1)
– Daily momentum has turned bearish
– Therefore, the dominant bias for this week is expected to be to the downside
H4
– H4 momentum is currently in the overbought zone
– A short-term pullback is likely to occur as early as Monday
2. Elliott Wave Structure
Weekly Structure (W1)
– Last week closed as a bullish candle
– However, weekly momentum is still declining and has not confirmed a bullish reversal
– As a result, we continue to follow the main scenario:
→ Wave X has already completed
→ Price is now continuing to develop wave Y
– The two main downside targets for wave Y are:
– 4072
– 3761
Daily Structure (D1)
– Daily momentum has turned bearish, supporting the view that price may continue lower as part of wave Y this week
– However, there is an important risk factor to note:
– Price rallied strongly last week
– It is now trading very close to the previous wave C high
– This increases the risk of a breakout above the prior high, which would require a reassessment of the current wave count
– Plan going forward:
– Wait for Monday’s session
– A bearish daily close would further confirm the continuation of wave Y
H4 Structure
– H4 momentum is in the overbought zone and showing signs of a potential reversal
– The break above 4500 invalidates the previous wave 1–2 scenario
– This suggests that red wave C is still in progress
– The next target for red wave C is the 4521 area
This zone is also selected as the primary trading objective for Monday.
3. Trading Plan
– Sell Zone: 4520 – 4522
– Stop Loss: 4540
– Take Profit 1: 4423
– Take Profit 2: 4331
– Take Profit 3: 4220

SPY - Hope it tops this time :)US markets have been super resilient, sucking capital from across the world.
We have a good pattern in place, as the triggers for pushing the market up have been reducing with time, with everything running quite thin.
The rally has been quite low on breadth and is supported on weak pillars - but still has been resilient and all selling have been bought into.
Let's see if it breaks and sustains this time.
We need a 10-15% (ideally + 20%) fall in US for money to flow into emerging markets :)
It is a good time to try some positional shorts with SL as 7k.
View void if we sustain above 7k.

NIFTY Forms Ending Diagonal (EDT): 25,133–25,000 final Target.✅ STRUCTURE CONFIRMATION
1️⃣ Impulse completed
✔ NIFTY has completed a 5-wave impulse as per the chart
✔ Wave (v) showed:
Overlap
Momentum divergence
Channel resistance
➡️ This strongly suggests an Ending Diagonal–type Wave (v), which often leads to sharp ABC corrections
2️⃣ Current phase: ABC correction in progress
Your ABC expectation is correct.
🔹 Wave A
Sharp decline from the top
Impulsive nature ✔
🔹 Wave B (ongoing / upcoming)
Counter-trend bounce
Overlapping, corrective
Lower volume
📌 Important:
👉 Any Wave-B bounce is a shorting opportunity, not a trend resumption
Ideal Wave-B retracement zone:
25,800 – 26,000
Near broken channel / prior resistance
3️⃣ Wave C termination zone (KEY POINT)
Your final buy zone is well identified.
🎯 High-probability Wave-C completion:
25,133 – 25,000
Why this zone matters:
✔ 200-EMA (~25,133)
✔ Ending Diagonal trendline (EDT) support
✔ 50–61.8% Fibonacci retracement
✔ Prior demand + institutional reference level
📌 This is a confluence zone, which is exactly where Elliott Wave corrections typically end.
4️⃣ Trading logic (very clear)
❌ Do NOT buy during Wave B
✅ Use Wave-B rallies to sell / hedge
✅ Final buy should be planned near 25,133 ± 150 pts
Expect volatility and false breakdowns near the bottom
5️⃣ Invalidation (must know)
❌ Weekly close below 24,600
Would imply a deeper, higher-degree correction
Until then → bullish structure intact

ABCapital -> A Clear opportunity.Currently playing larger wave 3.
Played all earlier sub waves perfectly.
Currently playing sub wave C of 4 of 5 of 3.
Well aligned with fib ratio's.
Also clear divergence in RSI.
Minimum target of 335/-(Around 5%) is very much possible in short term.

BUY BABY CHART ANALYSIS Buy and hodl for some time swing trade for 1 day candlestick pattern chart analysis its lowesr our 1 day all liquidation grab and this is tha demand and buy in partial ohk its only my analysis buy at your own risk

Unlock Market Rotation: Turn Shifting Trends into Powerful ProfiStay Ahead of Capital Flow & Capture the Next Big Opportunity
What Is Market Rotation?
Market rotation refers to the movement of capital from one sector, asset class, or investment theme to another as economic conditions, interest rates, inflation, and growth expectations change. Understanding this shift allows investors to align portfolios with where money is flowing next, not where it has already been.
Why Market Rotation Matters More Than Ever
In today’s fast-moving global markets, leadership changes quickly. Sectors that outperform in one phase of the cycle can underperform in the next. Investors who unlock market rotation gain a powerful edge by identifying early signals and positioning before the crowd reacts.
Economic Cycles Drive Rotation
Different sectors perform best at different stages of the economic cycle. Early recovery favors cyclicals, mid-cycle supports growth sectors, late-cycle shifts toward defensives, and slowdown phases reward capital preservation strategies. Market rotation is the bridge between macro trends and smart allocation.
Interest Rates as a Key Trigger
Rising interest rates often rotate money away from high-growth, high-valuation stocks toward value, financials, and commodities. Falling rates usually support technology, consumption, and growth-oriented sectors. Tracking rate expectations is critical to anticipating rotation.
Inflation and Sector Leadership
Inflation reshapes winners and losers. High inflation typically benefits energy, metals, and real assets, while compressing margins in rate-sensitive sectors. Unlocking rotation means understanding how inflation impacts pricing power across industries.
Institutional Money Leaves Clues
FIIs, DIIs, and large institutional players move capital systematically. Volume expansion, relative strength, and sectoral index breakouts often signal early institutional rotation. Smart investors learn to read these footprints rather than react to headlines.
Relative Strength Is the Core Tool
Market rotation is best identified through relative performance. Comparing sectors against benchmark indices reveals which areas are gaining strength and which are losing momentum. Sustained outperformance is a strong sign of rotation in progress.
From Sector to Stock-Level Rotation
Rotation doesn’t stop at sectors—it flows into sub-sectors and then into specific stocks. Leaders within a strong sector usually outperform peers. Unlocking market rotation means narrowing focus from macro to micro with precision.
Risk Management Through Rotation
Instead of exiting markets entirely, rotation allows investors to shift risk, not abandon opportunity. When one theme weakens, another strengthens. This approach smooths volatility and improves long-term consistency.
Psychology of Market Rotation
Most investors chase past performance. Market rotation rewards those who act before trends become obvious. Discipline, data-driven decisions, and patience are essential to avoid emotional investing.
Technical Indicators That Signal Rotation
Moving averages, sectoral relative strength lines, momentum oscillators, and trend confirmation tools help validate rotation. Technical confirmation ensures that allocation decisions are backed by price action, not assumptions.
Macro Events Accelerate Rotation
Central bank decisions, geopolitical shifts, policy reforms, and global growth changes can rapidly accelerate capital movement. Prepared investors use these events as catalysts rather than shocks.
Short-Term vs Long-Term Rotation
Rotation can be tactical (weeks to months) or strategic (quarters to years). Traders benefit from short-term sector momentum, while investors focus on structural shifts like digitization, energy transition, or infrastructure growth.
Equity, Debt, and Alternative Rotation
Rotation is not limited to equities. Capital also moves between stocks, bonds, commodities, and alternative assets. A holistic approach captures opportunities across asset classes.
Market Rotation in Indian Markets
In India, rotation often reflects domestic growth cycles, government policies, earnings visibility, and global capital flows. Understanding local drivers adds a significant advantage to portfolio positioning.
Avoiding Overcrowded Trades
When a sector becomes over-owned, upside potential reduces. Unlocking market rotation helps investors exit crowded themes early and enter emerging ones before valuations expand.
Consistency Beats Prediction
Market rotation is not about predicting tops or bottoms. It is about consistently reallocating capital toward strength and away from weakness based on objective signals.
Portfolio Rebalancing with Purpose
Regular rebalancing aligned with rotation trends keeps portfolios dynamic. This reduces drawdowns and improves risk-adjusted returns over time.
Long-Term Wealth Creation Advantage
Investors who master market rotation compound gains by riding multiple leadership cycles instead of staying stuck in one theme. This adaptability is key to sustainable wealth creation.
Unlock the Edge
Market rotation is the silent force behind every major rally and correction. Those who understand it move ahead of trends, protect capital during uncertainty, and capture opportunity when it matters most.
Unlock Market Rotation is not just a strategy—it’s a mindset. By tracking capital flow, aligning with economic cycles, and acting decisively, investors can transform uncertainty into opportunity and stay one step ahead of the market.

Understanding Rapid Price Movements Through Technical AnalysisTechnical Market Explosion:
A technical market explosion refers to a sudden, powerful, and often unexpected surge in price movement—either upward or downward—driven primarily by technical factors rather than immediate fundamental news. These explosive moves are commonly observed across equities, commodities, forex, and cryptocurrencies and are closely followed by traders because they often create high-profit opportunities within short time frames. Understanding why and how these explosions occur is essential for traders and investors who rely on technical analysis to navigate volatile markets.
1. Meaning of a Technical Market Explosion
A technical market explosion occurs when price action breaks out decisively from a consolidation zone, key resistance, or support level with strong momentum and volume. This move is usually rapid and sharp, leaving little time for indecision. Such explosions reflect a sudden shift in market psychology where buyers or sellers overwhelm the opposing side.
These movements are not random; they are often the result of prolonged price compression, accumulation, or distribution phases that eventually release stored market energy.
2. Role of Support and Resistance Breakouts
Support and resistance levels are the backbone of technical analysis. A technical explosion typically begins when price decisively breaks above resistance or below support. Traders place buy stops above resistance and sell stops below support, and when these levels are breached, a cascade of orders is triggered.
This chain reaction increases liquidity and momentum, accelerating price movement. The stronger and more tested the level, the more explosive the breakout tends to be when it finally occurs.
3. Volume as the Fuel of Explosion
Volume plays a crucial role in validating a technical market explosion. A genuine breakout is almost always accompanied by a sharp rise in volume, signaling strong participation by institutional and retail traders.
Low-volume breakouts often fail, while high-volume explosions suggest conviction and sustainability. Volume confirms that the move is supported by real money, not just speculative noise.
4. Volatility Compression and Expansion
Before a market explodes, volatility usually contracts. This phase is marked by narrow price ranges, tight Bollinger Bands, or triangle and wedge formations. Such patterns indicate indecision and balance between buyers and sellers.
When volatility expands suddenly, it signals the start of a technical explosion. Traders who recognize volatility compression early can position themselves ahead of the breakout.
5. Indicator Alignment and Momentum
Technical indicators often align before a market explosion. Momentum indicators like RSI, MACD, and Stochastic Oscillators show strength or divergence prior to the move. For example:
RSI holding above 50 indicates bullish strength
MACD bullish crossover near zero line signals momentum buildup
Moving averages start flattening or converging before expansion
When these indicators turn simultaneously, the probability of an explosive move increases.
6. Chart Patterns Triggering Explosions
Certain chart patterns are well known for leading to technical market explosions, including:
Ascending and descending triangles
Cup and handle patterns
Flags and pennants
Head and shoulders (especially breakdowns)
These patterns represent structured market behavior, and once their boundaries are violated, price often moves swiftly toward projected targets.
7. Institutional Activity and Smart Money
Institutional players often accumulate positions quietly during consolidation phases. This accumulation is not obvious to most traders but can be detected through price structure and volume behavior.
Once institutions complete accumulation or distribution, they allow price to move aggressively. This is when retail traders observe a technical market explosion, often entering late but still benefiting from momentum.
8. Role of Algorithmic and High-Frequency Trading
In modern markets, algorithmic trading plays a major role in accelerating technical explosions. Algorithms are programmed to react instantly to technical signals such as breakouts, moving average crossovers, and volatility spikes.
When a key level breaks, thousands of automated orders execute simultaneously, intensifying the speed and magnitude of the move.
9. False Breakouts vs True Explosions
Not every breakout leads to a true explosion. False breakouts occur when price briefly moves beyond a key level but lacks volume or follow-through. Recognizing the difference is critical.
True technical explosions show:
Strong closing prices beyond the breakout level
Increasing volume
Momentum continuation across multiple candles
False moves often retrace quickly and trap impatient traders.
10. Risk Management During Explosive Moves
While technical market explosions offer high reward, they also carry high risk. Rapid price movement can lead to slippage and emotional decision-making.
Effective risk management includes:
Predefined stop-loss levels
Position sizing based on volatility
Avoiding over-leverage
Waiting for candle confirmation instead of chasing price
Discipline is essential to survive and profit consistently from explosive markets.
11. Psychological Impact on Traders
Explosive moves create fear and greed simultaneously. Traders who miss the initial move feel fear of missing out (FOMO), while those in profit may panic and exit early.
Professional traders remain calm, follow their strategy, and understand that technical explosions are part of a broader market cycle, not isolated events.
12. Timeframe Perspective
Technical market explosions occur across all timeframes. On lower timeframes, they may last minutes or hours, while on higher timeframes, they can develop into long-term trends lasting months or years.
Swing traders, day traders, and investors interpret explosions differently, but the underlying technical principles remain the same.
13. Post-Explosion Behavior
After an explosive move, markets often pause, consolidate, or retrace partially. This phase is healthy and allows new participants to enter.
Strong markets use post-explosion consolidation as a base for the next leg, while weak markets fail to hold gains and reverse.
Conclusion
A technical market explosion is the result of accumulated market energy released through key technical triggers such as breakouts, volume surges, indicator alignment, and volatility expansion. These moves reflect shifts in market psychology and institutional participation rather than pure randomness.
For traders who master technical analysis, recognizing early signs of an impending explosion can provide significant opportunities. However, success depends not only on identifying the move but also on managing risk, controlling emotions, and respecting market structure. In fast-moving markets, preparation—not prediction—is the true edge.

RELIANCE may head for 1111 #RELIANCE is forming a NEAT 3-3-5 FLAT and should head for 1111. Anybody in EW kindly study and share views. In simple terms if you see the two DTF and WTF charts , the stock is forming a 3-3-5 FLAT correction STARTING 12 July 2024 where sub wave -a has three sub waves culminating at 1114 on 07 Apr 2025 and sub sub -c of this wave is ending as a 5 wave Ending Diagonal. Then we have sub wave-b going up in three sub waves again culminating at 1611 high on 03 Jan 2026. Now I am looking for sub wave -c going deep down to 1111 in five sub waves 1-2-3-4-5 as I have shown in the DTF Chart. ANALYSIS INVALIDATION 1611 ( or even 1575 may be good enough for invalidation). THIS DTF CHART ( Daily Time Frame).Lets C

#RELIANCE at 1475 heading for 1111 in 3-3-5 Elliott Wave FLAT #RELIANCE at 1475 is forming a NEAT 3-3-5 FLAT and should head for 1111. Anybody in EW kindly study and share views. In simple terms if you see the two DTF and WTF charts , the stock is forming a 3-3-5 FLAT correction STARTING 12 July 2024 where sub wave -a has three sub waves culminating at 1114 on 07 Apr 2025 and sub sub -c of this wave is ending as a 5 wave Ending Diagonal. Then we have sub wave-b going up in three sub waves again culminating at 1611 high on 03 Jan 2026. Now I am looking for sub wave -c going deep down to 1111 in five sub waves 1-2-3-4-5 as I have shown in the DTF Chart. ANALYSIS INVALIDATION 1611 ( or even 1575 may be good enough for invalidation). Lets C

Catostrophic time aheadDear Humans,
I have a strange finding about the coming time which is going to be tougher than 2008, yes its 100years cycle and we are going to see repeat of 1929-1931, I have marked the fall in RED in WXYXZ style move, market always gives you one chance and we are still adamant on on upward direction and investing at top levels where smart money is selling quiet Easily....
Nifty doesn't have any charts or exchange was not there during this time while we can see in Dow john's chart.
the current scenario at ground levels is that even a Lower and medium class is suffering because of the money scarcity in the market..
I can see that we are going to fall around 78%(precisely 76.4%) from highs by may 2027 in just one and half years time as we are in era of social media where movements are very fast ,,1929-1931 was 2.5 years time great depression.. " what name the market will it be given to this Catastrophic fall" ..
those who were mongeringfall of 12500 levels pre covid high levels at 16000/18000/20000/23500, its time to see those levels again, yes by May/June 2026 . unfortunately they all became bulls now and talking of 28000-30000 levels. well the investor has to hold on for 6 years or more to see these levels again, as history suggest that once such brutal fall happens then time takes its own course to rise again.
even Astro is suggesting Jupiter in 6/8 axis and malific ketu during this 6 years so the journey will be tough to rise from 6000 levels .. so its a time and price fall this time, both together..
Great Depression / Recession/ stagflation/WW3 god knows what all we see ? but
chart is showing a horrific picture..
Its a bigger time frame fall ( weekly, monthly & Yearly) so post this destruction we will not see these brutal levels for next bigger cycle atleast.. may God gives energy & courage to face the tough time coming ahead..
Yes after this fall we will enter into big time bull ERA, Prosperity, growth and growth only..
This post will really help next to next generations to see this interesting finding, if this software pertains that time..
* disclaimer:
its my personal finding for education purpose only and don't take any trade on basis of this.
