Update latest gold price todayToday, gold is experiencing slight downward pressure as trade concerns ease, although it remains supported by a weaker USD. Gold prices are currently trading around the psychological level of $2900, marking a correction of more than 130 pips intraday.
Trading Strategy:
🧑💻 XAU/USD BUY Zone: 2878 - 2880
🔹 SL: 2875
🔹 TP: 2884 - 2889 - Open
🧑💻 XAU/USD SELL Zone: 2952 - 2954
🔹 SL: 2957
🔹 TP: 2949 - 2944 - Open
Wave Analysis

Is it a reversal in NIFTY?If we observe the daily chart of NIFTY, a pattern like Morning Star can be seen near the 161.8% retracement level. Also, as per our previous study, the recent fall was wave (Z).
The minimum target for it is 38.2% extension (which is a failure wave (Z) because most of the time, it is seen that wave (Z) is a failure or truncated).
So, we can have a risky buying opportunity here with a small stop-loss below the recent low. Or, if one wants to play safe, he may have his stop bellow 61.8% (21662) level.
The near target will be the bottom of wave (Y), i.e., 22786.90
This analysis is based on the Elliott wave theory and Fibonacci.
This is not any buying recommendations.
This analysis is for educational purposes only.

ONGC -Wave 5 Bottomed! OMG! - From Oil Rigs to Green Gigs!ONGC is making history, transitioning from oil dominance to renewable energy leadership.
On Feb 28, Last ONGC Idea on TradingView
I shared my TradingView idea, predicting Wave 5 completion at the bottom and expecting a bounce off the trendline. And here we are on March 6—ONGC surges from 215 lows to 232+ highs as of today’s close with a strong green candle.
ONGC’s Big Bet: A ₹9.25B Leap into Green Energy!
But that’s not all—ONGC just made a massive fundamental move, acquiring PTC Energy for ₹9.25B ($106M), adding 288 MW of operational wind power across three Indian states.
Why This is a Game-Changer
✅ India’s 500 GW non-fossil fuel target by 2030
✅ ONGC Green targeting 10 GW renewable energy portfolio
✅ Recent $2.3B Ayana Renewable Power acquisition with NTPC Green
Technical Perspective – The Power of Wave 5
Is Wave 5 bottom confirmed in some degree of the impulsive move which started falling from 345 highs as discussed and warned earlier in the Bigger Idea
Momentum building – are new highs incoming
From oil rigs to green gigs, ONGC is shifting gears fast. Is this just the beginning of an explosive rally?
Let us decode the waves.
Catch me with another exciting idea from WaveTalks, Market Whispers! Can you hear them?
Regards,
Abhishek
WaveTalks

Nifty Price Action 6 March & Special Pattern Trading StrategyI make educational content videos for swing / positional trading

GULFOILLUB-Breakout Stock🚀 Gulf Oil Lubricants (GULFOILLUB) is in strong momentum! This stock is showing promising movement, making it worth keeping on your watchlist. 📈 Investors are advised to study the stock and conduct their own research before making any investment decisions.
Disclaimer: This is purely for informational purposes and not a recommendation to buy or sell. Investors are advised to conduct their own research and risk assessment before making any investment decisions, as stock markets are subject to volatility and risks.
#StockMarket #MomentumStocks #BreakoutStocks #StocksToBuy #StockMarketNews #Trading #StockMarketIndia #ShareMarket #Nifty50 #SwingTrading #TechnicalAnalysis #BestStocks #NiftySmallCap #NiftyMidCap #BankNifty #MultibaggerStocks #Investment #IntradayTrading #StockMarketUpdates #TradingTips #BreakoutTrading #FinancialMarkets #StockMarketInvesting #GULFOILLUB #StocksToWatch #ShareMarketIndia

Wave 5 Long-Term Target: Fibonacci Projection Indicates 28,867Wave 5 Long-Term Target: Fibonacci Projection Indicates 28,867
Wave 1: 15,214 to 18,893
Wave 3: 16,833 to 26,290
Wave 4 Complete: 22,022 (Correction Phase Ended)
Calculation:
Wave 1-3 Range: 26,290 - 15,214 = 11,076
61.8% of Wave 1-3: 11,076 × 0.618 = 6,844.97
Wave 5 Target: 22,022 + 6,844.97 = 28,867
Conclusion:
Wave 4 has completed, confirming a long-term bullish outlook. If Wave 5 follows the 61.8% Fibonacci extension rule, its estimated target is 28,867. This projection helps us to set long-term price targets and confirmations. You can view my previous analysis of wave 4 published on 20 FEB.

EUR/USD Targets Higher ResistanceEUR/USD has experienced a robust rally, rising to the 1.079 level during early trading hours on Thursday.
From a technical perspective, bullish momentum remains strong with consecutive bullish candles, and no signs of a top formation yet. The next target is the 1.093 resistance area, after which EUR/USD may establish a new peak and potentially begin a pullback.

GOLD short-term analysis today, trading range 2900~2940Yesterday, gold prices rose first and then fell under the poor US ADP data. After falling below the 2900 mark and reaching a low of 2894, it stopped falling and quickly rose. It reached a high of 2929 and then fell back to around 2915, with long and short positions sweeping back and forth. It is worth noting that the sharp decline of the US dollar index and the sharp rise of silver did not cause further rise in gold. The gold price seems to be following its own independent trend. Today, the support below is in the range of 2900-2905, and the pressure above is around 2940!
From the current market, the daily line rose for 2 consecutive times this week, with an overall increase of more than 60 US dollars, which is enough to reflect the strength of the bulls. In addition to the rise of yesterday's market, the current price is running above the Bollinger upper rail, and the short-term moving average extends upward strongly, forming support at 2895 and 2880 respectively. The daily line should tend to continue the upward trend.
Gold continues to fluctuate widely, and we continue to maintain the idea of oscillation trading unchanged. The main idea is to participate in the layout with the idea of oscillation, participate in the short-term of callback low and long, and pay attention to the long-term selling opportunities near the previous high. Focus on the 2900/2940 range during the day.
From the daily chart, the medium-term trend of the daily chart remains unchanged, and the price is running in the rising channel, but the lower line is too far away from the current price, which is not very meaningful. Yesterday, there was a false break of 2900, and there was another rebound in the late trading. Whether the market can break through the resistance of this short-term trend remains to be seen. After the intraday shock, gold fell back in the US market, and the current lowest is 2894!
After the continuous rise on Monday and Tuesday, the short-term increase was too large, and an adjustment process was needed. The price was also under pressure near the previous opening of 2930, especially in the 4-hour cycle. It is obvious that after the continuous shock, the bulls began to fail, and the retreat is more conducive to the later rise!
From the four-hour chart, gold broke the upward trend line before, and the short-term indicators are overbought, but the overall upward pattern has not changed. Yesterday, the K-line rebounded strongly relying on the support of ma5, the Bollinger Bands opened upward, and the MACD golden cross diverged upward. Gold is currently in a bullish trend. Short-term bullish thinking continues. Pay attention to the support break of the 10-day moving average 2900-2895 below. If this position is not broken, the bullish trend will remain unchanged. If it breaks, it will look to 2880!
However, it is worth noting that yesterday's market did not continue to rush up after hitting the 5-day moving average support, but consolidated at a high level, and the MACD red column continued to decrease, suggesting that the pressure from above is gradually increasing. Therefore, today's short-term operation is bullish but not high-level chasing. Pay attention to the short-term bulls rushing high and then diving down due to insufficient momentum. On the whole, today's short-term operation of gold is recommended to buy on pullbacks as the main strategy, and sell on rebounds as a supplement!
Key points:
First support: 2910, second support: 2902, third support: 2890
First resistance: 2930, second resistance: 2936, third resistance: 2948
Operation ideas:
BUY: 2902-2905, SL: 2894, TP: 2920-2930;
SELL: 2937-2940, SL: 2949, TP: 2920-2930;

BTC updateBTC
is in either B wave to upside, yet it already completed ABC correction 5 wave
but looks like expanding in 5th wave, it may create ED to the upside. as 5th wave's first
wave is abc, and looks like3 is also abc, as per this 3 must not go beyond 94607 and correct below 90877 to complete 4th wave for ED.
Let see how it plays out

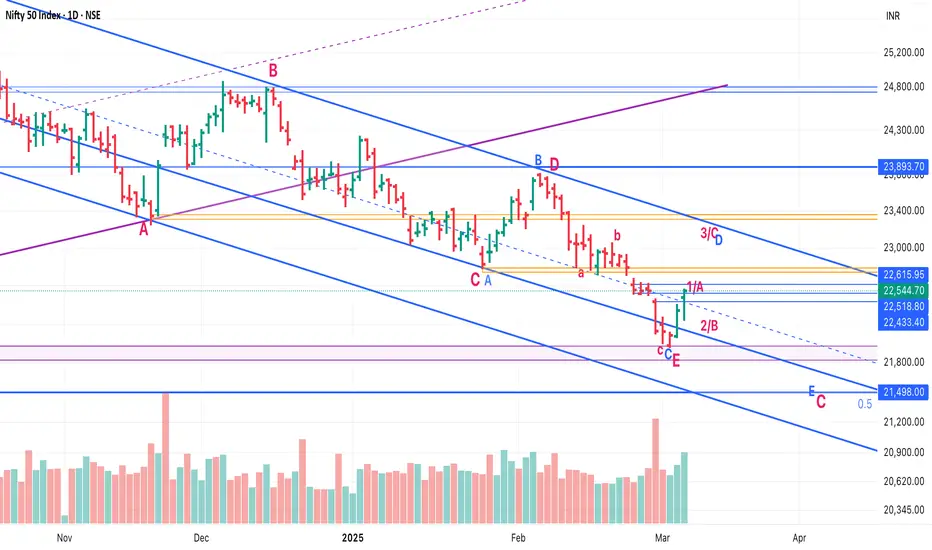
Nifty EW UpdateSo we had a good 2 days of upside.
I am changing the possibilities a bit:
1. Possibility 1 (Red): We are in larger Triangle (ABCDE - Red) E done and we have made a bottom. Wave 1 of next leg up seems done, we should expect a 2 now.
2. Possibility 2 (Blue): We are in a Larger ABC (Red) and C is further an ED (ABCDE - Blue).
In that case the leg up of last 2 days was an A.
We should expect a B down (22200-250) and C up (22800, 23050) which will complete D.
Post that, we will have a E of Red C down, mostly till 21500, 21200.
Still hoping red one holds, but no one knows. :)
Nifty 50 - Seems to RallyAfter a strong Wave 3 Rally,From the Top/High(26277)Since 27-september 2004,Nifty 50 Pulling back for Wave4 correction,
Where corrective pattern structure seems to be possible zigzag ABC ,While A made a sharp impulsive of %waves and C possibly finished Ending Diagonal.
A=C 100% ending at 21800(approx),and Wave 4 ending at 21400(approx) for 38% of Wave3.

nifty 50 Today Analysisnifty 50 Today Analysis
Market created Regualr flat pattern which is showing a reversal because its a complete corrective pattern.
From here as our wave analysis is saying the next target level for Nifty 50 is 24500 to 24800

Natural gas if break 364 then downtrend will start avoid buy cmpHow to take trades using Harmonic pattern projection Trade setup is explained below :-
Entry : 1st SL point : 0% is recent top or bottom.
Trailing D: 11.4% is work as trailing SL of buy or sell trade if hit then we have to book profit
.If price goes below 2nd D 21.4% to 23.6% range then early traders can make fresh reversals trade after breaking 1st D 11.4% safe traders can reversal trade after breaking Point D 21.4% to 23.6% range
Targets :
Target T1 : 35.1% to 38.3%
Target T3 : 49.1% to 53.2%
T3: 60.9% to 64.8% is our 3rd Target since this is reversal zone so must book profit if break then take fresh trade again
Target T4 : 76.4% to 79.7%
Next Targets are 100% , 127.2% ,141.4% and final Target 161.8%.
How to take reversal trade :
If price going upside/ downside then then buy or sell levels appear on Chart ( Automatically show when price reach any reversal zone of harmonic projection pattern based .
After showing reversal levels wait for confirmation until 21.4% or 28.3 % level not break if break then exit from current buy / sell trade and take fresh reverse trade buy/ sell .
Trailing SL:
After reach 1st Target trail SL to just above or below cost ( for example we are holding sell trade from 100 1st Target 110 hit then move trailing sl to 104-105 and move SL as price move upside or Downside)
Re- Entry :
For Re-entry in any pull back Point D ( 11.4% ) is used for re-entry then SL recent high or low Point SL ( 0% ) .
Blue Line is 1st support/ Resistance
Green line is 2nd support/ resistance
Red line is 3rd Support/ resistance

EUR/USD Trading Plan: Key Support, Resistance & Entry Points The European Central Bank (ECB) is anticipated to proceed with an interest rate cut, influenced by the U.S. administration's restraint from imposing broad trade tariffs. This expectation has solidified market sentiments towards monetary easing in the eurozone.
Key Support and Resistance Levels:
Support: 1.05946, 1.0574
Resistance: 1.0469
Trade Setup:
take profit 1.0700
sl 1.05800
echnical Analysis and Sentiment:
EUR/USD Rally: The EUR/USD pair surged 1.4% on Tuesday, climbing 140 pips in a single session as markets sold off the U.S. dollar amid expectations of tariff policy shifts.
Technical Indicators: According to Investing.com's technical analysis, the EUR/USD pair is currently exhibiting strong buy signals across various moving averages and technical indicators.
Alternative Scenario:
If the price fails to break above 1.0500 and shows signs of bearish reversal, consider entering a short position below 1.0480, with a take profit at 1.0376 and a stop loss at 1.0500.
Conclusion:
The EUR/USD currency pair is currently exhibiting bullish tendencies across multiple timeframes, supported by recent economic developments and technical indicators. Traders should monitor key levels and potential breakout points to capitalize on trading opportunities, ensuring proper risk management with well-defined entry and exit points.
✅ #forex
✅ #forextrading
✅ #forexanalysis
✅ #forexsignals
✅ #fxtrading
✅ #trading
✅ #eurusd
✅ #eurusdforecast
✅ #eurusdanalysis
✅ #eurusdtrading
✅ #eurusdsetup
✅ #eurusdsignal
✅ #technicalanalysis
✅ #priceaction
✅ #supportandresistance
✅ #trendanalysis
✅ #chartpatterns
✅ #elliottwave
✅ #swingtrading
✅ #daytrading
✅ #scalping
✅ #riskmanagement
✅ #tradingpsychology
✅ #tradingview
✅ #forexcommunity
@marketanalysis

Nifty EW UpdateConfusion remains:
Either bottom done in an ABC in E
OR it's just 3rd wave in C3 done and 4th going on.
Crossing 22800 should give confidence that it's not C3, and we could have made a bottom.
All in all, stocks are doing well, Metals, PSEs, Capital goods etc are already breaking above the levels they were at when Nifty was at 23k.

Confluence level - Nifty it can act as support or reversal 1. Downward regression channel bottom
2. Ascending Channel Bottom
3. Abc correct pattern 1:1
4. Previous Support level
What is confluence?
It's meeting point or multiple technical parameters coincides, like I mentioned above
What to expect?
1. Reversal if prices goes above 23400
2. If any short comming occurs next level could be 20200

Banknifty updated levels avoid fresh sell trade at current priceHow to take trades using Harmonic pattern projection Trade setup is explained below :-
Entry : 1st SL point : 0% is recent top or bottom.
Trailing D: 11.4% is work as trailing SL of buy or sell trade if hit then we have to book profit
.If price goes below 2nd D 21.4% to 23.6% range then early traders can make fresh reversals trade after breaking 1st D 11.4% safe traders can reversal trade after breaking Point D 21.4% to 23.6% range
Targets :
Target T1 : 35.1% to 38.3%
Target T3 : 49.1% to 53.2%
T3: 60.9% to 64.8% is our 3rd Target since this is reversal zone so must book profit if break then take fresh trade again
Target T4 : 76.4% to 79.7%
Next Targets are 100% , 127.2% ,141.4% and final Target 161.8%.
How to take reversal trade :
If price going upside/ downside then then buy or sell levels appear on Chart ( Automatically show when price reach any reversal zone of harmonic projection pattern based .
After showing reversal levels wait for confirmation until 21.4% or 28.3 % level not break if break then exit from current buy / sell trade and take fresh reverse trade buy/ sell .
Trailing SL:
After reach 1st Target trail SL to just above or below cost ( for example we are holding sell trade from 100 1st Target 110 hit then move trailing sl to 104-105 and move SL as price move upside or Downside)
Re- Entry :
For Re-entry in any pull back Point D ( 11.4% ) is used for re-entry then SL recent high or low Point SL ( 0% ) .
Blue Line is 1st support/ Resistance
Green line is 2nd support/ resistance
Red line is 3rd Support/ resistance

Nifty updated levels 22290 1st resistance avoid sell at cmpHow to take trades using Harmonic pattern projection Trade setup is explained below :-
Entry : 1st SL point : 0% is recent top or bottom.
Trailing D: 11.4% is work as trailing SL of buy or sell trade if hit then we have to book profit
.If price goes below 2nd D 21.4% to 23.6% range then early traders can make fresh reversals trade after breaking 1st D 11.4% safe traders can reversal trade after breaking Point D 21.4% to 23.6% range
Targets :
Target T1 : 35.1% to 38.3%
Target T3 : 49.1% to 53.2%
T3: 60.9% to 64.8% is our 3rd Target since this is reversal zone so must book profit if break then take fresh trade again
Target T4 : 76.4% to 79.7%
Next Targets are 100% , 127.2% ,141.4% and final Target 161.8%.
How to take reversal trade :
If price going upside/ downside then then buy or sell levels appear on Chart ( Automatically show when price reach any reversal zone of harmonic projection pattern based .
After showing reversal levels wait for confirmation until 21.4% or 28.3 % level not break if break then exit from current buy / sell trade and take fresh reverse trade buy/ sell .
Trailing SL:
After reach 1st Target trail SL to just above or below cost ( for example we are holding sell trade from 100 1st Target 110 hit then move trailing sl to 104-105 and move SL as price move upside or Downside)
Re- Entry :
For Re-entry in any pull back Point D ( 11.4% ) is used for re-entry then SL recent high or low Point SL ( 0% ) .
Blue Line is 1st support/ Resistance
Green line is 2nd support/ resistance
Red line is 3rd Support/ resistance

Silver mcx buy given above 94800 refer silver comex chart levelsHow to take trades using Harmonic pattern projection Trade setup is explained below :-
Entry : 1st SL point : 0% is recent top or bottom.
Trailing D: 11.4% is work as trailing SL of buy or sell trade if hit then we have to book profit
.If price goes below 2nd D 21.4% to 23.6% range then early traders can make fresh reversals trade after breaking 1st D 11.4% safe traders can reversal trade after breaking Point D 21.4% to 23.6% range
Targets :
Target T1 : 35.1% to 38.3%
Target T3 : 49.1% to 53.2%
T3: 60.9% to 64.8% is our 3rd Target since this is reversal zone so must book profit if break then take fresh trade again
Target T4 : 76.4% to 79.7%
Next Targets are 100% , 127.2% ,141.4% and final Target 161.8%.
How to take reversal trade :
If price going upside/ downside then then buy or sell levels appear on Chart ( Automatically show when price reach any reversal zone of harmonic projection pattern based .
After showing reversal levels wait for confirmation until 21.4% or 28.3 % level not break if break then exit from current buy / sell trade and take fresh reverse trade buy/ sell .
Trailing SL:
After reach 1st Target trail SL to just above or below cost ( for example we are holding sell trade from 100 1st Target 110 hit then move trailing sl to 104-105 and move SL as price move upside or Downside)
Re- Entry :
For Re-entry in any pull back Point D ( 11.4% ) is used for re-entry then SL recent high or low Point SL ( 0% ) .
Blue Line is 1st support/ Resistance
Green line is 2nd support/ resistance
Red line is 3rd Support/ resistance

Bajaj Finance Ltd (BAJFINANCE) Stock AnalysisGlobalTradeHub | Bajaj Finance Ltd (BAJFINANCE) Stock Analysis
Fundamental Analysis:
Bajaj Finance, a leading NBFC, benefits from strong loan growth, digital transformation, and a diversified portfolio across consumer and SME lending. Consistent profitability and low NPAs make it a strong player. Risks include rising interest rates and economic slowdowns affecting credit demand.
Technical Analysis:
The stock is facing resistance near ₹7,250. A breakout could push it toward ₹7,500. Strong support is at ₹6,900, and a breakdown may lead to ₹6,600. RSI around 62 suggests bullish momentum but nearing overbought territory.
Key Levels:
- Resistance: ₹7,250 / ₹7,500
- Support: ₹6,900 / ₹6,600
Conclusion:
Bajaj Finance remains fundamentally strong. A breakout above ₹7,250 could trigger further upside, while dips to support zones offer buying opportunities. 💰📈

Nifty MetalPeople are getting excited about a BreakOut in the Metal Index. I beg to differ. This is just a COUNTER RALLY and the actual BREAKDOWN awaits. It is going to be a LONG drawn Move

SnP 500When I said at the end of January 25..... that the Dow was in a HnS formation..... I had calculated the Retracement on the SnP as well. SnP hit a new high and that was just to take out all the shorts on the Futures, and since then it hasn't stopped. Just a reminder what what I had written and the retracement thereof

Ajmera Realty & Infra India Ltd (AJMERA) Stock AnalysisGlobalTradeHub | Ajmera Realty & Infra India Ltd (AJMERA) Stock Analysis
Fundamental Analysis:
Ajmera Realty, a key player in real estate and infrastructure, benefits from strong housing demand, urbanization, and government initiatives like affordable housing. The company has a solid project pipeline, but risks include interest rate hikes and sector cyclicality.
Technical Analysis:
The stock is facing resistance near ₹480. A breakout could push it toward ₹520. Strong support is at ₹440, and a breakdown may lead to ₹400. RSI around 60 suggests bullish momentum but nearing overbought levels.
Key Levels:
- Resistance: ₹480 / ₹520
- Support: ₹440 / ₹400
Conclusion:
Ajmera Realty remains strong in the growing real estate sector. A breakout above ₹480 could drive further gains, while dips to support zones may offer buying opportunities. 🏗️📈
