ZENTECH Bullish Breakout: Falling Wedge Resolves Within Long-TerZENTECH is currently trading within a long-term triangle structure, indicating prolonged consolidation before a directional move.
On the intermediate timeframe, price has broken out of a falling wedge pattern, which is a classic bullish reversal setup.
The breakout is confirmed above the ₹1384 zone, which now acts as an important support.
If price sustains above this breakout level, the structure suggests a continuation towards higher levels.
📈 Minimum projected target: ₹1600
As always, watch for volume confirmation and price holding above the breakout zone for further strength.
#ElliottWave #ChartPatterns #FallingWedge #Triangle #BullishBreakout #TechnicalAnalysis
Wedge

Tata Steel (4H) - Late Stage Structure: Ending Diagonal in PlayThe price action in Tata Steel on the 4H timeframe is showing characteristics of a potential Ending Diagonal forming near the tail end of the advance.
From the Wave 4 low at 177.33 , the rise has not developed as a clean 5-wave impulse . Instead, the internal structure so far appears corrective , unfolding in three waves , which keeps the Ending Diagonal scenario valid.
Structure Assessment
Wave (iii) of the 5th wave appears complete
The ongoing move is likely Wave (iv)
Cardinal rule of an Ending Diagonal: Wave (iv) must overlap Wave (i) by trading below ~191
If this overlap condition is satisfied, the final Wave (v) is expected to unfold as a three-wave advance , completing the Ending Diagonal.
Implications
Ending Diagonals typically signal trend exhaustion rather than continuation . Once the structure completes, the probability of a larger corrective phase increases.
Invalidation
No overlap below 191 weakens the Ending Diagonal view
A strong impulsive decline instead of a choppy correction would require a reassessment
For now, the focus remains on structure and rule compliance, not prediction.
Disclaimer:
This analysis is for educational purposes only and does not constitute investment advice. Please do your own research (DYOR) before making any trading decisions.

AWHCL - Clear Breakout with Volume SurgeAWHCL was forming falling wedge for the last 1 year and it now broke the resistance. Volume is huge which supports the breakout. Now the stock is retesting the resistance line before making a move up.
SL would be below 553.
This is not an investment advice

HDFCBANK 4HR T/F ANALYSIS----
hdfcbank 4hr t/f analysis----- the top whole structure are bended both side which called structure is elips and it`s also dual direction in cans breakdown of elips into downside so we can measure elips of previous demand can measure body to body measure only green holding volume and interchange into supply so now we have a reversal area in this reversal zone wait for any bullish candle it`s help to confirmation to go with trend ok let`s see---

USDCAD 4HR T/F ANALYSIS----
usdcad 4hr t/f analysis----- after parallel channel breakdown we can measure marked supply which are repeated here so after supply complete then we can see demand from reversal portion and wait for also bullish candle on reversal portion it`s a confirmation to get right trade ok let`s see---

ABLBL: Falling Channel Study — Reversal Base + Swing Opportunity1️⃣ Primary Trend: Falling Channel (Bearish to Neutral)
Price has been moving inside a well-defined descending channel (lower highs & lower lows).
This indicates controlled selling, not panic — which is important for future reversals.
The stock is currently near the lower band of the channel, a typical area where:
Short covering starts
Value buyers enter
2️⃣ Support Zone & Reversal Signs
Strong demand zone: ₹114 – ₹118
Multiple rejections from this area
Long lower wicks indicate buying interest
This zone has acted as a base, increasing probability of a pullback move.
Breakout Levels to Watch (Very Important)
Immediate resistance: ₹133 – ₹134
Horizontal resistance + mid-channel zone
First sign of strength if crossed with volume
Major trend change confirmation: ₹150 – ₹152
Break & sustain above this = channel breakout
Can shift structure from downtrend → trend reversal
Swing Trading Perspective
Inside-channel swing opportunity:
Bounce from lower channel → mid / upper channel
Upside swing zones:
Target 1: ₹133–135
Target 2: ₹145
Target 3 (only if breakout): ₹150–155
🧠 What This Chart Is Saying (Simple Words)
Selling pressure is slowing down.
The stock is building a base near support.
A short swing bounce is likely first.
A trend reversal only happens above ₹150.
⚠️ Important Note
This analysis is for educational & learning purposes only.
Not a buy or sell recommendation.

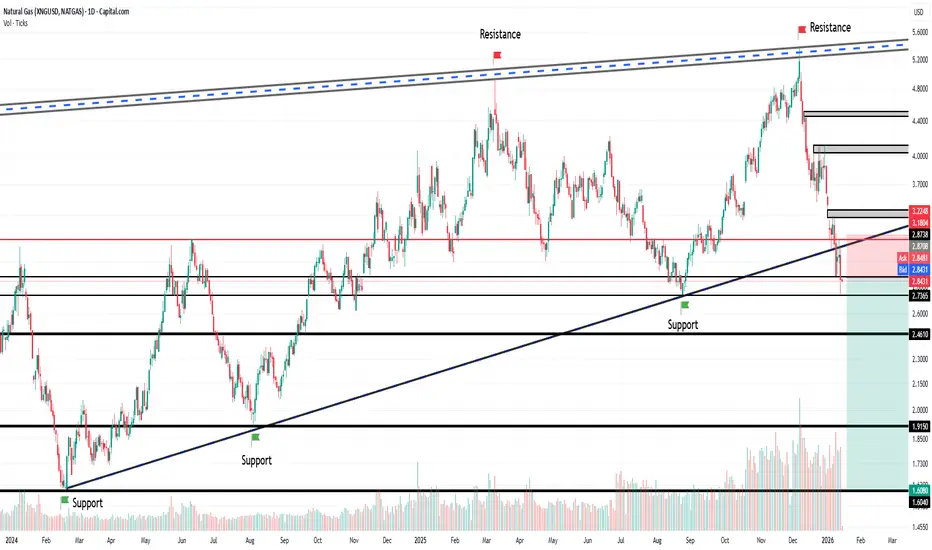
NG : Raising wedge breakdown• NG was trading in a wedge from Jan-2023.
• The wedge is clearly broken on 9th Jan
• Retest of the wedge is completed on14th Jan.
• SL and Target are mentioned in the chart.
• RR is 1:4.
• Educational purpose only. Happy learning
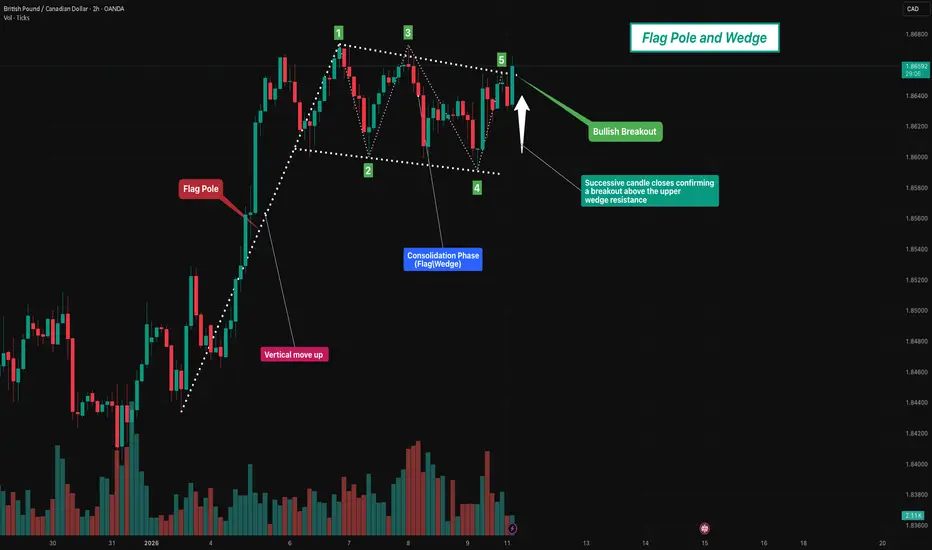
Flag pole and Wedge🧭 Overview
The chart illustrates a strong bullish impulse followed by a descending wedge formation, a well-known trend continuation structure.
After a sharp upward move (flag pole), price enters a controlled pullback where volatility contracts, forming lower highs and slightly lower or stable lows.
This setup represents a healthy pause in the trend, indicating accumulation and preparation for a potential bullish continuation.
⸻⸻⸻⸻⸻⸻⸻⸻⸻⸻⸻⸻⸻
📊 Chart Observations
1. The initial move shows strong bullish momentum, creating the flag pole with decisive candles.
2. Following the impulsive rally, price starts forming Lower Highs, indicating short-term profit booking.
3. Simultaneously, the lows remain controlled and gradual, shaping a descending wedge structure.
4. Price consolidates within the wedge, reflecting volatility contraction and market balance.
5. The prior flag pole suggests that the dominant trend remains bullish, favoring continuation rather than reversal.
6. As the wedge tightens, pressure builds for a breakout, typically in the direction of the prevailing trend.
7. Confirmation: A valid bullish continuation is confirmed when successive candles close above the upper wedge trendline.
⸻⸻⸻⸻⸻⸻⸻⸻⸻⸻⸻⸻⸻
🟢 Summary
Structure: Flag Pole + Descending Wedge
Market Context: Strong uptrend with healthy corrective consolidation
Trade Bias: Bullish — focus on breakout above the upper wedge boundary
Key Validation: Consecutive candle closes above wedge resistance
⸻⸻⸻⸻⸻⸻⸻⸻⸻⸻⸻⸻⸻
⚠️ Disclaimer
📘 For educational purposes only
🙅 Not SEBI registered
❌ Not a buy/sell recommendation
🧠 Shared purely for learning and pattern understanding
📊 Not Financial Advice
Crompton Greaves Falling?Technical (upgrade)
Crompton Greaves Consumer Electricals has been sliding inside a falling wedge, but price is trying to base around ₹248-252 (teal support on your chart). A daily close above ~₹260–262 (wedge top/near-term trendline) would confirm a breakout and set up a move toward ₹275 first and ₹300 next If price fails and closes back below ₹248, treat it as a false start and expect the downtrend to resume keep risk tight in that zone.
Fundamentals (quick, clean)
Latest print showed mixed trends—Q2 FY26 consolidated revenue ~₹1,915.6 cr, PAT ~₹75.4 cr, with margin pressure; the quarter also carried an exceptional ₹20.36 cr charge for the Vadodara plant restructuring. Butterfly (kitchen appliances) grew double‑digits YoY and lighting rose ~3% YoY, partly offsetting weakness in electric consumer durables. The company fully repaid its ₹300 cr NCDs in Jul‑2025 and said it is net‑cash/zero‑debt, which is a positive for flexibility. Valuation and efficiency are mid‑pack for consumer durables (P/E ~34–35; P/B ~4.3–4.9; ROE ~13–15%; ROCE ~15–19%). Net‑net: fundamentals are stable but margins need rebuilding—if your chart gets the ₹260–₹262 breakout, technicals can align with a gradual recovery story.
Like, comment your thoughts, and share this post
Explore more stock ideas on the right hand side your feedback means a lot to me!
Disclaimer: This post is for educational purposes only and should not be considered a buy/sell recommendation.

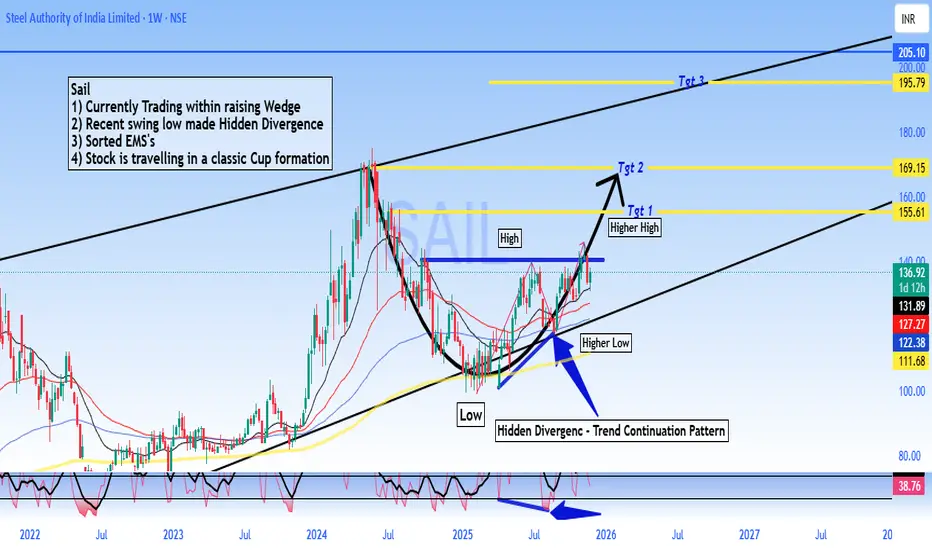
SAIL - Buy - Technical Analysis# Steel Authority of India Limited (SAIL) - Technical Analysis Report
Current Price: 136.92
Timeframe: Weekly Chart Analysis
Technical Setup Overview
SAIL is presenting a compelling technical picture with multiple bullish indicators aligning for a potential significant upward move. The stock is currently trading within a well-defined rising wedge pattern and has recently formed a **Hidden Divergence** on the weekly chart - a classic trend continuation signal.
Key Technical Observations
Rising Wedge Pattern:
The stock is trading within a rising wedge formation, which typically indicates consolidation before a breakout. The current price action suggests the stock is in the later stages of this pattern.
Hidden Divergence - Bullish Continuation Signal:
A **Hidden Divergence** has formed on the weekly timeframe.
- This pattern typically signals trend continuation and suggests the uptrend is likely to resume with strength
Sorted EMA Structure:
The Exponential Moving Averages are properly aligned, indicating a healthy bullish trend structure with multiple moving averages providing dynamic support.
Cup Formation in Progress:
The stock appears to be carving out a **classic Cup pattern**, which is a well-known bullish continuation formation. This pattern suggests accumulation and potential for a significant breakout move.
Price Targets & Projections
Based on the technical structure, here are the potential price targets:
Target 1: 155.61 (Higher High breakout level)
Target 2: 169.15
Target 3: 195.79
These targets are derived from the pattern structure and represent key resistance zones where profit-taking may occur.
Trading Strategy Considerations
For Swing Traders:
- Current levels offer a potential entry opportunity for medium to long-term positions
- A move above ₹140 could confirm the continuation pattern
- Stop loss can be placed below the recent higher low at 122 for risk management
Risk Factors to Monitor
- Failure to hold above ₹122 would invalidate the bullish hidden divergence
- Breakdown below the rising wedge support would change the outlook
- Sector performance and broader market conditions should be monitored
- Steel industry fundamentals and commodity price trends
🔔 Conclusion
SAIL is exhibiting strong technical characteristics with the Hidden Divergence pattern, sorted EMA structure, and cup formation all pointing toward potential upside. The current price action within the rising wedge presents an interesting risk-reward setup for traders and investors with appropriate risk management.
DISCLAIMER
This analysis is for educational and informational purposes only and should NOT be considered as investment advice or a recommendation to buy, sell, or hold any securities. - I am not a SEBI registered analyst or investment advisor - This is purely a technical analysis based on chart patterns and indicators - Past performance and technical patterns do not guarantee future results - Trading and investing in stocks involves substantial risk of loss - Always conduct your own research and due diligence before making any investment decisions - Consult with a qualified financial advisor before taking any investment positions - The author holds no responsibility for any profits or losses incurred based on this analysis - Risk management and position sizing are crucial - never invest more than you can afford to lose
**Trade/Invest at your own risk. Do your own analysis.**
#SAIL #SteelAuthorityOfIndia #StockMarket #TechnicalAnalysis #NSE #IndianStocks #ChartAnalysis #TradingView #StockTrading #HiddenDivergence #CupPattern #PriceAction #SwingTrading #Investing #MarketAnalysis #SteelSector #Commodities #TradingStrategy #ChartPatterns #TechnicalIndicators
Strides Pharma - Volumes Backing a Breakout?Daily Timeframe Analysis
The setup is heating up and now we’ve got volume profile data to back it. The price is hovering around ₹666.10, and it looks like it's building strength for a bigger move.
🔹 Key Observations:
Price is compressing under a falling trendline (descending triangle or wedge).
Strong volume node around the ₹650–₹675 zone. This means a lot of trading activity happened here — a key decision area.
Fibonacci projections suggest targets as high as ₹984.00, which is a +40% upside.
Breakout confirmation above ₹692.75 (61.8% level) can trigger a rally.
🔹 Important Levels:
📍 Resistance: ₹692.75 → ₹741.65 → ₹804.00 → ₹984.00
📉 Support: ₹624.00 → ₹581.50 → ₹530.00 → ₹515.20
📊 Volume Insight:
The visible range volume profile shows most trading volume has happened below the current price, which is bullish. If the price breaks above the current squeeze, it might fly with less resistance overhead.
🧠 Thought:
This chart is a coiled spring. If bulls push above ₹692 with momentum, this might become a quick swing to ₹740+, and maybe more in the short to medium term.
📝 #StridesPharma #BreakoutSetup #VolumeProfile #SwingTrade #IndianStocks

Rising Wedge - Bearish setup🔎 Overview
The Rising Wedge is a price structure that develops during an upward phase where price continues to make higher levels, but the rate of advance gradually slows. The narrowing structure reflects weakening participation as price moves higher, often signaling exhaustion rather than strength.
------------------------------------------------------------
📘 Concept
A Rising Wedge is formed when price creates Higher Highs (HH) and Higher Lows (HL) inside a tightening upward channel.
Although price is still moving upward, each push higher covers less distance, indicating fading momentum and increasing imbalance between effort and result.
------------------------------------------------------------
📊 Chart Explanation
1️⃣ Higher Highs & Higher Lows
Price initially forms HH and HL, confirming an established upward structure and buyer control in the early phase.
2️⃣ Narrowing Upward Channel
The distance between highs and lows contracts as price rises, showing slowing momentum and reduced follow-through at higher levels.
3️⃣ Consolidation Near the Upper Range
Price pauses and compresses near the upper boundary of the wedge, highlighting balance and short-term indecision.
4️⃣ Momentum Weakening
Repeated tests near the upper boundary fail to generate strong expansion, indicating declining buyer participation.
5️⃣ Structural Shift Confirmation
• Weakening buyer strength becomes visible as price struggles to hold higher levels.
• Successive candle closes below the lower wedge trendline confirm a structural shift and validate the bearish reversal.
------------------------------------------------------------
📝 Summary
Rising Wedge reflects slowing upside momentum within an upward structure.
Price compression signals exhaustion rather than continuation.
Consolidation near the top highlights market indecision.
A confirmed close below the lower wedge line marks the directional shift.
------------------------------------------------------------
⚠️ Disclaimer
📘 For educational purposes only.
🙅 Not SEBI registered.
❌ Not a buy/sell recommendation.
🧠 Purely a learning resource.
📊 Not Financial Advice.

Sensex - Expiry day analysis Dec 17The price faced resistance from the 84900 zone and fall towards the support at the 84500 zone. It broke 84500, and the bulls came to push the price up. This movement has formed a falling wedge pattern. The pattern is bullish, but the opening strength will decide the trend direction.
The daily chart clearly shows how the price is facing resistance from the channel and is still bearish.
If the price opens flat, buy above 84540 with the stop loss of 84400 for the targets 84660, 84780, 84960, 85080 and 85200.
84900, 85000 can act as resistance. If the price opens gap up at resistance levels and shows bearish strength, the falling wedge pattern won't work.
If the price opens below 84500 and shows bearish strength, sell below 84240 with the stop loss of 84400 for the targets 84100, 83960, 83800 and 83660.
Always analyse the market before taking any trade.

Nifty Prediction for Tomorrow 18 December 2025 | Thursdaysupport 25750, 25714
resistance 25930, 26000
bear trap. market might consolidate between 26000 and 25650 till expiry

Ingersoll Rand: When the Bullish Wedge Fails (Bearish Breakdown)The Setup Traders often look at Falling Wedges and blindly assume a bullish reversal is coming. Ingersoll Rand (NSE: INGERRAND) has just provided a textbook example of why "Assumption" is dangerous in trading.
Instead of breaking out to the upside, the price has sliced through the Lower Support Trendline on the Daily timeframe.
Technical Breakdown (The "Trap"):
Pattern Failure: The stock was forming a Falling Wedge (usually bullish). The market expected a bounce from the lower support.
The Invalidating Move: The recent heavy-volume candle breaking below the wedge support changes the structure entirely.
Psychology of the Short: Bulls who accumulated at the support line are now trapped. As their Stop Losses get hit, it creates a cascade of selling pressure (Long Liquidation).
Trade Management (Bearish):
Signal: The daily close below the wedge support (Current levels: ~3,438).
Conservative Entry: Wait for a "Retest" of the broken trendline from below (proving old support has become new resistance).
Trend Invalidation: A daily close back inside the wedge (above ~3,550). If it re-enters, the breakdown was a "Bear Trap."
Potential Target: Since this is a continuation of the downtrend, we look at the next major structural support zones (Psychological levels like 3,200 or 3,000).
Risological Note: We trade what we see, not what the textbook says should happen. A failed bullish pattern is often a stronger bearish signal than a standard downtrend.

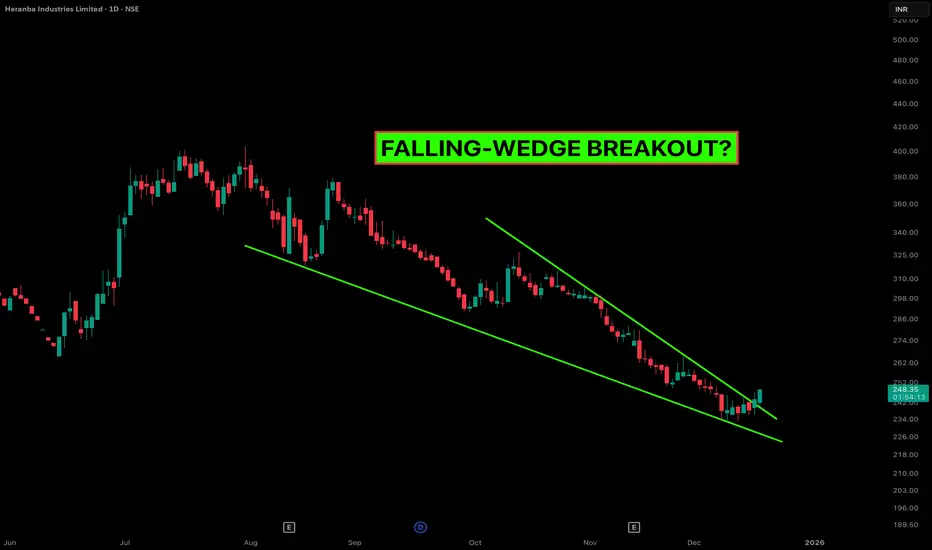
Heranba Industries: Why Falling Wedges Often Mark the BottomThe Setup Heranba Industries (NSE: HERANBA) has been in a corrective phase for months, but the structure has now matured into a classic Falling Wedge Pattern on the Daily timeframe.
For those new to this pattern: A Falling Wedge is a bullish reversal pattern. It is characterized by "Lower Highs" and "Lower Lows" contracting into a narrower range. This contraction signals that selling pressure is exhausting and buyers are stepping in at higher relative lows.
Technical Breakdown:
Price Action: The price has respected the upper trendline resistance multiple times. The recent breakout candle suggests a shift in momentum.
The Psychology: Notice how the selling waves are getting shorter? This "compression" usually precedes an expansion in volatility (the breakout).
Volume Profile: We are looking for a spike in volume to confirm the breakout validity. A low-volume breakout is often a trap, so watch the close.
Trade Management (Educational View):
Aggressive Entry: On the immediate break of the upper trendline (Current Levels: ~247-248).
Conservative Entry: Waiting for a "Retest" of the trendline around 240-242 to confirm support.
Stop Loss: Strictly below the recent swing low (invalidate the pattern if price falls back into the wedge).
Targets: The theoretical target of a wedge is often the top of the wedge structure (the origin of the pattern).
Risological Note: We track these compression patterns because they offer high Risk-to-Reward ratios. We are not predicting the future; we are reacting to probability.
#SILVER #Silver has given multi week consolidation breakout on MCX, there is high probability of it going toward that much awaited 6 digits mark very soon. The breakout also looks very health as it has consolidated well enough for quite some time near ATH resistance.
RSI has also broken out of a particular triangle pattern and indicating a RSI range shift, which potentially means the momentum can be very high..

Eicher Motors Near the Edge: Wedge TightensEicher Motors has seen a strong advance in recent months, but the current price structure suggests the move may be losing momentum . Price is forming a rising wedge with higher highs and higher lows, where the lower trendline is rising faster than the upper one — a classic sign of compression and weakening upside strength .
Despite price holding near recent highs, the advance has become increasingly overlapping, indicating buyer fatigue rather than fresh accumulation. Such behavior is typical of late-stage trends , where upside progress slows even as prices drift higher.
No reversal has occurred yet. The structure remains intact until price delivers confirmation. A decisive daily close below the rising wedge support would signal a bearish resolution, while sustained acceptance above the wedge resistance would invalidate the setup.
For now, this remains a watch-and-wait structure , with risk skewed toward a downside resolution if support gives way.
Disclaimer: This analysis is for educational purposes only and does not constitute investment advice. Please do your own research (DYOR) before making any trading decisions.

Hindalco: Terminal Wedge, Reversal Risk HighStructural Context
Initially, I considered the decline from 864 toward 770 as a standard ABC correction. But the drop from Wave 2 was far too sharp and drove RSI into deep oversold territory — behaviour that aligns better with impulsive price action.
Because of this, the move is treated as a developing 1-2-3 rather than a corrective ABC.
This adjustment also aligns perfectly with the broader structure: a completed Wave 3 at 770.15, followed by a three-wave recovery into Wave 4.
Wave 4 Completion – Ending Diagonal + Fibonacci Symmetry
Wave C of the larger Wave 4(ABC Flat) shows a clean ending-diagonal wedge, and Wave (v) within it reached the 1.618 extension of Wave (i) measured from Wave (iv).
This Fibonacci precision adds strong weight to the interpretation that Wave 4 has completed at 833.50.
With this level established, the minor bounce into Wave (ii) now acts as the corrective pullback before the expected third wave down.
Invalidation remains at the 1.618 level around 833.50 — any move above that would negate the immediate bearish view.
Path Ahead – Toward Wave 5
As long as 833.50 holds, the expectation is for a five-wave decline toward the previous structural support near 770.15, completing Wave 5.
Wave (iii) should ideally accelerate, and momentum confirmation will be key as price moves into the mid-780s.
Disclaimer
This analysis is for educational purposes only and does not constitute investment advice. Please do your own research (DYOR) before making any trading decisions.

ABBABB is completed its correction and ready to make a all time high again.
There will be breakout soon above trend-line.
Above 5480, we can see sharp upside rally and all target will hit one by one.
Good to accumulate on every dipper level and hold for the long time to gain good returns.

Triple Base Wedge Setup📌 Overview
This idea highlights a contracting price structure forming inside a Falling Wedge while the support base remains protected three separate times. The repeated defense of the same support zone creates a Triple Base, indicating strong demand. As volatility compresses and candles tighten, price approaches a potential expansion point. A strong successive close above the wedge trendline can signal directional continuation driven by the triple-base foundation.
---------------------------------------------------------------------
📊 Chart Explanation
• Falling Wedge Compression
Price is compressing inside a falling wedge, forming lower highs while key lows remain protected — showing reduced volatility and tightening structure.
• Candle Tightening Phase
Candles begin to cluster more closely, indicating a buildup of pressure before the next expansion move.
• Triple Base Support
Price has tapped the same support level three times, demonstrating steady demand and buyers absorbing sell pressure each time.
• Decreasing Seller Strength
As the wedge narrows, each push downward becomes weaker, showing sellers losing momentum while price continues to hold above the same support region.
• Possible Breakout Trigger
A strong successive close above the upper wedge trendline can act as a confirmation signal for upward continuation supported by triple-base strength.
---------------------------------------------------------------------
🟩 Summary
Price is contracting inside a falling wedge structure.
Support has been tested three times, forming a strong Triple Base.
Candles show compression, indicating market indecision before expansion.
A successive close above the wedge trendline may confirm directional continuation.
---------------------------------------------------------------------
⚠️ Disclaimer
📘 For educational purposes only.
🙅 Not SEBI registered.
❌ Not a buy/sell recommendation.
🧠 Purely a learning resource.
📊 Not Financial Advice

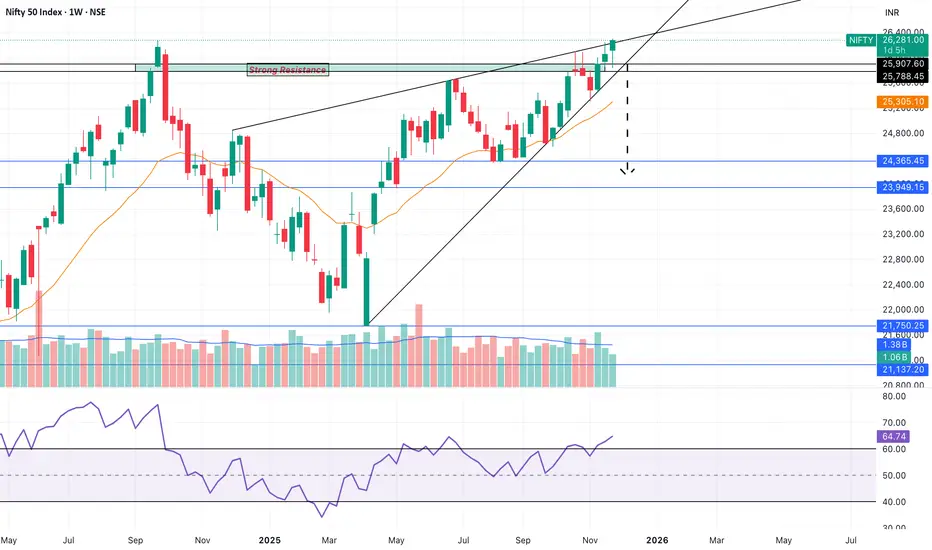
Rising Wedge pattern in NiftyRising Wedge pattern in Nifty (SL daily candle close)
Short Nifty below @25800
SL 26104
Target : 24365-23949
CMP 26306 @ Nov 27, 2025
Disclaimer: Sharing my personal market view — only for educational purpose not financial advice.
Hindustan Petroleum Corporation Ltd – Weekly Chart AnalysisPricePrice has been moving inside a rising wedge structure, forming higher highs & higher lows over the past several months. Recently, the stock attempted a breakout above the wedge resistance but is now trading near the upper trendline, showing signs of pullback or retest behavior.
Volume has remained moderate, suggesting the market is waiting for a clear direction.
Now price action is at a decision zone — either a successful retest could resume bullish momentum, or failure may lead to profit-booking and a slide toward lower support trendlines.
This zone becomes crucial for directional clarity.
