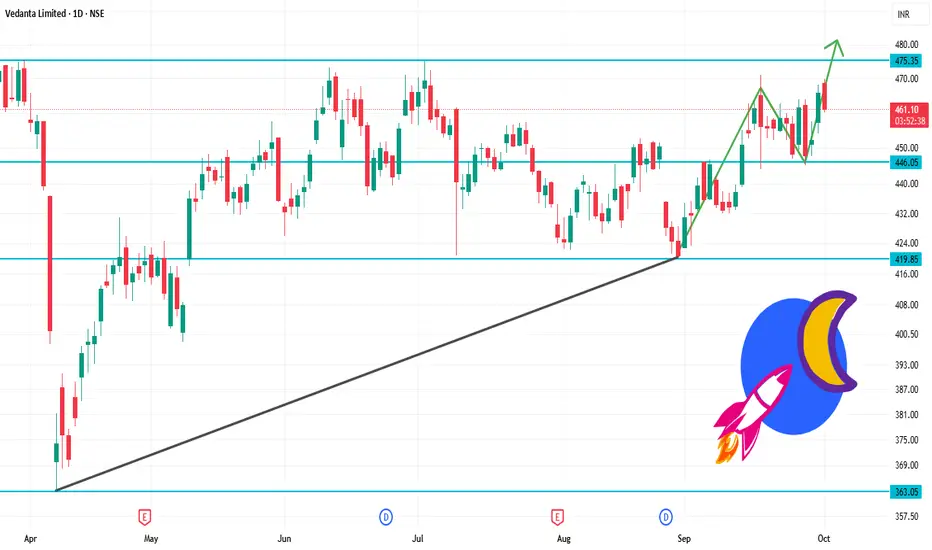
VEDL 1D Time frameOpening Price: ₹468.55
Closing Price: ₹461.40
Day Range: ₹463.00 – ₹469.85
Volume: 2,730,213 shares traded
📉 Trend Analysis
Short-Term Trend: Bearish – The stock is trading below key moving averages, confirming the bearish trend.
Medium-Term Trend: Neutral – The stock is in a consolidation phase, characterized by lower highs and lower lows.
Long-Term Trend: Neutral – No significant trend identified; the stock is trading within a range.
🔮 Conclusion
Vedanta Ltd. is in a bearish trend with weak momentum.
Break below ₹460.00 could lead to further decline toward ₹455.00.
Break above ₹475.00 would indicate a potential trend reversal.
Wipro
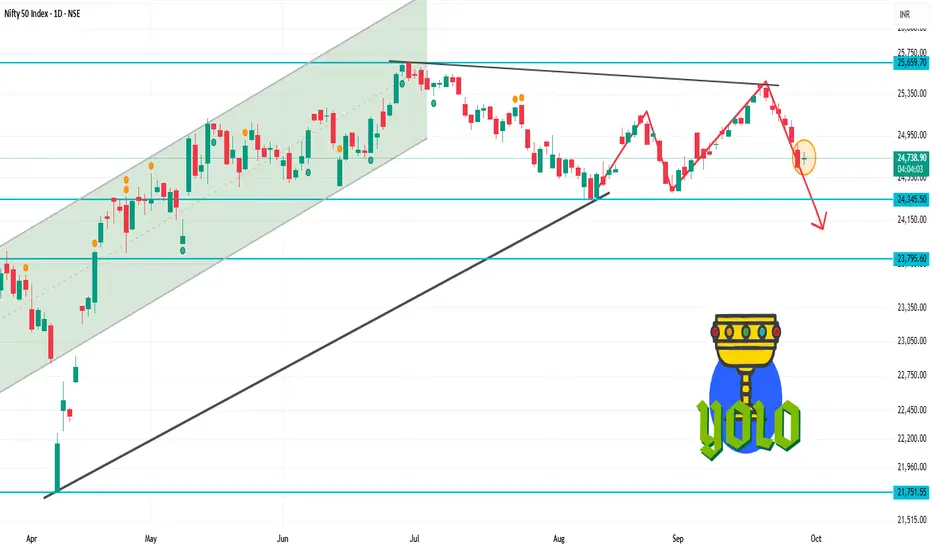
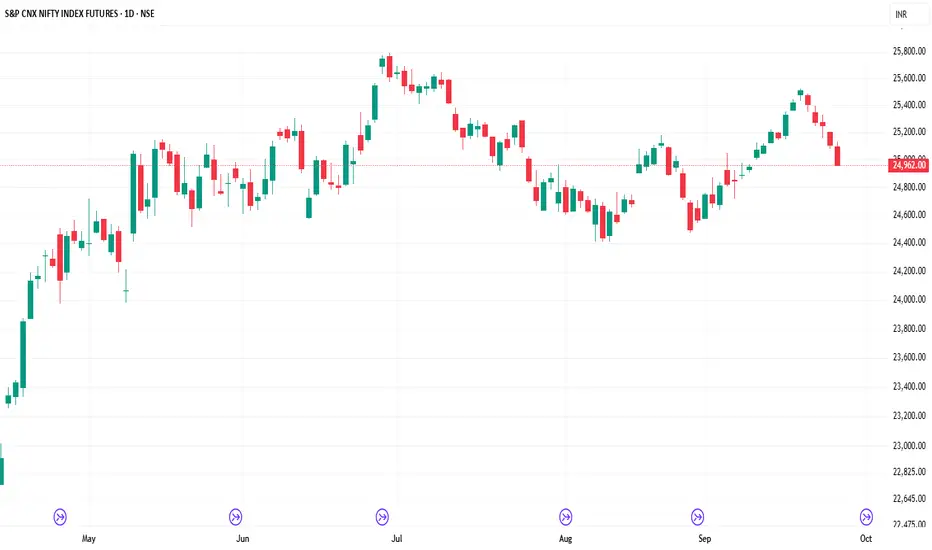
NIFTY 1D Time frameOpening Level: ₹24,691.10
Current Level: ₹24,765
Day's Range: ₹24,500 – ₹24,900 (approximate)
🔑 Key Support & Resistance Levels
Immediate Support: ₹24,500
Immediate Resistance: ₹24,900
Pivot Point: ₹24,765
📊 Market Sentiment
Trend: The NIFTY 50 has experienced a six-day losing streak, indicating bearish momentum.
NDTV Profit
Volume: Trading volume is higher than average, suggesting increased investor activity.
📈 Strategy (1D Timeframe)
1. Bullish Scenario
Entry: Above ₹24,900
Stop-Loss: ₹24,500
Target: ₹25,100 → ₹25,300
2. Bearish Scenario
Entry: Below ₹24,500
Stop-Loss: ₹24,900
Target: ₹24,300 → ₹24,100
⚠️ Risk Management
Limit risk to 1% of capital per trade.
Always use stop-loss to protect against unexpected market movements.
Monitor broader market trends and sector-specific news that may impact index performance.
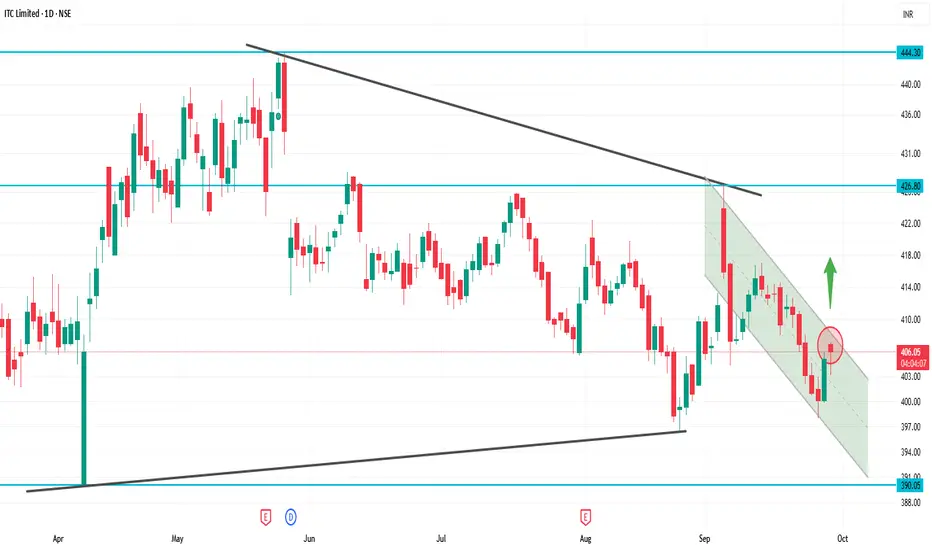
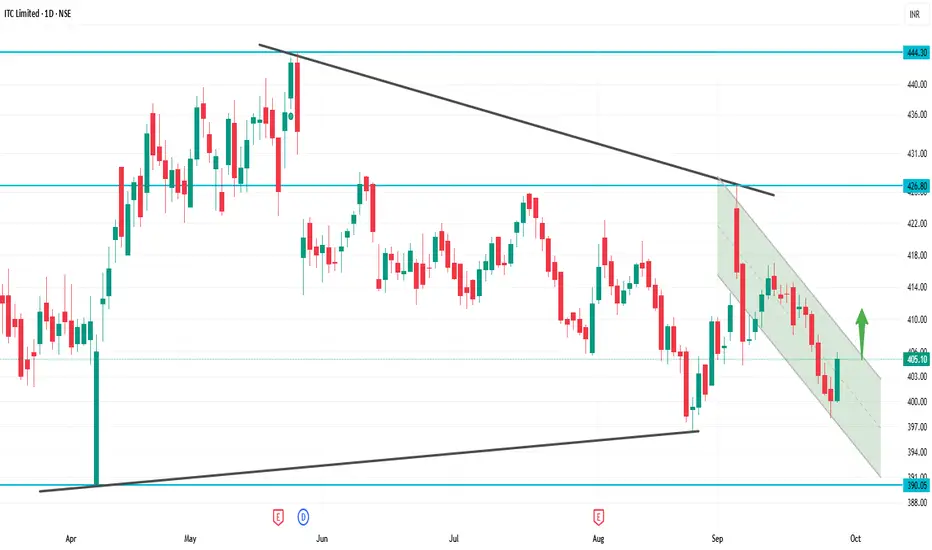
ITCITC Daily Snapshot
Current Price: ~₹405
Day’s Range: ~₹401 – ₹406
🔍 Key Levels
Support: Around ₹399 – ₹401 (near-term buying zone)
Resistance: Around ₹409 – ₹412 (supply zone)
📈 Technical Picture
Trend: Slightly bearish to sideways, but stabilizing above ₹405 gives some strength
RSI (Daily): Neutral zone, neither overbought nor oversold
Moving Averages: Price is close to short-term averages, so a decisive breakout above ₹409 is needed for bullish confirmation
VWAP: Trading near VWAP, showing balance between buyers and sellers
✅ Summary
At ₹405, ITC is near the middle of its range.
If it holds above ₹405 and breaks ₹409–₹412, bullish momentum can pick up.
If it falls below ₹401, it may retest support near ₹398.
ITC 1D Time frame📊 Updated Snapshot
Current Price: ~₹405
Day Range: ₹402 – ₹410
52-Week High: ₹499
52-Week Low: ₹399
📈 Technical Outlook
Support Zones:
Strong support at ₹405 (current zone)
Next support at ₹398
Resistance Zones:
Immediate resistance at ₹410–₹416
Next resistance at ₹421
Trend Bias: Weak bearish → stock is near 52-week low, testing crucial support.
📌 Step-by-Step View
If it holds above ₹405–₹398: Buyers may step in, possible bounce toward ₹416–₹421.
If it breaks below ₹398: More downside risk opens, weakness can extend further.
Upside revival only above ₹421 closing: That will change trend toward bullish.
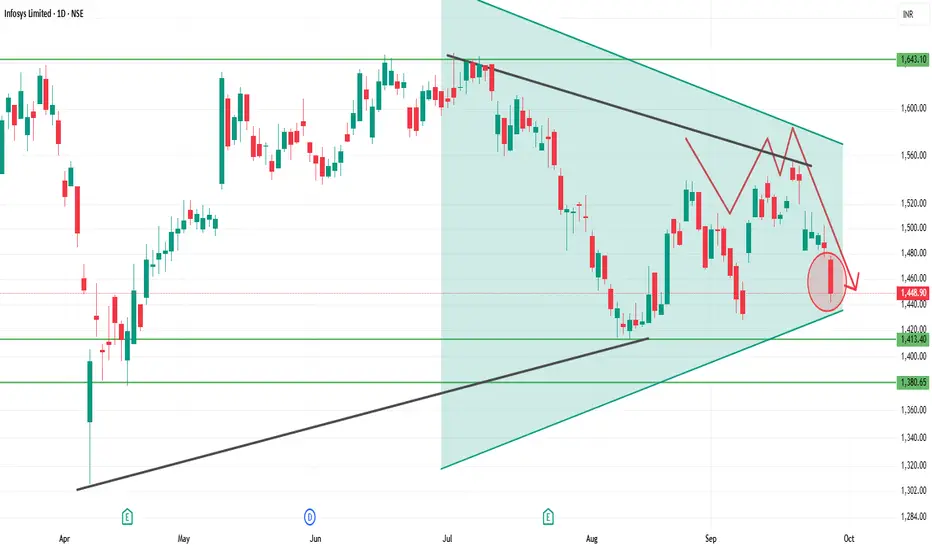
INFY 1D Time frameCurrent Zone: Around ₹1,448 – 1,450 (important support area).
Support Levels:
First support: ₹1,440 – ₹1,448
Next deeper support: ₹1,410 – ₹1,420
Resistance Levels:
Immediate resistance: ₹1,475 – ₹1,485
Strong resistance: ₹1,500 – ₹1,510
Trend Outlook:
Holding above ₹1,448 can trigger a short-term bounce.
Weakness below ₹1,440 may drag it toward ₹1,410.
A close above ₹1,485 would open upside toward ₹1,510+.
LT 1D Time frameClosing Price: ₹3,644.40
Day’s Range: ₹3,635.70 – ₹3,704.00
Previous Close: ₹3,657.60
Change: Down –0.80%
52-Week Range: ₹2,965.30 – ₹3,963.50
Market Cap: ₹5.13 lakh crore
P/E Ratio (TTM): 32.31
Dividend Yield: 0.93%
EPS (TTM): ₹112.81
Beta: 1.20 (indicating moderate volatility)
🔑 Key Technical Levels
Immediate Support: ₹3,635 – ₹3,640
Immediate Resistance: ₹3,700 – ₹3,710
52-Week High: ₹3,963.50
52-Week Low: ₹2,965.30
📈 Technical Indicators
RSI (14-day): 45.2 – indicating a neutral condition.
MACD: Negative, suggesting bearish momentum.
Moving Averages: Trading below the 50-day and 200-day moving averages, indicating a bearish trend.
📉 Market Sentiment
Recent Performance: L&T experienced a decline of 0.80% on September 25, 2025, underperforming the broader market.
Volume: Trading volume was significantly higher than its 20-day average, indicating increased investor activity.
📈 Strategy (1D Timeframe)
1. Bullish Scenario
Entry: Above ₹3,700
Stop-Loss: ₹3,635
Target: ₹3,750 → ₹3,800
2. Bearish Scenario
Entry: Below ₹3,635
Stop-Loss: ₹3,700
Target: ₹3,600 → ₹3,550

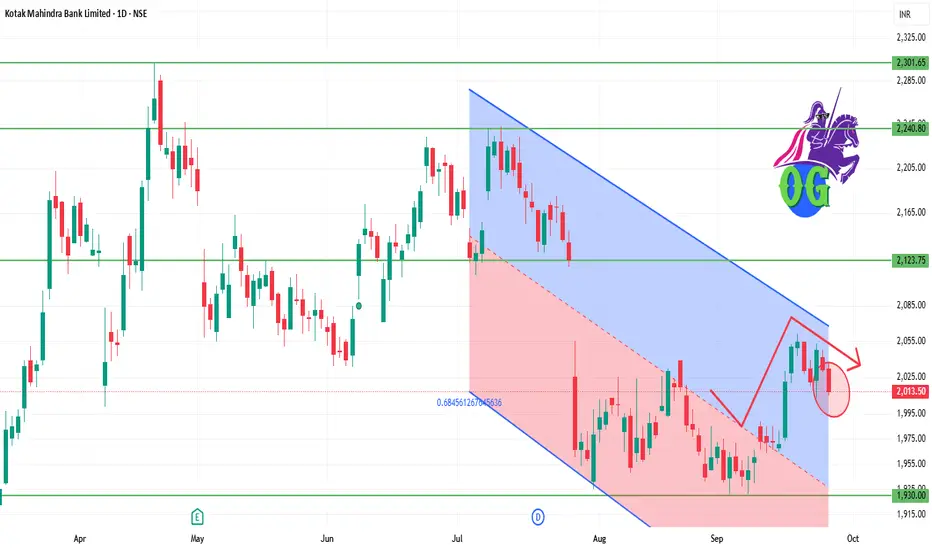
KOTAKBANK 1D Time frame📊 Daily Snapshot
Closing Price: ₹2,013.60
Day’s Range: ₹2,012.50 – ₹2,031.30
Previous Close: ₹2,031.30
Change: Down –0.72%
52-Week Range: ₹1,679.00 – ₹2,302.00
Market Cap: ₹4.04 lakh crore
P/E Ratio: 21.09
Dividend Yield: 0.12%
EPS (TTM): ₹96.30
Beta: 0.80 (indicating lower volatility)
🔑 Key Technical Levels
Immediate Support: ₹2,000.00
Immediate Resistance: ₹2,030.00
All-Time High: ₹2,302.00
📈 Technical Indicators
RSI (14-day): 45.2 – indicating a neutral condition.
MACD: Negative, suggesting bearish momentum.
Moving Averages: Trading below the 50-day and 200-day moving averages, indicating a bearish trend.
📉 Market Sentiment
Recent Performance: Kotak Mahindra Bank's stock declined by 0.72% on September 25, 2025, underperforming the broader market.
Volume: Trading volume was significantly lower than its 50-day average, indicating decreased investor activity.
📈 Strategy (1D Timeframe)
1. Bullish Scenario
Entry: Above ₹2,030.00
Stop-Loss: ₹2,000.00
Target: ₹2,050.00 → ₹2,070.00
2. Bearish Scenario
Entry: Below ₹2,000.00
Stop-Loss: ₹2,030.00
Target: ₹1,980.00 → ₹1,960.00
INFY 1D Time frame📊 Daily Snapshot
Closing Price: ₹1,484.65
Day’s Range: ₹1,476.50 – ₹1,502.70
Previous Close: ₹1,494.60
Change: Down –0.64%
52-Week Range: ₹1,307.00 – ₹2,006.45
Market Cap: ₹6.17 lakh crore
P/E Ratio (TTM): 22.62
Dividend Yield: 2.90%
EPS (TTM): ₹65.63
Beta: 1.09 (indicating moderate volatility)
🔑 Key Technical Levels
Support Zone: ₹1,469 – ₹1,473
Resistance Zone: ₹1,485 – ₹1,490
Pivot Point: ₹1,480.97 (Fibonacci)
All-Time High: ₹2,006.45
📈 Technical Indicators
RSI (14-day): 44.45 – approaching oversold territory, suggesting potential for a rebound.
MACD: Negative at –6.34, indicating bearish momentum.
Moving Averages: Trading below the 50-day (₹1,511.06) and 200-day (₹1,495.15) moving averages, indicating a bearish trend.
Stochastic RSI: Between 45 and 55, indicating a neutral condition.
CCI (20): Between –50 and 50, implying a neutral condition.
📉 Market Sentiment
Recent Performance: Infosys experienced a decline of 0.64% on September 25, 2025, underperforming the broader market.
Volume: Trading volume was significantly higher than its 20-day average, indicating increased investor activity.
📈 Strategy (1D Timeframe)
1. Bullish Scenario
Entry: Above ₹1,485
Stop-Loss: ₹1,469
Target: ₹1,490 → ₹1,500
2. Bearish Scenario
Entry: Below ₹1,469
Stop-Loss: ₹1,485
Target: ₹1,460 → ₹1,450
KOTAKBANK 1D Time frame📊 Current Snapshot
Current Price ≈ ₹2,031
Change: ~ -1.15% on latest trading day
Price is above both 50-day and 200-day simple moving averages, which indicates the medium & longer-term trend is still upwards.
Volume is moderate.
🔍 Indicators / Momentum
RSI (14-day): Mid-range, somewhat bullish (but not overbought).
MFI (Money Flow Index): Also mid-range.
Trend Strength Indicators: Mixed. Some moving averages suggest support (price above), while other oscillators show some weakness or potential for sideways drift.
🔒 Support & Resistance Levels
Type Level (Approx)
Key Support ~ ₹2,010 – ₹2,020
Stronger Support if breaks down ~ ₹1,990 – ₹2,000
Immediate Resistance ~ ₹2,050 – ₹2,060
Higher Resistance ~ ₹2,075 – ₹2,080
⚠️ What to Watch For / Risks
The recent dip suggests sellers are exerting pressure near resistance zones.
If momentum weakens, price could fall toward the support band around ₹2,010‐₹2,020.
Any break below ₹2,000 may trigger more bearish sentiment.
🎯 Possible Scenarios
Bullish Case: If price can hold above current support and break above resistance (~ ₹2,050+), it could aim for ₹2,075-₹2,100.
Bearish Case: Rejection at resistance could pull it back toward ₹2,010 or lower. Further weakness might push it toward ~₹1,950-₹2,000 if broader market is weak.

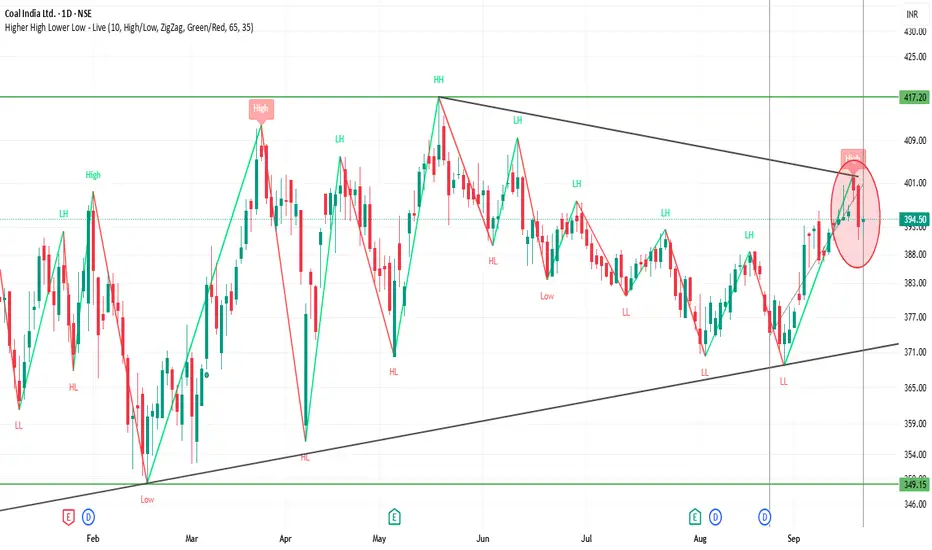
COALINDIA 1D Time frame📊 Current Overview
Current Price: Around ₹394–395
Day Range: ₹391 – ₹395
52-Week Range: ₹349 (Low) – ₹517 (High)
Recent Trend: Stock is consolidating after falling from highs.
🔍 Technical Levels
Support Zone: ₹380 – ₹385
Resistance Zone: ₹400 – ₹405
Range: Currently moving sideways between 385 – 400.
Candlestick Signs: Recent sessions have shown patterns like Harami Bullish and Doji, indicating indecision and possible reversal attempts.
📈 Momentum
Short-term: Neutral to slightly bullish if it holds above 385.
Upside Potential: Break above 405 can push towards 415–420.
Downside Risk: Break below 380 may lead towards 370–365.
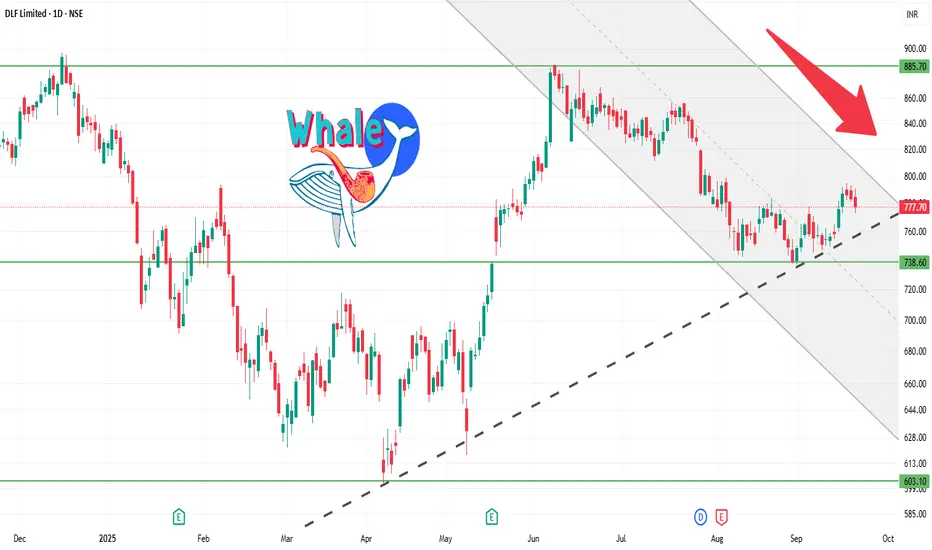
DLF 1D Time frameCurrent Price: Around 780 – 790.
Current Trend: Stock is in a strong uptrend, consolidating after recent highs.
Support Zone: Strong support at 770 – 775. Buyers are likely to defend this level.
Resistance Zone: Key resistance at 800 – 810. A breakout above this can lead to fresh upside.
Indicators: Daily candles show higher lows forming, indicating strength; volumes are healthy.
Outlook:
Above 810 → bullish momentum may continue toward 830+.
Below 770 → weakness may drag it toward 750.
👉 In short:
Tone: Bullish with consolidation.
Range: 770 – 810.
Shall I also prepare a re
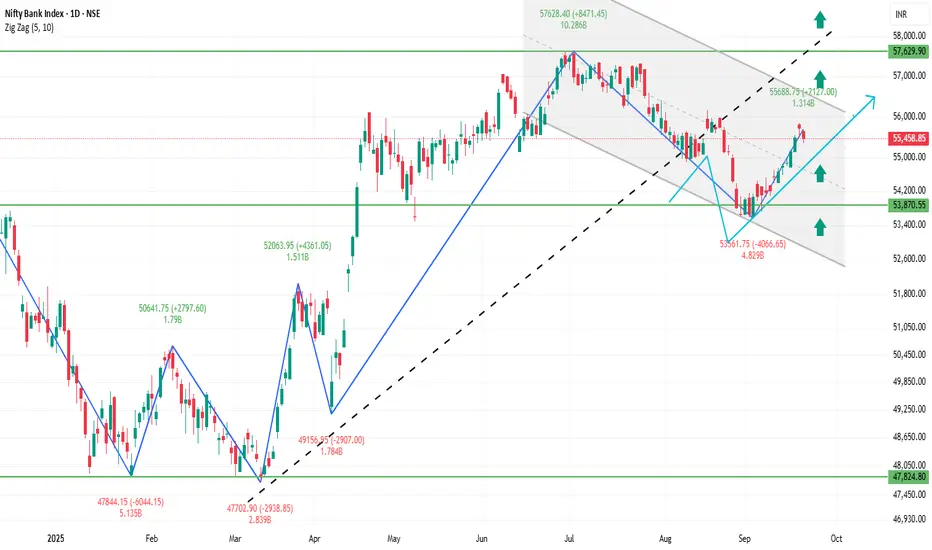
BANKNIFTY 1D Time frameCurrent Trend: BANKNIFTY is showing consolidation with mild bullish bias.
Support Zone: Strong support lies near 55,200 – 55,400. If this holds, buyers may remain active.
Resistance Zone: Key resistance is around 55,800 – 56,000. A breakout above this can bring strong momentum.
Indicators: Daily structure is stable; candles show demand near support zones.
Outlook:
Above 56,000 → fresh rally possible.
Below 55,200 → weakness can extend.
👉 In short:
Sideways to bullish.
Strength above 56,000, weakness below 55,200.
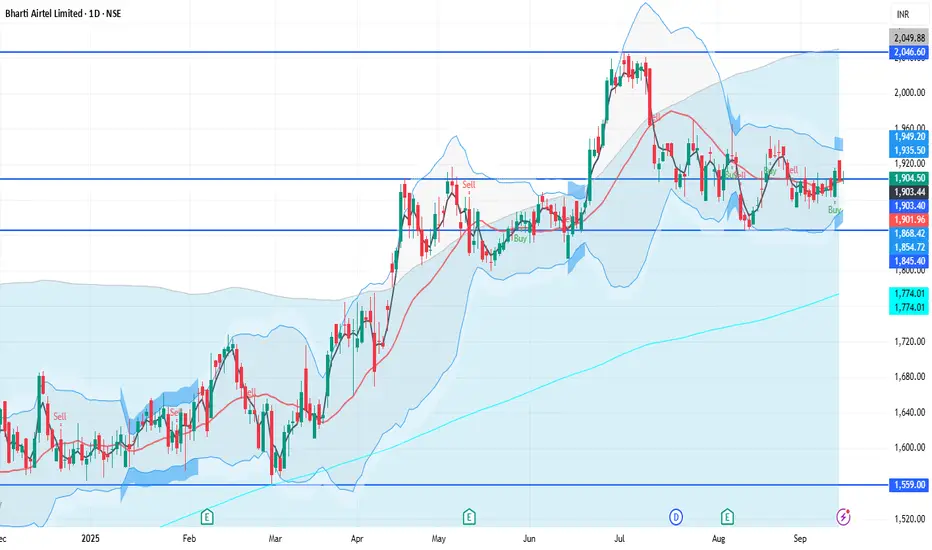
BHARTIARTL 1D Time frameUpdated Snapshot
Current Price: ₹1,903 – ₹1,906
Day’s Range: ₹1,901.60 – ₹1,925
Previous Close: ₹1,902.60
🔹 Support & Resistance
Support 1: ₹1,900 – ₹1,895
Support 2: ₹1,880 – ₹1,870
Resistance 1: ₹1,920 – ₹1,925
Resistance 2: ₹1,950 – ₹1,960
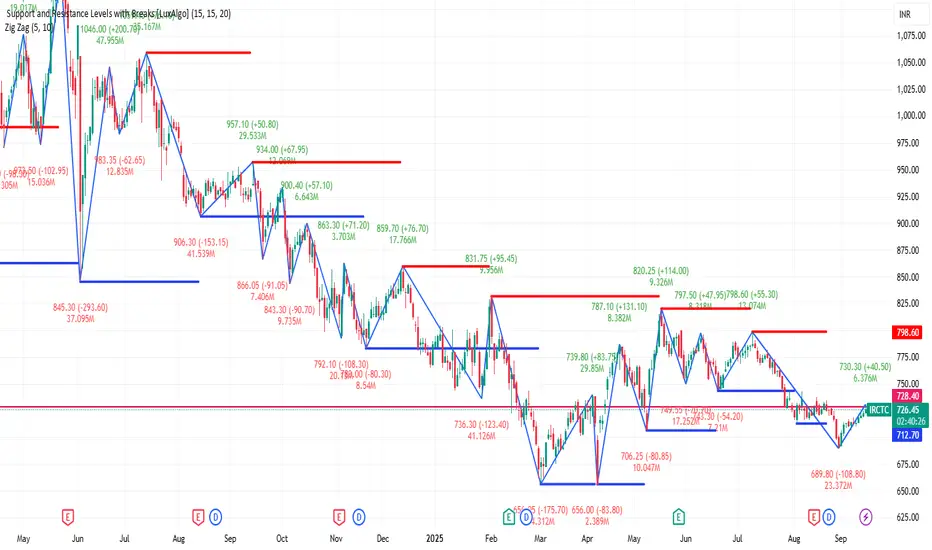
IRCTC 1D Time frameCurrent Price
₹728.65
🔹 Market Snapshot
Day’s Range: ₹722.55 – ₹730.30
Previous Close: ₹722.95
52-Week Range: ₹656.00 – ₹957.10
Market Cap: ₹57,776 crore
P/E Ratio (TTM): 44.33
P/B Ratio: 15.91
Dividend Yield: 0.00%
EPS (TTM): ₹16.44
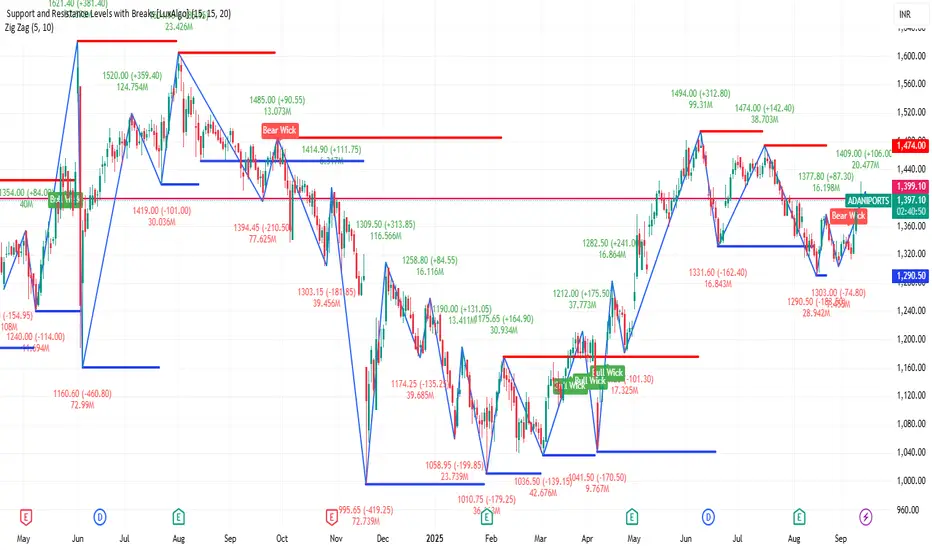
ADANIPORTS 1D Time frameUpdated Snapshot
Current Price: ₹1,399
Day’s Range: ₹1,391 – ₹1,406.50
Previous Close: ₹1,393.10
🔹 Support & Resistance
Support 1: ₹1,391 – ₹1,385
Support 2: ₹1,370 – ₹1,360
Resistance 1: ₹1,406 – ₹1,410
Resistance 2: ₹1,420 – ₹1,430
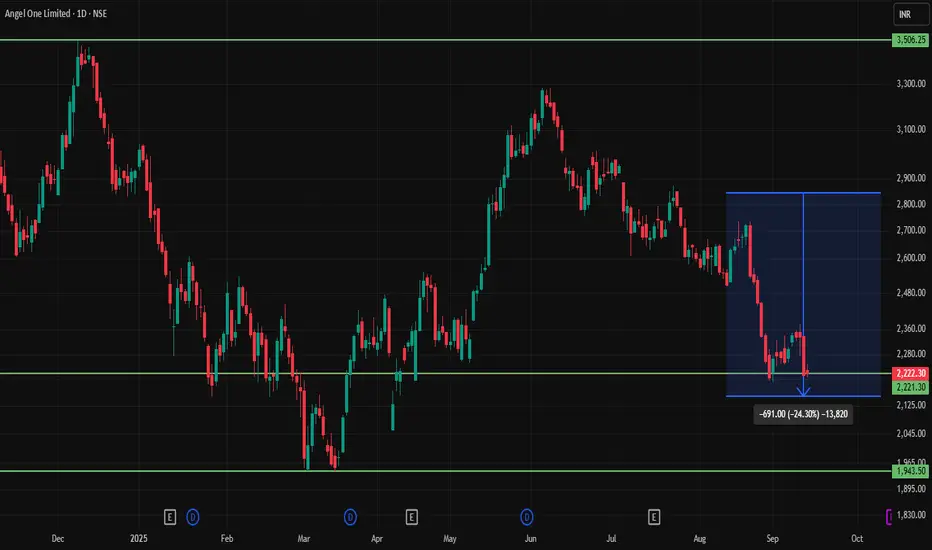
ANGELONE 1D Time frameCurrent Price & Trend
Current Level: ₹2,222
Trend: Neutral to weak → stock is under pressure, trading below many key moving averages.
Momentum: Lacks strong buying interest; near lower-mid range of recent price action.
Indicators
RSI: Around 40–45 → closer to oversold but still in neutral zone.
MACD: Bearish crossover → signals continued weakness.
Moving Averages: Price is below 20- & 50-day averages → selling pressure still present.
✅ Bullish Scenario
If price sustains above 2,250, it can move toward 2,350 – 2,400.
Breakout above 2,400 would indicate a stronger reversal.
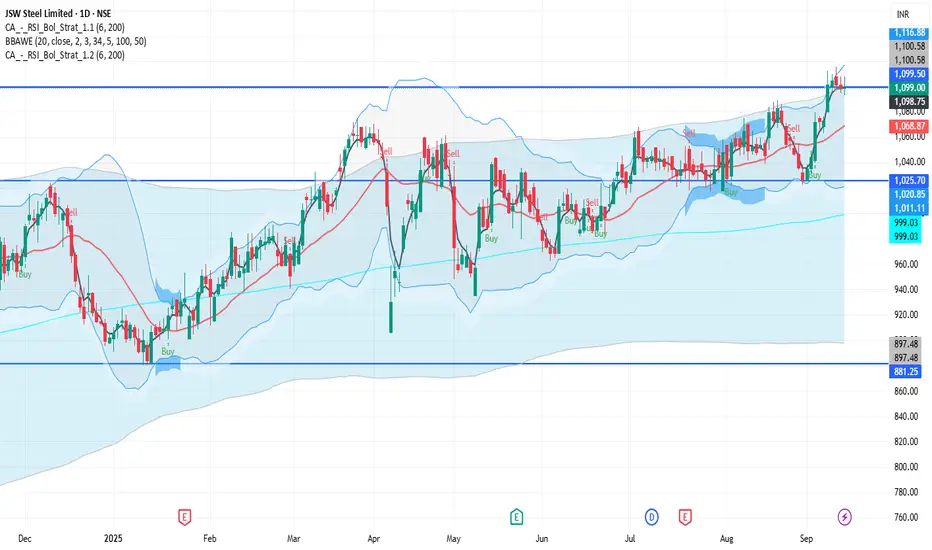
JSWSTEEL 1D Time frameCurrent Price & Trend
Price: ₹1,099.00
Trend: Neutral to mildly bullish; trading near the upper end of its 52-week range (₹880.00 – ₹1,115.50).
Momentum: Indicators suggest a neutral to slightly bullish outlook.
Bullish Scenario
Breakout Above ₹1,115: A sustained move above ₹1,115 could target ₹1,130 – ₹1,135 in the short term.
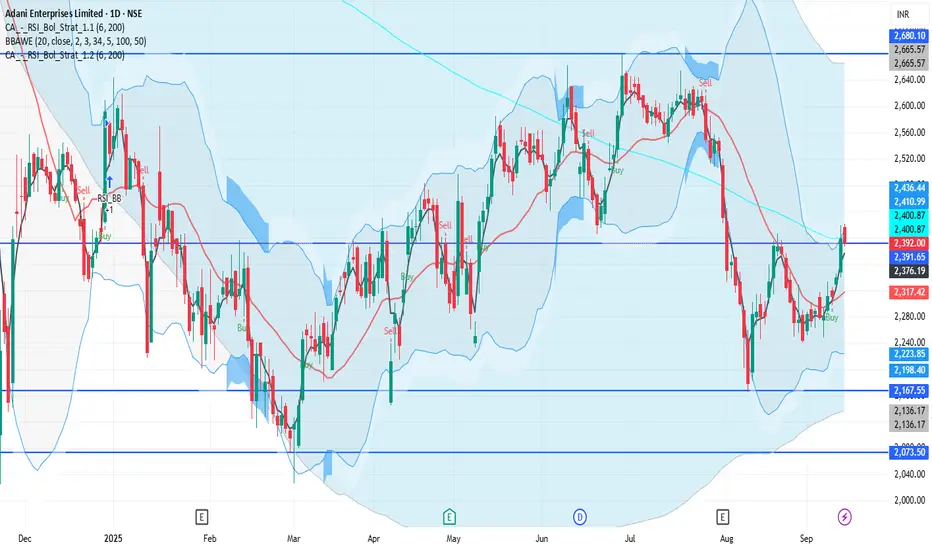
ADANIENT 1D Time frameCurrent Price & Trend
Price: ₹2,392.00
Trend: Neutral; trading approximately 25.5% below its 52-week high of ₹3,211.00, achieved on July 1, 2025.
Momentum: Indicators suggest a neutral to slightly bearish outlook.
Bullish Scenario
Breakout Above ₹2,420: A sustained move above ₹2,420 could target ₹2,440 – ₹2,450 in the short term.
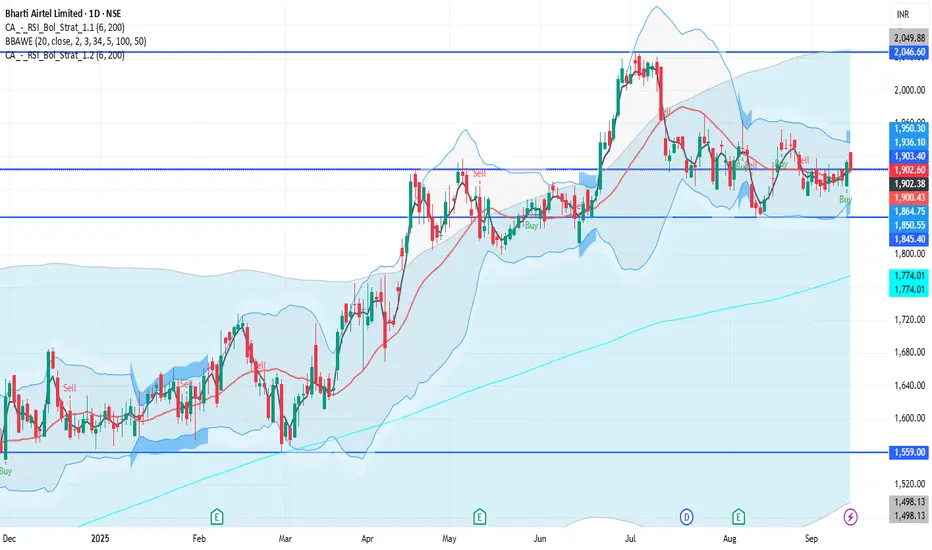
BHARTIARTL 1D Time frameCurrent Price & Trend
Price: ₹1,902.60
Trend: Neutral to mildly bullish; trading approximately 6.9% below its 52-week high of ₹2,045.50, achieved on July 2, 2025.
Momentum: Indicators suggest a neutral to slightly bullish outlook.
Bullish Scenario
Breakout Above ₹1,930: A sustained move above ₹1,930 could target ₹1,950 – ₹1,960 in the short term.
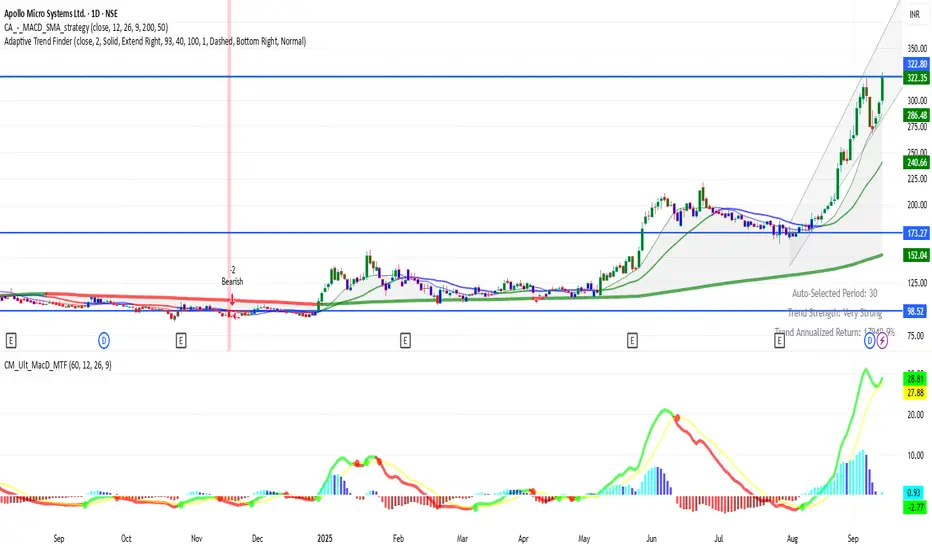
APOLLO 1D Time frame Current Status
Price: ₹322
Trend: Strong uptrend, stock recently made fresh highs.
Momentum: Very strong, but slightly overbought in daily indicators.
Key Levels
Immediate Resistance: ₹326 – ₹330 (recent high zone)
Next Resistance: ₹340 – ₹345 (if breakout continues)
Immediate Support: ₹300 – ₹305
Stronger Support: ₹280 – ₹285
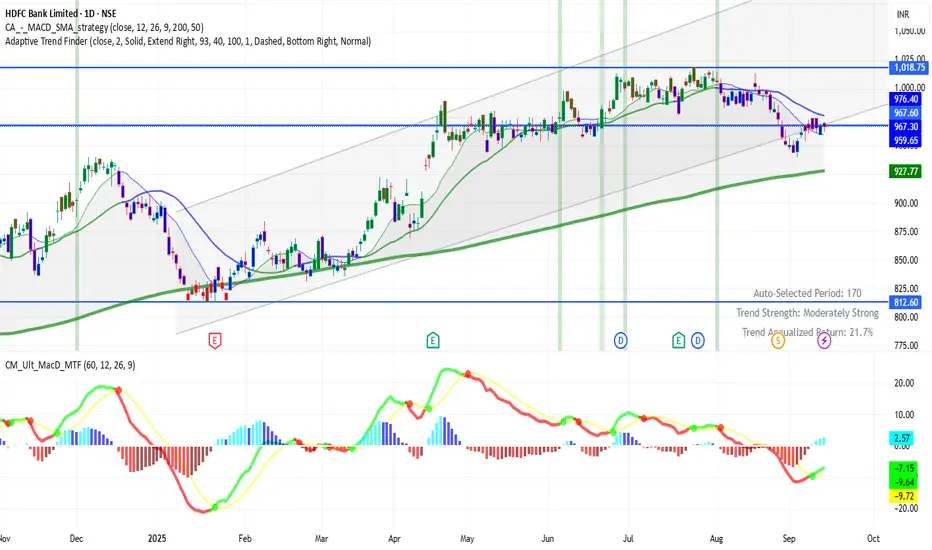
HDFCBANK 1D Time frame📊 Current Status
Price around ₹967
Trading near resistance zone
🔑 Key Levels
Support: ₹960 → ₹950
Resistance: ₹970 → ₹975
✅ Outlook
If price sustains above ₹975, further upside possible. Falling below ₹950 may bring weakness or sideways movement.
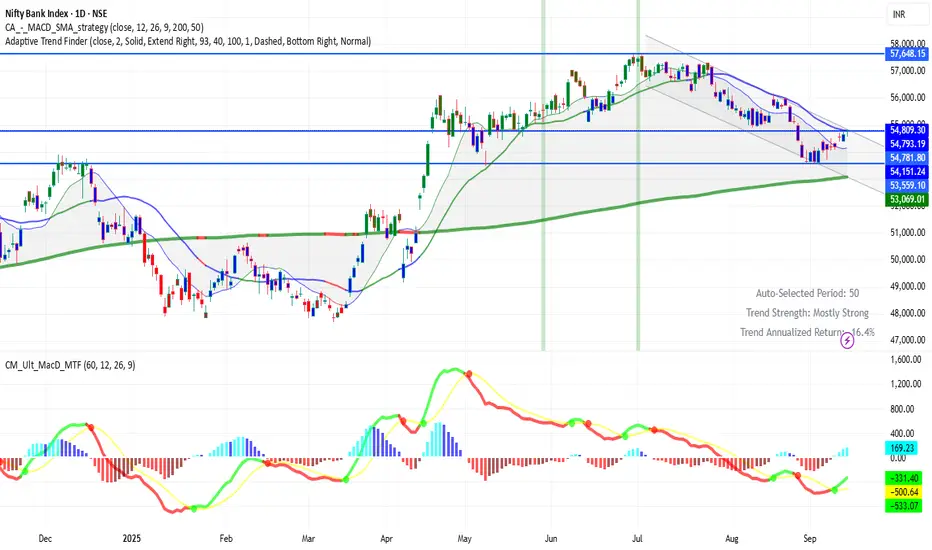
BANKNIFTY (1D timeframe)📍 Current Level
Trading around 54,809 points
🔑 Key Levels
Immediate Resistance: 55,000 → 55,200
Immediate Support: 54,400 → 54,500
Deeper Support: 53,800 → 53,500
✅ Outlook
If BankNifty breaks and holds above 55,000–55,200, more upside is possible.
If it falls below 54,400–54,500, weakness can take it down toward 53,800–53,500.
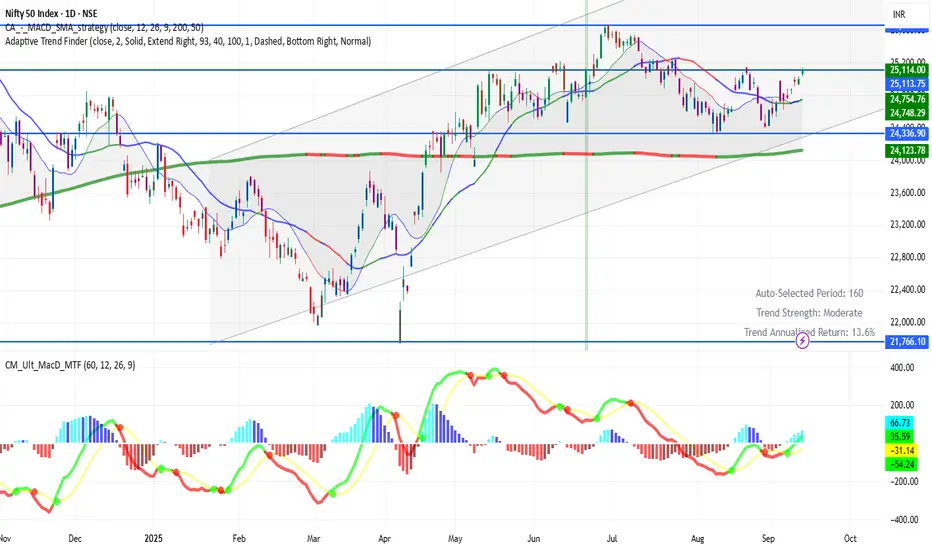
NIFTY (1D timeframe)📍 Current Level
Trading around 25,114
🔑 Key Levels
Immediate Resistance: 25,150 → 25,200
Immediate Support: 25,000 → 24,950
Deeper Support: 24,800 → 24,600
✅ Outlook
If Nifty sustains above 25,150–25,200, more upside can open up.
If it slips below 24,950–25,000, weakness may extend toward 24,800–24,600.