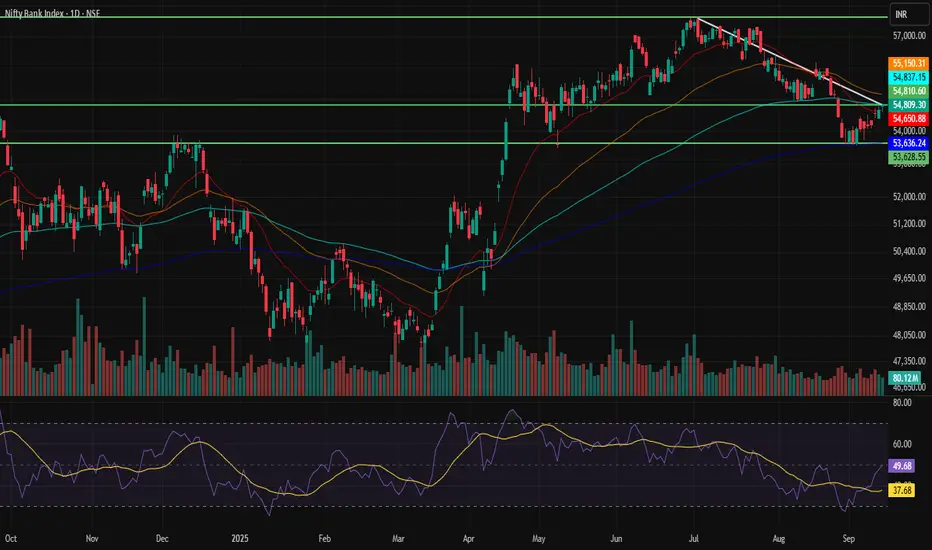
BANKNIFTY 1D Time frame🔢 Current Level
Trading near ₹54,809
🔑 Key Resistance & Support Levels
Resistance Zones:
~ ₹55,000 – ₹55,200 (immediate resistance)
~ ₹55,500 – ₹55,700 (stronger resistance above)
Support Zones:
~ ₹54,500 – ₹54,600 (first support)
~ ₹54,200 – ₹54,300 (secondary support)
~ ₹53,800 – ₹54,000 (deeper support if selling extends)
📉 Outlook
Bullish Scenario: A close above ₹55,000 may trigger momentum toward ₹55,500+.
Bearish Scenario: A slip below ₹54,500 could drag price toward ₹54,200 or even ₹53,800.
Neutral / Range: Between ₹54,500 – ₹55,200, sideways movement likely until a breakout.
Wipro
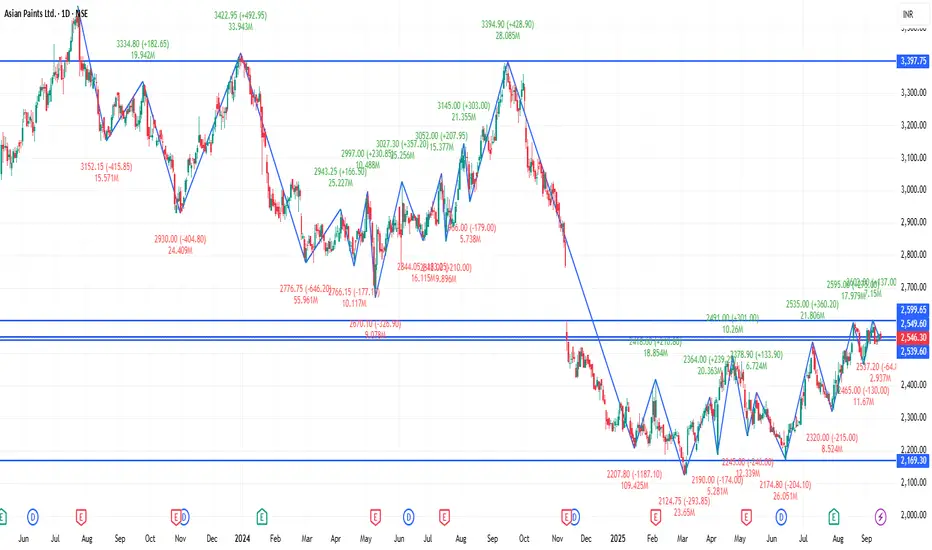
ASIANPAINT 1D Time frame🔢 Current Level
Trading around ₹2,546 – ₹2,560
🔑 Key Resistance & Support Levels
Resistance Zones:
₹2,559 – ₹2,560 (recent highs; breakout above this may lead to further upside)
₹2,580 – ₹2,600 (stronger resistance above)
Support Zones:
₹2,540 – ₹2,545 (immediate support; failure to hold above this may lead to a decline)
₹2,520 – ₹2,530 (short-term support; a break below this could indicate weakness)
₹2,500 – ₹2,510 (deeper support zone if price dips further)
📉 Outlook
Bullish Scenario: If Asian Paints holds above ₹2,545, upward momentum may continue. Break above ₹2,560 can open the way toward ₹2,580+.
Bearish Scenario: If it falls below ₹2,520, risk increases toward ₹2,500 – ₹2,510.
Neutral / Range: Between ₹2,545 – ₹2,560, Asian Paints may consolidate before a directional move.
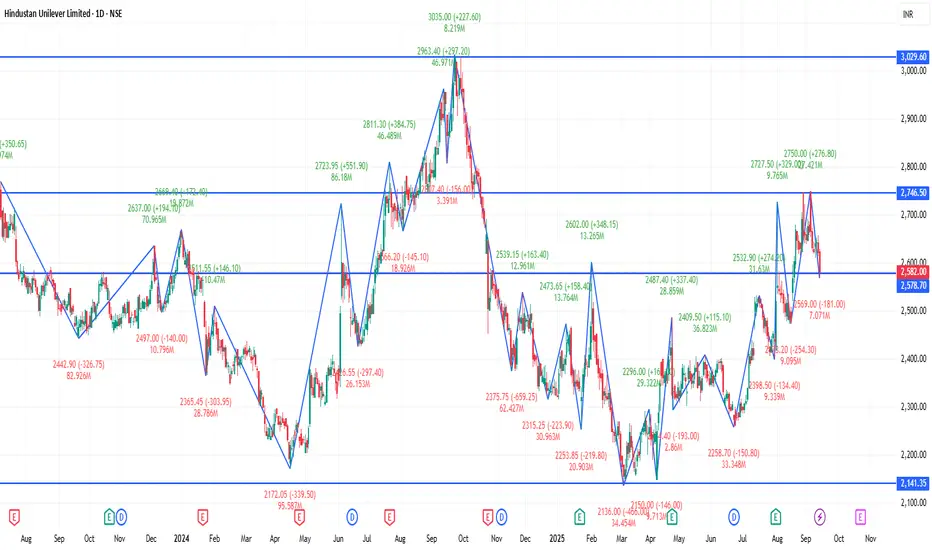
HINDUNILVR 1D Time frame:
🔢 Current Level
Trading around ₹2,578.90 - ₹2,582.00
🔑 Key Resistance & Support Levels
Resistance Zones:
₹2,634.90 – ₹2,636.40 (recent highs; breakout above this may lead to further upside)
₹2,650.00 – ₹2,660.00 (stronger resistance above)
Support Zones:
₹2,569.00 – ₹2,570.00 (immediate support; failure to hold above this may lead to a decline)
₹2,550.00 – ₹2,560.00 (short-term support; a break below this could indicate weakness)
₹2,520.00 – ₹2,530.00 (deeper support zone if price dips further)
📉 Outlook
Bullish Scenario: If HINDUNILVR holds above ₹2,570.00, upward momentum may continue. Break above ₹2,636.40 can open the way toward ₹2,650.00+.
Bearish Scenario: If it falls below ₹2,520.00, risk increases toward ₹2,510.00 – ₹2,530.00.
Neutral / Range: Between ₹2,570.00 – ₹2,636.40, the stock may consolidate before a directional move.
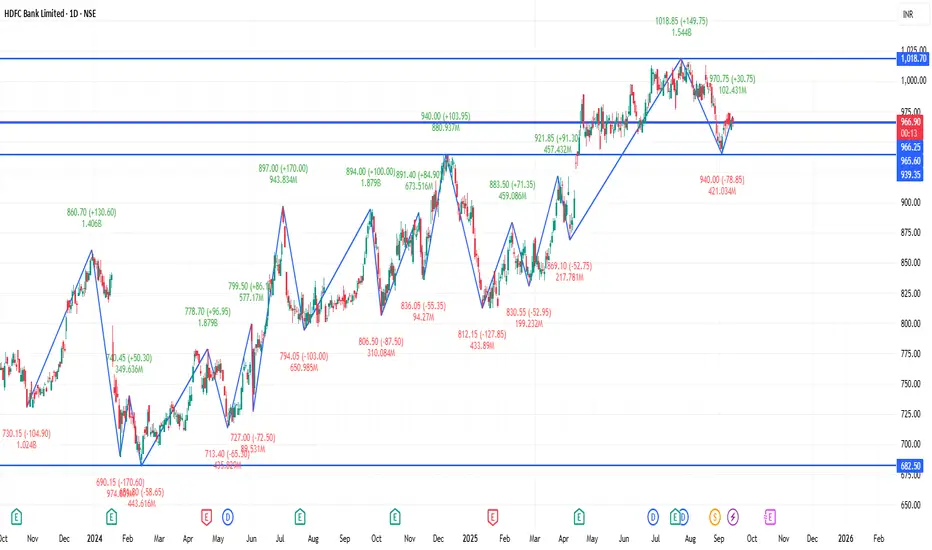
HDFCBANK 1D Time frame🔢 Current Level
Trading around ₹966 – ₹968
🔑 Key Support & Resistance Levels
Resistance Zones:
~ ₹973 – ₹975 (near-term resistance)
~ ₹980 – ₹985 (stronger resistance if price crosses above the earlier zone)
Support Zones:
~ ₹962 – ₹960 (immediate support)
~ ₹955 – ₹953 (lower support if downward pressure continues)
📉 Outlook
Bullish Scenario: Holding above ₹960-₹962 may push price toward ₹973-₹975, and a breakout above that can lead to ₹980-₹985.
Bearish Scenario: Falling below ₹955 may increase downside risk toward deeper supports.
Neutral / Range Zone: Between ₹960-₹975, likely sideways consolidation until a breakout happens.
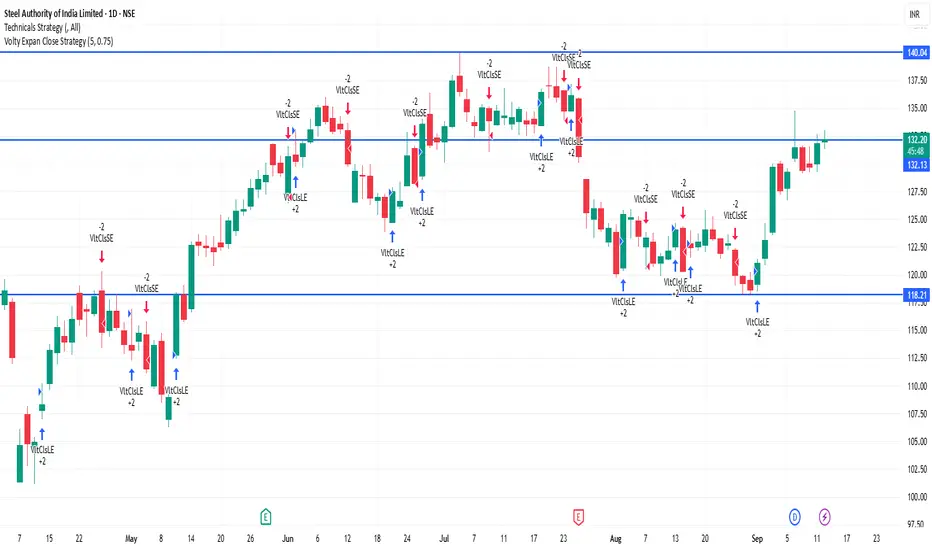
SAIL 1D Time frame🔢 Current Level
Trading around ₹132.28
🔑 Key Resistance & Support Levels
Resistance Zones:
₹133.00 – ₹134.00 (near-term resistance; breakout above this may lead to further upside)
₹135.00 – ₹136.00 (stronger resistance above)
Support Zones:
₹131.50 – ₹132.00 (immediate support; failure to hold above this may lead to a decline)
₹130.00 – ₹130.50 (short-term support; a break below this could indicate weakness)
₹128.00 – ₹129.00 (deeper support zone if price dips further)
📉 Outlook
Bullish Scenario: If SAIL holds above ₹132.00, upward momentum may continue. Break above ₹134.00 can open the way toward ₹135.00+.
Bearish Scenario: If it falls below ₹130.00, risk increases toward ₹128.00 – ₹129.00.
Neutral / Range: Between ₹132.00 – ₹134.00, SAIL may consolidate before a directional move.
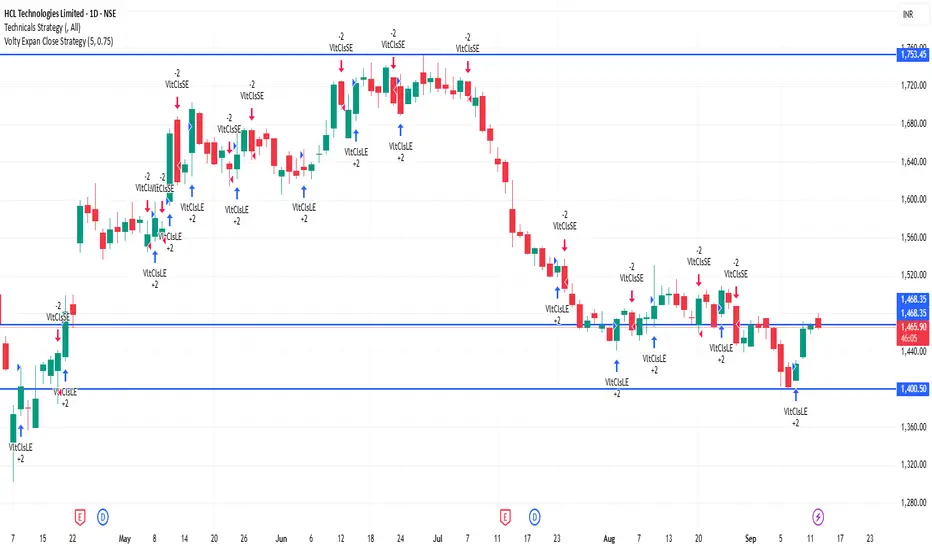
HCLTECH 1D Time frame🔢 Current Level
Trading around ₹1,465.80 - ₹1,467.80
🔑 Key Resistance & Support Levels
Resistance Zones:
₹1,472 – ₹1,475 (recent highs; breakout above this may lead to further upside)
₹1,485 – ₹1,490 (stronger resistance above)
Support Zones:
₹1,460 – ₹1,463 (immediate support; failure to hold above this may lead to a decline)
₹1,450 – ₹1,453 (short-term support; a break below this could indicate weakness)
₹1,440 – ₹1,445 (deeper support zone if price dips further)
📉 Outlook
Bullish Scenario: If HCL Technologies holds above ₹1,463, upward momentum may continue. Break above ₹1,475 can open the way toward ₹1,485+.
Bearish Scenario: If it falls below ₹1,440, risk increases toward ₹1,430 – ₹1,445.
Neutral / Range: Between ₹1,463 – ₹1,475, HCL Technologies may consolidate before a directional move.
BTCUSD 1D Time frame📈 Price Action
Previous Close: $113,897.00
Day’s Range: $112,204.00 – $114,451.00
Current Price: $113,897.00
🔧 Technical Indicators
Relative Strength Index (14): 55.39 — Indicates neutral momentum.
MACD: Positive — Suggests upward trend.
Moving Averages:
5-day MA: $112,545.50
20-day MA: $112,519.63
50-day MA: $114,828.28
100-day MA: $109,519.30
200-day MA: $101,144.13
Stochastic Oscillator (14): 67.91% — Indicates bullish momentum.
Average True Range (ATR): $3,177.03 — Suggests moderate volatility.
Directional Movement Index (ADX): 10.23 — Indicates a weak trend.
📊 Support & Resistance Levels
Immediate Support: $112,000
Immediate Resistance: $115,000
🧠 Trend Analysis
Trend: Neutral to bullish
Momentum: Positive
Volatility: Moderate
Summary: Bitcoin is currently trading near $113,897, showing a neutral to bullish trend with positive momentum. The 50-day moving average is above the current price, indicating potential upward movement. Traders should monitor the support level at $112,000 and resistance at $115,000 for potential breakout opportunities.

NIFTY_MID_SELECT 1D Time frameCurrent Level: 13,022.90
Daily Range: 12,967.10 – 13,087.35
52-Week Range: 10,382.55 – 13,537.80
Technical Indicators:
RSI (14): 56.75 – positive momentum
MACD: 9.37 – upward trend
Stochastic Oscillator: 75.03 – strong bullish momentum
Rate of Change (ROC): 2.59 – confirming positive movement
Trend & Levels:
Trading above Supertrend: 13,065.50 – bullish trend
Support: ~13,000 (next support ~12,900)
Resistance: ~13,100 (next target 13,200–13,300)
Summary:
The Nifty Midcap Select Index is showing a bullish trend with strong momentum and potential for further gains if current momentum continues.

SENSEX 1D Time frame📊 Current Snapshot
Current Price: ₹81,571
Day’s Range: ₹81,500 – ₹81,600
Previous Close: ₹81,425.15
Opening Price: ₹81,504.36
Volume: Moderate
📈 Trend & Indicators
Trend: Neutral to mildly bullish; trading near short-term resistance.
RSI (14): Neutral zone.
MACD: Positive → indicating mild bullish momentum.
Moving Averages: Short-term averages indicate neutral to slightly bullish outlook.
🔮 Outlook
Bullish Scenario: Break above ₹81,700 with strong volume could target ₹81,900.
Bearish Scenario: Drop below ₹81,400 may lead to further decline toward ₹81,200.
Neutral Scenario: Consolidation between ₹81,400 – ₹81,700; breakout needed for directional move.
📌 Key Factors to Watch
Economic Indicators: Interest rates, inflation, and RBI policy updates.
Sector Performance: Trends in the IT and financial sectors.
Global Cues: Global market trends, US indices, crude oil, and currency movements.

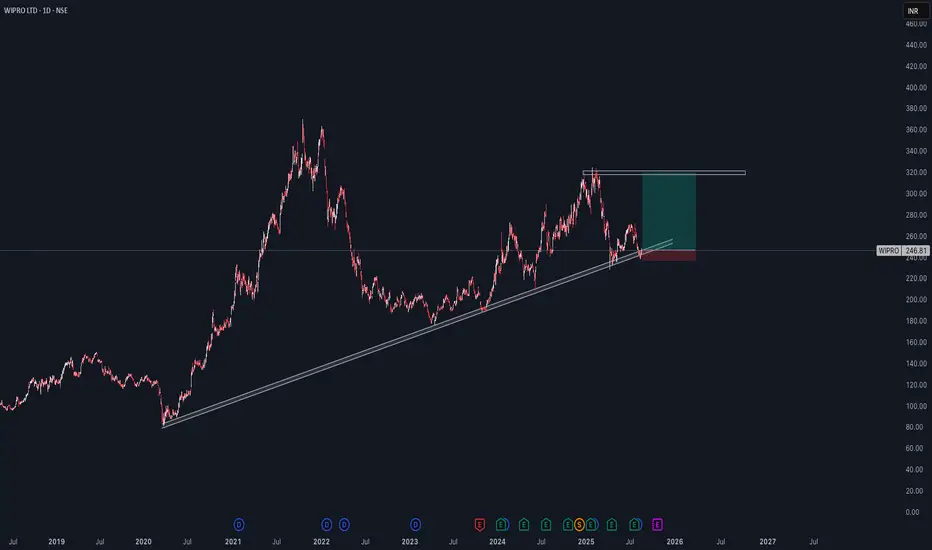
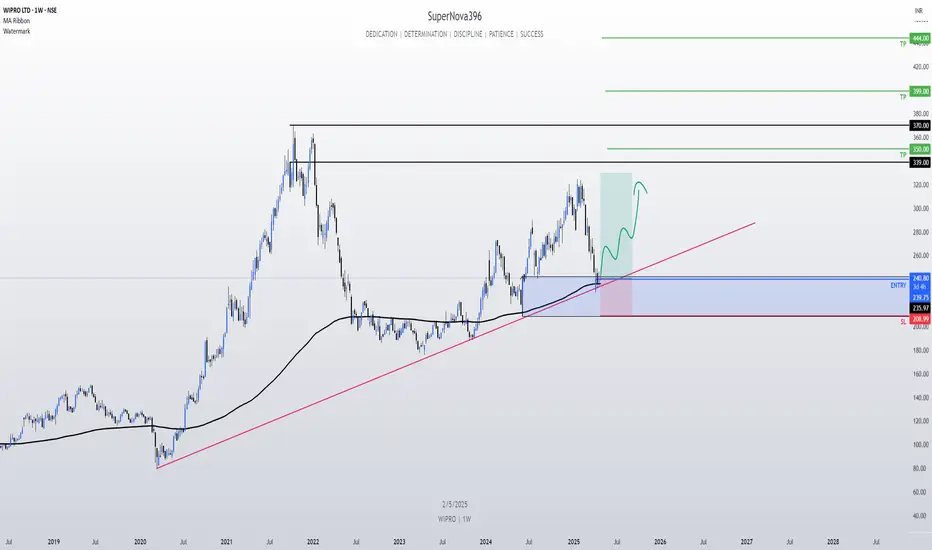
Wipro – Long Setup from Trendline Support Wipro has been respecting a long-term trendline since 2020.
Price recently bounced from this trendline support near ₹240, showing strong buying interest.
The current structure suggests a possible trend continuation towards the higher resistance zone.
Trade Setup
Entry Zone: Around ₹245–250 (near trendline support)
Stop Loss: Below ₹230 (trendline breakdown level)
Target: ₹320 (previous supply zone / resistance level)
This gives a risk-to-reward ratio of approx. 1:3, which is favorable.
🔍 Technical Factors Supporting Bullish View
Price is consolidating above the long-term support trendline.
Multiple rejections from the downside show strong demand zone near ₹240.
If the momentum continues, buyers may push price towards the ₹320 resistance area.
⚠️ Risk Management
A daily close below ₹230 will invalidate this setup.
This is a positional swing trade, so patience is required.
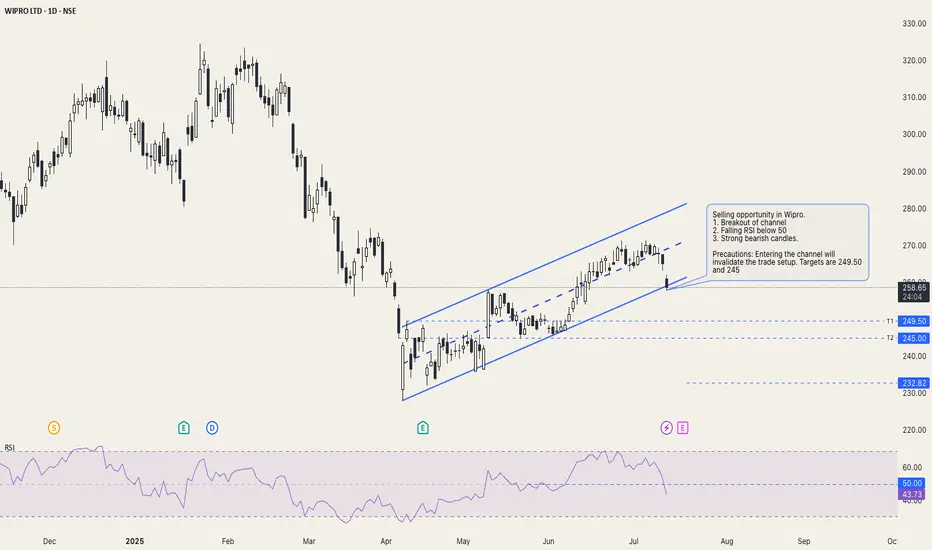
Channel breakout in Wipro: BearishSelling opportunity in Wipro.
1. Breakout of channel
2. Falling RSI below 50
3. Strong bearish candles.
Precautions: Entering the channel will invalidate the trade setup. Targets are 249.50 and 245
(ignore the 232 line)
Wipro: Short-Term Trend Shift Likely – Watch for UpsideDescription:
Wipro is forming a potential short-term reversal near a key support zone and price action shows early signs of bullish momentum. A bounce toward the 285 level looks likely if support holds.
Disclaimer:
Not financial advice. Do your own research before trading.
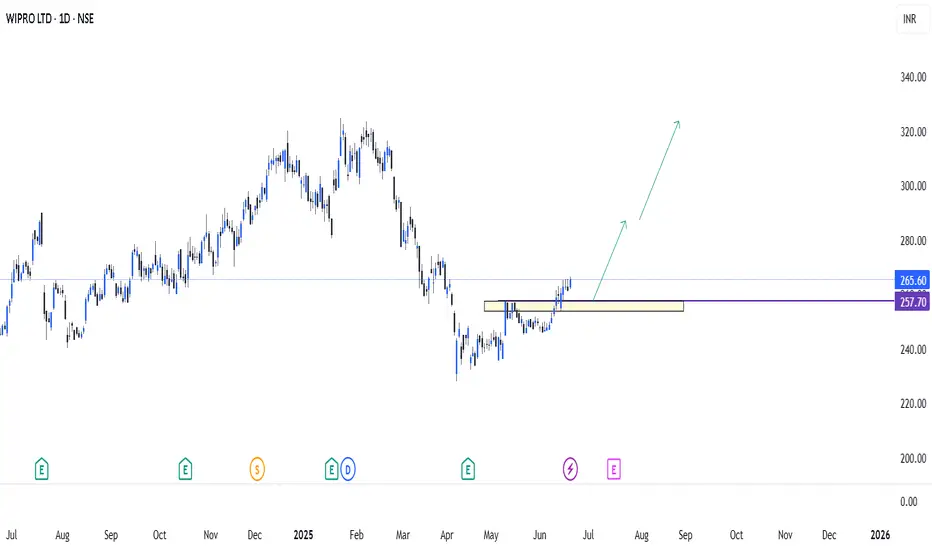
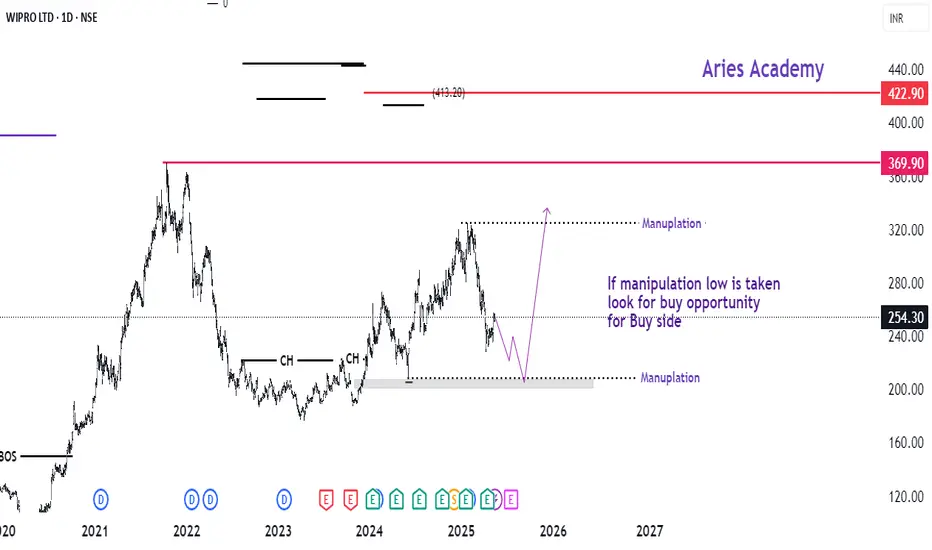
Wipro Buy sideAs per the previous experience, the market will always create some manipulation levels which either one taken if will move fast towards the other side
WIPRO: Reversal Trade with 40% upside potential⚡️Price Analysis:
1️⃣ Price has tapped in the demand area
2️⃣ Price structure is bullish.
3️⃣ Price trading above EMAs.
4️⃣ Price is near the trendline support.
✨ Key Observations:
➡️ RRR favourable at CMP.
➡️ Volume strength is pending still.
➡️ Momentum is lacking so, it might take some time to go up.
⚠️ Disclaimer: This is NOT a buy/sell recommendation. This post is meant for learning purposes only. Views are personal. Please, do your due diligence before investing.⚠️
💬 Share your thoughts in the comments below! ✌️
🔥Follow me for more such awesome trade ideas.✅🚀
Wipro cmp 317.00 by Weekly Chart viewWipro cmp 317.00 by Weekly Chart view
* Resistance Zone 307 to 317 Price Band
* Volumes closing in on avg traded quantity over past few weeks
* Weekly basis Support at 289 > 261 > 233 with Resistance at 340 > ATH 369.90
* Bullish Cup & Handle and/or Double Rounding Bottoms or a very faintly applicable Head & Shoulders pattern done by the neckline at Resistance Zone, as one may interpret

Wipro halting after a gap up opening.Wipro is showing some good chart pattern. The stock has given a gap up opening and took resistance form 303-305 levels.
Watch for a restest of the break out for entry or enter once the resistance levels is breached.
Resistance levels ;- 304, 309.5
Support ;- 294.6, 287.5
Wait for a price action and trade accordingly.

Aggressive Short call on WiproNSE:WIPRO Aggressive Short call on Wipro hovering near support zone if broken can give good swing, with MACD Showing Weakness, This is Purely Aggressive Trade and its Results are around the corner.
Trade Setup:
It can be a Good 1:1 RISK-REWARD Trade for Aggressive Swing Trader.
Target(Take Profit):
Around 262 to 265 Levels for Swing Trade.
Stop-Loss:
Around 309-313 or When Breaches 20 DSMA For Swing Trade.
📌Thank you for exploring my idea! I hope you found it valuable.
🙏FLLOW for more
👍BOOST if useful
✍️COMMENT Below your views.
Meanwhile, check out my other stock ideas below until this trade is activated. I would love your feedback.
Disclaimer: This analysis is intended solely for informational and educational purposes and should not be interpreted as financial advice. It is advisable to consult a qualified financial advisor or conduct thorough research before making investment decisions.

Wipro Support & Resistance Level for the day Wipro Limited is one of India's largest IT services companies and is actively traded on the National Stock Exchange (NSE) and the Bombay Stock Exchange (BSE). When analyzing Wipro’s support and resistance levels, we can apply technical analysis tools such as swing highs, swing lows, moving averages, Fibonacci retracement, and volume analysis.
Support Levels:
₹375 - ₹380 (Recent Low / Support Zone):
If Wipro has recently tested this level and bounced up, this would indicate strong support in the ₹375 - ₹380 range. A break below this zone could suggest further downside to the next support.
₹350 (Psychological Support):
The ₹350 level is a round number and could act as a psychological support zone. If the price approaches ₹350 and finds buying interest, this would confirm its strength as a support level.
₹320 - ₹330 (Previous Low / Support Zone):
If Wipro previously reversed direction around ₹320 to ₹330, this would be a key support zone. A break below this level would suggest significant weakness in the stock, potentially leading to a move towards lower levels.
Resistance Levels:
₹420 - ₹430 (Recent Highs / Resistance Zone):
If Wipro has faced resistance around ₹420 to ₹430 multiple times, this is a strong resistance zone. A break above this range could signal bullish continuation with the next resistance at higher levels.
₹450 (Key Resistance):
₹450 is a significant psychological resistance level. If Wipro has previously struggled to break above this level, it could act as strong resistance again. If Wipro breaks above this level with volume, it could signal further upside potential.
₹475 - ₹480 (Next Resistance Zone):
If the stock has touched or approached ₹475 - ₹480 in the past and failed to move higher, this range could be the next resistance zone. A sustained breakout above this level could target ₹500 or higher.
Key Areas to Watch:
Break Above ₹430:
A breakout above ₹430 would likely lead Wipro to test the next resistance levels at ₹450 and ₹475. Watch for volume confirmation to support the breakout.
Break Below ₹375:
A breakdown below ₹375 would suggest a possible shift to bearish momentum, and the stock could then test ₹350 or lower. If Wipro closes below ₹350, further downside could open up.

Wipro – Trading near Cup and Handle breakout zone on weekly timeGiven the recent volatility in the Indian market, the IT sector is among those sectors that looks strong and is holding. Among the stocks to watch is Wipro.
On a weekly timeframe, the stock is currently above the 30 weekly moving average which is a positive sign. It has also formed a Cup & Handle base with the price trading near the pivot area.
One can keep an eye on Wipro with strict risk management given the overall market scenario.
As per the weekly chart here are the key levels:
Ideal buy zone: 560 – 580
Initial target: 670 – 700
Stop loss: 5-8% as per one’s risk management
Note: Not a buy/sell recommendation. Please consult your financial advisor

Affle India for 60%+ gainsDate: 6 Nov’24
Symbol: AFFLE
Timeframe: Weekly
Affle India seems to be in Wave V of 3 which may end around 1850. And after correction in Wave IV, the price is likely to head to 2450 (60%+ from where Wave IV ends) as seen in the chart. Once the prices go past 2000, five waves of Wave 5 will be more visible. Wave 5 could even extend and head towards 2800+; will review this as waves develop.
This is not a trade recommendation. Please do your own analysis. And I have the right to be wrong.
HINGLISH VERSION
Aisa chart dekhke lagta hai ki Affle India 3 ki Wave V mein hai jo 1850 ke aaspaas samaapt ho sakti hai. Aur Wave IV mein giraavat ke baad, keemat 2450 (60%+ jahaan Wave IV samaapt hotee hai) tak pahunchane kee sambhaavana hai. Ek baar jab keematen 2000 ke paar chalee jaengee, to Wave 5 kee paanch waves adhik dikhaee dengee. Wave 5 extend bhi ho sakta hai aur 2800+ kee taraf badh sakta hai; wave vikasit hone par isakee sameeksha karenge.
Yah koee trade lene ki salah nahin hai. Kripya apana vishleshan khud karein. Aur mujhe galat hone ka adhikaar hai.

WIPRO -Cup and Handle breakout - DailyName - WIPRO
Pattern - Cup and Handle breakout
Timeframe - Daily
Volume - Very Good
Cmp - 550
Can test - 604
SL - 542
Here’s a summary of Wipro Ltd’s Q1 FY25 results:
Financial Highlights
Net Profit: Wipro reported a net profit of INR 3,003 crore, a 4.6% increase from the same quarter last year1.
Revenue: The consolidated revenue for the quarter was INR 21,964 crore, which represents a 3.8% decline year-over-year (YoY)1.
Operating Margin: The IT services operating margin improved to 16.4%, up by 40 basis points quarter-over-quarter (QoQ)2.
Operational Highlights
Large Deal Bookings: Large deal bookings for the quarter were at $1.2 billion, an increase of 31.1% QoQ and 9.5% YoY2.
Voluntary Attrition: Voluntary attrition was at 14.2% on a trailing 12-month basis2.
Comparative Performance
Quarter-over-Quarter: Compared to the previous quarter, net income increased by 5.2%2.
Outlook
Wipro expects revenue from its IT Services business segment to be in the range of $2,617 million to $2,670 million for the next quarter2.
Always welcome for any comments with your feedback or give it a like if you find it useful.
==========================================================================
Disclaimer: This analysis is for informational purposes and not financial advice. The author is not a registered financial advisor. Individuals should conduct their research and seek professional advice before making investment decisions

WIPRO // Levels // 4 hour Here are the current support and resistance levels for Wipro (WIPRO) on a 4-hour timeframe:
**Support Levels**
1. **Previous Low**: 444.00
2. **Fibonacci 38.2% Retracement**: 446.00
3. **200 SMA (Simple Moving Average)**: 448.00
4. **Fibonacci 23.6% Retracement**: 450.00
5. **Short-term Support**: 452.00
**Resistance Levels**
1. **Fibonacci 61.8% Retracement**: 454.00
2. **Previous High**: 456.00
3. **Fibonacci 78.6% Retracement**: 458.00
4. **Medium-term Resistance**: 460.00
5. **Long-term Resistance**: 462.00
**Notes**
* These levels are subject to change as market conditions evolve.
* These levels are based on historical data and may not be a guarantee of future price action.
* These levels are not the only levels that can be used; traders can use other indicators, such as moving averages or trend lines, to identify potential support and resistance levels.
**Current Market Conditions**
* Wipro is currently trading in a bullish trend, with a series of higher highs and higher lows.
* The stock is approaching the short-term resistance level of 452.00.
* If the stock breaks above this level, it could potentially move towards the medium-term resistance level of 460.00.
**Trading Strategies**
* Buy at support: If the stock breaks below the short-term support level of 452.00, it could be a good opportunity to buy.
* Sell at resistance: If the stock breaks above the short-term resistance level of 454.00, it could be a good opportunity to sell.
* Trend following: Follow the trend by buying or selling based on whether the stock is moving upwards or downwards.
* Mean reversion: Look for opportunities to buy when the stock is oversold and sell when it is overbought.
Some key levels to watch in Wipro:
* **Earnings**: The company has seen mixed earnings growth in recent quarters, with some analysts expecting further growth in the coming quarters.
* **Valuations**: The company's valuations have been relatively stable in recent months, with some metrics reaching moderate levels.
* **Sector performance**: The company's performance is closely tied to the broader sector performance of the Indian IT sector.
Remember to always use stop-losses and position sizing to manage risk when trading.

WIPRO // Levels // 4 hour "Welcome to SkyTradingZone "
Hello Everyone 👋
Here are the levels for Wipro (WIPRO) based on a 4-hour chart:
**Resistance Levels:**
1. 444.50 - 454.50 (previous high)
2. 458.00 - 468.00 (psychological level)
3. 472.50 - 482.50 (resistance zone)
**Support Levels:**
1. 430.50 - 440.50 (previous low)
2. 422.00 - 432.00 (psychological level)
3. 410.00 - 420.00 (support zone)
**Key Levels:**
1. 436.50 - a crucial level to watch for trend continuation or reversal
2. 418.50 - a potential reversal zone
**Notes:**
* Wipro is currently trading around the resistance level of 436.50.
* A break above this level could lead to further upside momentum.
* A break below the support level of 418.50 could lead to a reversal in the trend.
* The levels listed are based on historical data and may not be valid in the future.
Please keep in mind that these levels are not a guarantee of future price movements and are only intended to provide general guidance. It's always important to do your own research and consider multiple factors before making any investment decisions.
Additionally, you can consider the following technical indicators to get a better view of the market:
* RSI: The Relative Strength Index (RSI) is currently around 60, which is in the overbought zone.
* MACD: The Moving Average Convergence Divergence (MACD) is currently in a bearish crossover.
* Bollinger Bands: Wipro is currently trading above the upper band of the Bollinger Bands, indicating high volatility.
Please consult other sources and consider multiple factors before making any investment decisions.
It's also important to note that the company's performance in the IT sector, as well as any changes in its business strategy or partnerships with other companies in the industry, can also impact the stock's price movement. It's always a good idea to stay up-to-date with the latest news and developments before making any investment decisions.
In particular, keep an eye on Wipro's quarterly results, client additions, and revenue growth, as well as any changes in global IT trends or regulations that may impact the industry.
