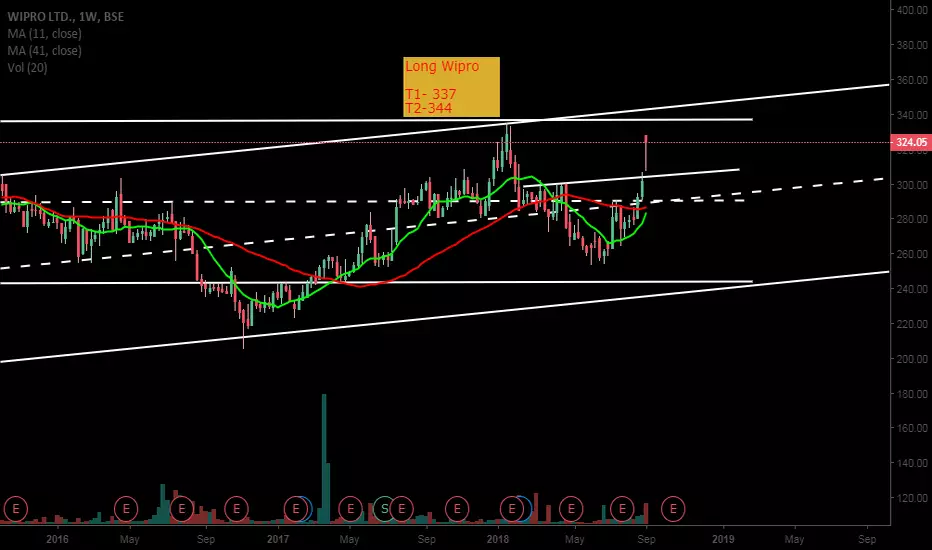
Wipro - Weaker of the whole Tech packWe can all agree that Wipro is a fundamentally weak stock in all of frontline Tech stocks.
Stock has been moving up following the trend line during corrections making newer highs everytime it corrects. That seems to have paused at 330 which is also a big resistance zone which was also the highs made before 2000 tech bubble burst.
Stock may retest the trend line again but will it survive this correction? Only time will tell...
Wipro

TECHM october series importanr levels I see some sort of correction in it sector to balance the one way rally ... but the correction will again get over soon looking at the earning season into picture as well as the usd inr depriciation will generate better revenue story for these stocks like tcs infy etc

WIPRO - Flag formation - 120minWIPRO
Flag Formation in wipro 120 mins chart. If BO with huge volume, we can see 400 levels.
Immediate resistance: 338
Support :320,318

Wipro Candlestick Pattern - Sell @322Wipro Sell @322 as per volume and candle pattern.
Stoploss is 323.2
Target is 1.5+

MyAlgo : xMRSI-Progresser: Intraday : 26Sep-WIPRO-ShortBased on my "xMRSI-Progresser" predictive trading methodologies, its going to be a RED candle on 26-Sep-2018 for WIPRO
Sell Below(5Min candle close): 327.5 for targets -
T1: 325
T2: 323.6
T3: 322
SL: 330.1
Note: These calls are based on my own analysis. It may or may not work well for you.So please carefully consider whether it is suitable for you and please do your own research before attempting any. The profit/loss made by you due to this call, is solely your own responsibility. Thanks, All the best. Happy Trading. :-)

Wipro Bearish Engulfing Wipro had engulfing pattern on strong resistance .
levels mentioned on chart.

INTRADAY TRADE - 14/09/2018- "WIPRO" ACTION TO BE TAKEN:
1. Firstly load your chart in the time frame of 1 hour
2. Mark the "HIGH" and "LOW" for the first 1 hour session
3. In this scrip, the strategy is to "SHORT"
MOST IMPORTANT PART OF TRADING:
We will enter the "SHORT" trade ONLY IF, the low of the FIRST HOUR candle is broken
TARGET:
"TRAILING THE SL or BOOK AS PER YOUR STRATEGY"
STOP LOSS:
At the inception of trade, SL will be the "HIGH" of the FIRST HOUR CANDLE which you can TRAIL as the session progress
PS:
"Idea published is in relation only for the trade to be taken on 14/09/2018"
If the position remains in your favour and you have good margin carry forward the position to get that extra edge of the profit
"BE PATIENT" and "BOOK HUGE PROFITS"
For more such INTRADAY trades and POSITIONAL trades
"STAY CONNECTED" and if you are the idea stands profitable, do me a small favor by posting the image of your profits
Thanks,
Siddharth


infy chart structure and levelsinfy given a signal to go long on friday after a consolidation now its trying to reach again to its class ! or i must say CLASS APART!


tech m , weekly levels the stock had not performed yet , and is one of the most badly beaten stocks in the IT sector thus , now to maintain the index the stock need to perform and current structure as far as its above 650 looks very well!

WIPRO near strong SUPPORT ZONE. It may bouncebackWIPRO near strong SUPPORT ZONE. It may bounceback. Current price is near the good support zone. If holds 245 levels on closing basis, can bounce to 300 in short term.


nifty IT levels , possible upsides and slides !!!!!!plotted levels for nifty it , need to check it closely to take position in it sector !

wipro moving towards 310 -316+++ 340??? I see a good upside in wipro for near term target of 310 , 316 and short term target of 340 in 3 months ...HOLDDDDDDDDDDDDDDDDDD


Finally IT stocks gaining some momentumWipro broke out on Daily and weekly chart yesterday.
One can go long at CMP 297 with SL below recent swing low 283 and target 338

Long WiproNSE:WIPRO Breakout will happen above 497.5-498 with the Target of 510. This is the resistance level of the Double top as well as cup pattern built now.

Nifty IT Medium term viewWe are looking at a 8 year Nifty IT chart
Lets see what the chart is trying to tell us...
- Between 2009 to 2015 the price has risen from 1933 levels to 12908 levels
- Since Jan 2009 till March 2015 the index has been making higher top higher bottom
- It is only after March 2015 that the index is seen making lower top lower bottom on a regular basis
Hence applying Fibonacci retracement level on the entire Bull cycle seen in NIFTY IT since Jan 2009 to March 2015 (roughly 75 months)
- It is further observed that since 2015 Price is trading in a Downtrend channel
- Blue trend line drawn from 2009 lows looks likely to be the Laxman Rekha (Make or Break line)
2 likely scenarios have been charted out...
Eventual target for NIFTY IT-8750-8600 zone which is 38.2% retracement level of the entire rise from 1933 levels to 12908 levels
- Time wise 38.2% of 75 months is 29 months giving us time till Sept 2017
- Channel support around Sept-Oct 2017 comes at 8750 levels
Things that one should consider before initiating a trade
- this is a medium term 6 months view
- Wait for the levels to come
- allow price behavior around key levels discussed in the chart to give further confirmation
- Understand the Risk involved & Reward potential
- Plan your trade accordingly
____________________________________________________________________________
"Be sure you put your feet in the right place, then stand firm." - Abraham Lincoln
____________________________________________________________________________
Take care and safe trading...!!!

BPrime-3 : Wipro will it go down ?!I think , as assured I have fullfilled Bprime, BSwing & both Index ( Nifty & BankNifty ).
Happy Trading :)

Nifty ITIT industry has been in a bearish tone forming lower high - lower low since Q2-2015. The industry is under pressure with margins and visas followed by blow of Rupee appreciation.
For short term, 9,880-9,900 stands to be crucial support. The reverse Bullish AB=CD around 9,900 at rising trend line indicates reversal on cards. As per time analysis, the previous rise and fall took 55 trading days and if go by "history repeats itself", the reversal can take place on 25th April (+/- 2 trading days). RSI is back in an oversold territory.
TCS will be releasing results today which has weight age of ~45% in IT index will be important to watch. The above view on IT index will negate on a close below 9,800.
