VBLBearish Wyckoff Distribution Schematic #2 Events
expect more selling and be careful with wide jumps as those may not be practical to hold
Wyckoff

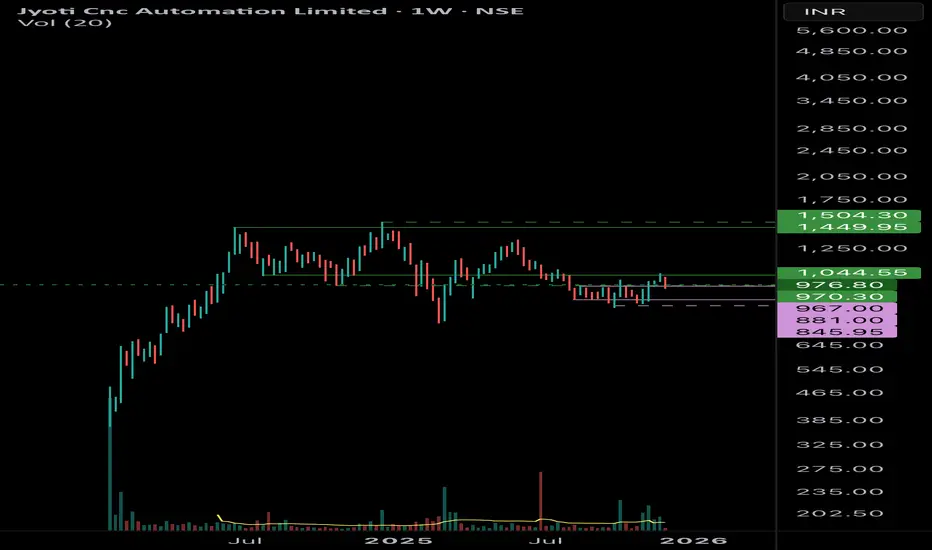
Wyckoff accumulation breakout - Phase E in daily time frameThe stock is under accumulation in weekly timeframe and In phase D stage. Under timeframe, it’s moving out of accumulation and presently in phase E - Pull back to Creek zone. The breakout from this daily accommodation Leads the stock to phase D weekly accumulation zone. From that, the price is expected to reach Creek zone. The present price is ready for entry. Stoploss can be midpoint of daily accumulation zone.
ZYDUS Lifesciences - An Interesting ChartA good accumulation Range
A "SPRING" and a good up move
Relative strength positive
Money flow positive
Increased Buying Pressure
Good quarterly results
Now, A break out of the Accumulatio zone on increased volume. Also going past an old supply area of the BC bar.
Looks poised for a move to stage 2. Could also test the previous supply before further up move. Next couple of sessions would throw more light.

GoldGold ( OANDA:XAUUSD ) – Bearish Wyckoff Distribution (Unorthodox) in Play
Gold is currently trading around $3273/oz and appears to be in Phase D of a Bearish Wyckoff Distribution Schematic #1 (Unorthodox) on the 4H chart. The price is showing signs of weakness, but a final upthrust toward $3370 can’t be ruled out before a deeper breakdown.
Key level to watch:
⚠️ Breakdown confirmation below $3260–3200 could open the gates for a sharper decline.
Bearish structure still unfolding – traders should stay alert for signs of a last bull trap before distribution completes.
#Gold #XAUUSD #Wyckoff #TechnicalAnalysis #CommodityTrading #PriceAction

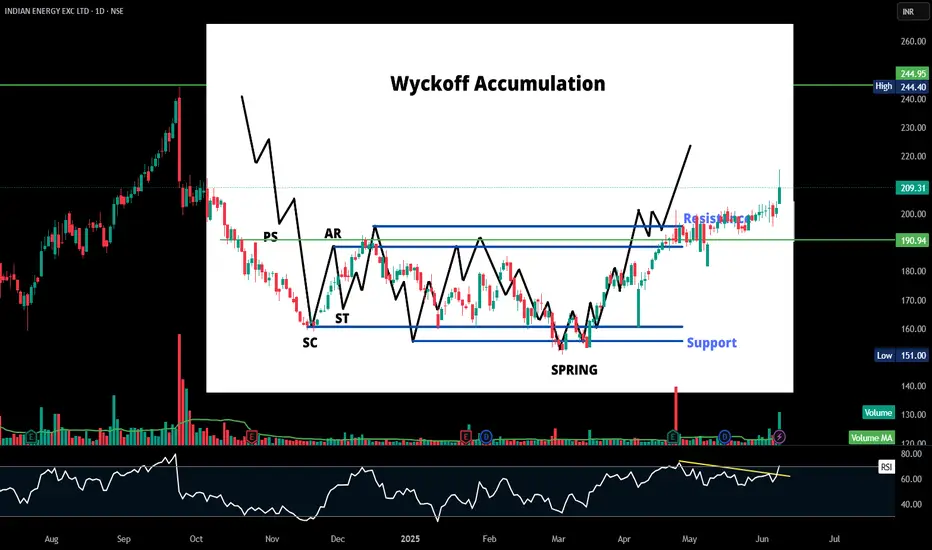
IEX | Consolidation BreakOut | DailyHere’s a **condensed Wyckoff Accumulation Analysis** based on your most recent chart for **Indian Energy Exchange Ltd. (IEX)**:
---
🔍 **Key Wyckoff Phases & Levels:**
* **PS (Preliminary Support):** Initial slowing of the downtrend.
* **SC (Selling Climax):** Sharp selloff forming the bottom.
* **AR (Automatic Rally):** First bounce confirming initial demand.
* **ST (Secondary Test):** Testing previous lows around SC.
* **Spring:** Fakeout below support, creating panic-selling before reversal.
* **Markup Phase:** Breakout above resistance, transitioning to uptrend.
---
📈 **Critical Price Zones:**
* **Support:** \~₹203 and 190
* **Resistance:** \~255
---
⚡ **Technical Indicators:**
* **RSI:** Above 60 with breakout, suggesting strong momentum.
* **Volume:** Increased volume on breakout candles signals institutional accumulation.
---
💡 **Conclusion:**
IEX has confirmed the Wyckoff accumulation pattern and is now in the **markup phase**, targeting ₹245 to 255 if it sustains above ₹203 and 190.
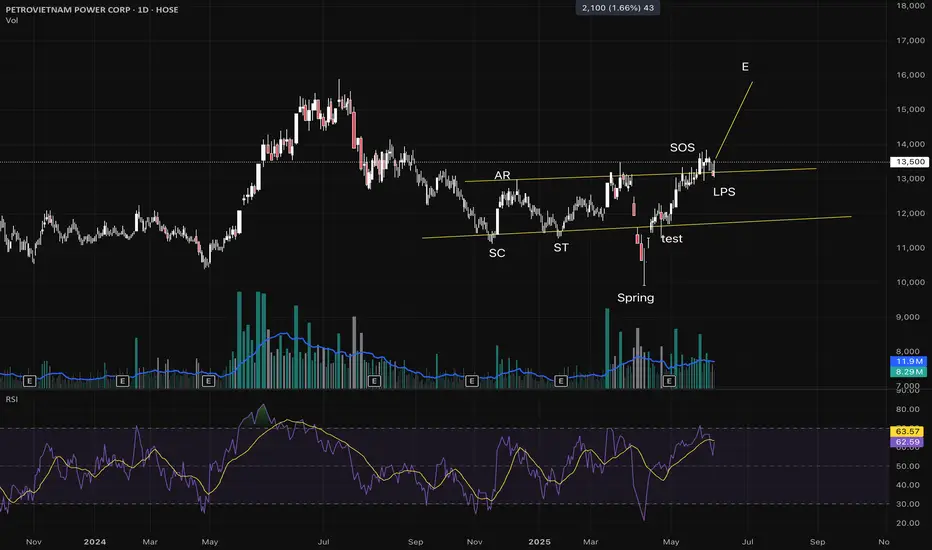
Buy POW - Entered Phase E of Wyckoff Cycle**Investment Idea: Buy POW - Entered Phase E of Wyckoff Cycle**
- **Stock**: POW (HOSE)
- **Wyckoff Analysis**: POW has completed Phases A-D and is now in Phase E, the markup phase of the Wyckoff cycle. Accumulation signs were evident in Phase C (Spring) with increasing volume and price stabilization.
- **Price Target**: 15 - 17 (based on previous resistance levels and potential upside in Phase E).
- **Entry Point**: Consider buying around the current price, ideally on a slight pullback to confirm demand.
- **Stop Loss**: Set below the nearest support level (approximately 10% from the entry point, depending on your risk management strategy).
- **Recommendation**: Closely monitor trading volume and confirmation signals in Phase E to ensure the uptrend continues.
*Disclaimer*: This is not investment advice; please conduct your own research and manage risks before trading.
---
Let me know if you'd like to adjust the content further!
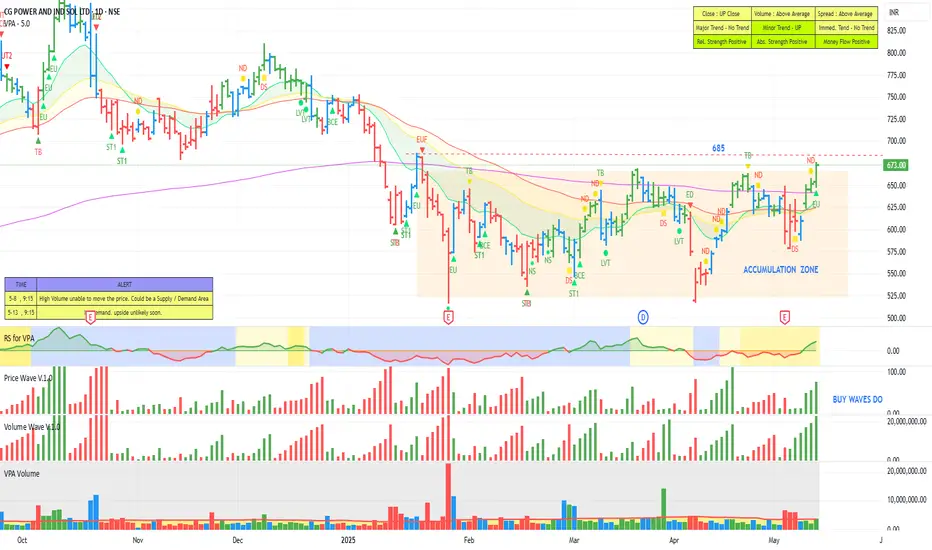
CG POWER - A stock for your WatchlistHere is another stock for your watch list, this is CG power which has been consolidating for nearly 3 months in a typical Wyckoffian accumulation zone. Now it looks ready to move out of the zone and move up further. As you can see the buy waves are getting stronger and the relative strength and the money flow are all positive. However, we need to see more volumes coming in to fuel the up move and this has to cross above the important pivot of 685, then we could see at least another 20% up move.
PVRInoxPVRInox is under Wyckoff distribution Schematic #1 on weekly chart. this may still take few more month for this to complete.
this is bearish distribution and presently its in phase D
I am hopeful one more chance you may get to exit long position

TatamotorsTataMotors has formed Wyckoff Distribution Schematic 2
it may try to bounce one last time before going further down

HIL - Possible AccumulationMarkets can have three possible movements - Up Trend, Consolidation and Down Trend. Usually the sequence of these phases is Consolidation (Accumulation) --> Up Trend (Market Participation) -> Consolidation (Distribution) --> Down Trend (Market Participation). Some might even call these phases as phase 1, 2, 3 and 4.
HIL Looks in possible accumulation phase. This would be confirmed if price breaks the upper bound of the marked channels with strength.
I would buy any pullbacks after break or atleast trial to break the upper channel.
This material is for informational purposes only to show various phases of the market, and is in no way a trading recommendation.

AdbeBearish Wyckoff Distribution Schematic #2 (unorthodox)
I would be happy to go wrong however I do see this to test 260 in 2 yrs
it has to cross 590 to nullify this setup

asianpaintclearly someone is selling this stock in big quantity and making big exit.
stock is having distribution on daily chart and I don't rule out 2100
But pls be caution that wyckoff patterns takes lots of time and they are tough to trade considering the spikes in opposite direction of the trend.

CESCCESC price distribution is happening on 4 hour chart. it may trying to bounce upto 210 and then next LPSY may be formed and give fresh round of selling.
But pls be caution that wyckoff patterns takes lots of time and they are tough to trade considering the spikes in opposite direction of the trend.

UPL | Wyckoff Events & Phases Explained Wyckoff developed a price action market theory which is still a leading principle in today's trading practice.
The Wyckoff method states that the price cycle of a traded instrument consists of 4 stages – Accumulation, Markup, Distribution, and MarkDown.
👉TEXTBOOK EXAMPLE Accumulation Schematic: Wyckoff Events and Phases👈
Price Action Analysis
And this is the accumulation stage -
1) PS— Preliminary Support, where substantial buying begins to provide pronounced support after a continued down-move.
- Volume increases and price spread widens, signaling that the down-move may be approaching its end.
2) SC—Selling Climax, the point at which widening spread and selling pressure usually in high point and heavy or panicky selling by the public is being absorbed by larger professional interests at or near a bottom.
- Often price will close well off the low in an SC, reflecting the buying by these large interests.
3) AR—Automatic Rally, which occurs because intense selling pressure has greatly decline.
- A wave of buying easily pushes prices up.
- The high of this rally will help define the upper boundary of an accumulation.
4) ST—Secondary Test, in which price revisits the area of the SC to test the supply/demand.
- If a bottom is to be confirmed, volume and price spread should be decline as the market approaches support in the area of the SC.
- It is common to have multiple STs after an SC.
5) SOS—Sign Of Strength, a price advance on increasing spread and relatively higher volume.
6) LPS—Last Point Of Support, the low point of a reaction or pullback after an SOS.
7) BU/LPS- Backing up to an LPS means a pullback to support that was formerly resistant, on diminished spread and volume.
All the phases of accumulation stage-
Phase A:
Phase A marks the stopping of the prior downtrend.
-- Up to this point, supply has been dominant.
-- The approaching cutback of supply is evidenced in preliminary support (PS) and a selling climax (SC).
-- A successful secondary test (ST) in the area of the SC will show less selling than previously and a narrowing of spread and decreased volume, generally stopping at or above the same price level as the SC.
-- If the ST goes lower than that of the SC, one can anticipate either new lows or prolonged consolidation.
-- Horizontal lines may be drawn to help focus attention on market behavior, as seen in the two Accumulation Schematics above.
Phase B:
-- Phase B serves the function of “building a cause” for a new uptrend
-- In Phase B, institutions and large professional interests are accumulating relatively low-priced inventory in anticipation of the next markup.
--There are usually multiple STs during Phase B'
-- Institutional buying and selling impart the characteristic up-and-down price action of the trading range.
--Early on in Phase B, the price swings tend to be wide and accompanied by high volume.
Phase C:
-- It is in Phase C that the stock price goes through a final test of the remaining supply.
-- this marks the beginning of a new uptrend, trapping the late sellers (bears).
-- It indicates that the stock is likely to be ready to move up, so this is a good time to initiate at least a partial long position.
-- The appearance of an SOS shortly after a spring or shakeout validates the analysis.
Phase D:
--During Phase D, the price will move at least to the top
--LPSs in this phase are generally excellent places to initiate or add to profitable long positions.
Phase E:
--large operators can occur at any point in Phase E.
--These are sometimes called “stepping stones” on the way to even higher price targets.
--------------------------------------------------
Regards,
Revive Traders
------------------------------------------------
Guys check out the related POST as well, it went FANTASTIC !
🙏FOLLOW for more !
👍LIKE if U find it useful !
✍COMMENT your views & feedback !

LODHA Trade Analysis for Buy using Wyckoff methodWyckoff Story
Prior to trading range we were in uptrend and then we have Stoping action and CHoCH (Change of character). Let’s assume our bias is accumulation based on CHoCH as we don’t see lot of supply in the CHoCH.
Down wave Analysis
We can see that the volatility of the down wave is decreasing from Phase A to Phase D, confirming the accumulation Bias.
Volume Analysis
We have supply decrease from Phase A to Phase C indicating supply is being absorbed.
Sign of Strength
we have Major sign of strength in phase D with good demand volume indicating institutions are present in buying.
The Backing Up Action (BAU) has less supply indicating sellers are absent.
Final View
Bullish on stock

BPCL Trade Analysis for Buy using Wyckoff method.Wyckoff Story
Prior to trading range we were in uptrend and then we have Stoping action and CHoCH (Change of character). Let’s assume our bias is accumulation based on CHoCH as we don’t see lot of supply in the CHoCH.
Down wave Analysis
We can see that the volatility of the down wave is decreasing from Phase A to Phase D, confirming the accumulation Bias.
Volume Analysis
In Phase B we see increase in supply but the price is not able to go below the trading range, lot of effort to push the price down but fails, indicating effort vs result is not synced. Confirming the accumulation bias.
We have supply decrease from Phase A to Phase C indicating supply is being absorbed.
Sign of Strength
we have Major sign of strength in phase D with good demand volume indicating institutions are present in buying.
Final View
Bullish on stock with entry marked on the chart


KSBDistribution Schematic( 1 or 2): Wyckoff bearish
This is just phase 2 right now. It will take still few weeks and yet to confirm whether stage 3 will be Schematic 1 or 2.
I am trying new approach to highlight wyckoff, hope this works well.

NiftyWyckoff Bearish Distribution Schematic #1: Event & Phases
Phase C is undergoing, once goes into Phase D expect selling

IEX is ready for a Bull ride.NSE:IEX
About Company :-
Indian Energy Exchange Ltd provides an automated platform and infrastructure for carrying out trading in electricity units for physical delivery of electricity. It's broker Just like Zerodha or Angel One but for electricity trading. with market share at present, IEX enjoys a dominant 90% market share in the total volume traded across all segments. However, recent regulations like "Market Coupling" could potentially impact IEX's prominence in this segment means market share will reduced if market coupling implemented by govt. in future.
Entry :- 160/- or Current Price.
Target :- At Supply Zone.

TataChemTatachem is forming Distribution Schematic #2 Wyckoff
presently it is in Phase C
Phase D may give the first bearish action

ELECTCAST LONGLets analyse a stock with wyckoffian 3rd law ..... ..........Volume is the EFFORT and Spread (Price) is the RESULT ............. someone just looking at only price and ignoring ........VOLUME ............ HALF the data thats available for analysis
Wyckoffian 3rd Law also gives importance to HARMONY ( small spread and small volume) .................. ANAMOLY ( small spread with large volume or large spread with small volume ) ...... both are important when we analyse the chart and activity of the COMPOSITE MAN
candle 1 and 5 is harmony and candle 2,3 ,4 are ANAMOLY
candle 1 ... large volume high range candle with breakout , candle 2 was low range but high volume ....... price had a pause for few days ... , candle 3 high range and low volume candle ... manipulation by composite man to shake out weak hands candle 4 ..... high range candle with low volume ....candle 5 ..... again the smart money checking the easy of movement and could get a high range candle with less volume(Less EFFORT ) compared to the breakout volume ....... stock is ready to be marked up
once we understand this Target 1 reached .. calculated by fibonacci extension tool
target 2 can also be calculated

Wipro : Wyckoff pattern?I see current structure in Wipro similar to Wyckoff Accumulation Distribution Pattern. My assumption is based on markings done on chart ,200 EMA pullback and today's reversal candle. Want to see a clear close above 425.
Disc :It's not an investment advise to buy or sell
