CBDCs in the World Market: A Comprehensive OverviewUnderstanding CBDCs
A CBDC is a digital version of a country’s fiat currency, such as the dollar, euro, yuan, or rupee. Unlike cryptocurrencies like Bitcoin or Ethereum, CBDCs are centralized, regulated, and fully backed by the issuing government. They combine the efficiency of digital payments with the trust and stability of central bank money.
CBDCs can be broadly classified into two types:
Retail CBDCs – Designed for use by the general public for daily transactions, similar to cash or bank deposits.
Wholesale CBDCs – Used primarily by financial institutions for interbank settlements and large-value transactions.
Both types aim to modernize payment systems while maintaining monetary control.
Global Adoption Status
Across the world, CBDC development is progressing at different speeds:
China has taken a global lead with its Digital Yuan (e-CNY), already tested across multiple cities and integrated into retail payments.
European Union is developing the Digital Euro to complement cash and ensure monetary sovereignty.
United States is still in the research and pilot phase, focusing on privacy, financial stability, and regulatory implications.
India has launched both retail and wholesale pilots of the Digital Rupee (e₹), targeting financial inclusion and payment efficiency.
Emerging economies like Nigeria (eNaira) and the Bahamas (Sand Dollar) have already rolled out CBDCs to improve access to banking services.
According to global financial institutions, more than 100 countries are actively exploring CBDCs, covering over 90% of global GDP. This highlights the strategic importance of CBDCs in the world market.
Impact on the Global Financial System
1. Transformation of Payment Systems
CBDCs significantly enhance payment efficiency. Transactions become faster, cheaper, and more secure compared to traditional banking systems. Real-time settlement reduces counterparty risk and dependency on intermediaries, particularly in cross-border payments.
2. Cross-Border Trade and Remittances
CBDCs have the potential to revolutionize international trade and remittances. Current cross-border payments are slow and expensive due to multiple intermediaries and currency conversions. Interoperable CBDC systems can enable instant, low-cost international transactions, benefitting global trade and migrant workers sending remittances.
3. Reduced Dependence on the US Dollar
The dominance of the US dollar in global trade and reserves has long shaped world markets. CBDCs, especially those developed by large economies like China, could reduce dollar dependency by enabling direct bilateral trade settlements in digital national currencies. This may gradually shift the balance of global monetary power.
Monetary Policy Implications
CBDCs give central banks powerful new tools for monetary policy:
Direct transmission of policy measures, such as stimulus payments directly to citizens.
Better control over money supply, reducing leakages and inefficiencies.
Negative interest rates could be implemented more effectively if needed during economic crises.
However, CBDCs also pose risks. Large-scale movement of funds from commercial banks to CBDC wallets could impact bank liquidity, potentially destabilizing the banking system if not carefully managed.
Financial Inclusion and Economic Development
One of the strongest arguments for CBDCs is financial inclusion. In many developing countries, millions remain unbanked due to lack of access to formal banking infrastructure. CBDCs can be accessed through mobile phones, enabling people to participate in the digital economy without traditional bank accounts.
This inclusion supports:
Poverty reduction
Better delivery of government subsidies
Increased participation in formal economic activities
In the global market, financially inclusive economies are more resilient, productive, and attractive to investors.
Competition with Cryptocurrencies and Stablecoins
CBDCs are often seen as a response to the rise of cryptocurrencies and private stablecoins. While cryptocurrencies offer decentralization and anonymity, they also introduce volatility and regulatory concerns. Stablecoins, though pegged to fiat currencies, are issued by private entities, raising questions about trust and systemic risk.
CBDCs provide:
Price stability
Legal backing
Regulatory oversight
As CBDCs gain adoption, they may reduce the appeal of private digital currencies for everyday transactions, while cryptocurrencies may continue to exist as speculative or alternative assets.
Geopolitical and Strategic Implications
CBDCs are not just financial tools; they are geopolitical instruments. Countries that successfully implement CBDCs can gain strategic advantages in global trade, sanctions enforcement, and financial diplomacy.
For example:
CBDCs can help countries bypass traditional payment networks.
Regional CBDC alliances may emerge, reshaping global economic blocs.
Data generated from CBDC transactions can improve economic planning but also raises surveillance concerns.
Thus, CBDCs are becoming a key element of economic sovereignty in the world market.
Challenges and Risks
Despite their potential, CBDCs face several challenges:
Privacy concerns – Balancing transparency with individual privacy is critical.
Cybersecurity risks – CBDCs require robust digital infrastructure to prevent hacking and fraud.
Regulatory coordination – Global interoperability needs international cooperation.
Technological inequality – Digital divide could exclude certain populations if not addressed.
Addressing these challenges is essential for successful global adoption.
Future Outlook
The future of CBDCs in the world market appears inevitable rather than optional. As digital economies expand and cash usage declines, CBDCs will likely become a core component of national and international financial systems. Over time, we may see:
Interconnected global CBDC networks
Reduced transaction costs in global trade
More efficient crisis management by central banks
A gradual transformation of how money is created, distributed, and used
Conclusion
CBDCs represent a fundamental shift in the evolution of money. In the world market, they promise faster payments, enhanced financial inclusion, stronger monetary control, and potential rebalancing of global economic power. While challenges remain, the momentum behind CBDCs suggests they will play a central role in shaping the future of global finance. As countries continue to innovate and collaborate, CBDCs may redefine trust, efficiency, and sovereignty in the digital age of money.
X-indicator

How One Quant Giant Quietly Reshaped Global MarketsJane Street Impact
Jane Street is not a household name like Goldman Sachs or JPMorgan, yet its impact on modern financial markets is enormous. Founded in 2000, Jane Street is a quantitative trading firm and liquidity provider that operates across equities, ETFs, bonds, options, and cryptocurrencies in markets around the world. Its influence is subtle but powerful: tighter spreads, faster markets, changing trading strategies, and a new reality for both institutions and retail traders.
1. Market Liquidity: Making Markets “Always On”
One of Jane Street’s biggest contributions is liquidity provision. The firm acts as a market maker, constantly posting buy and sell quotes. This ensures that traders can enter or exit positions quickly without massive price slippage.
Before firms like Jane Street dominated market making:
Spreads were wider
Liquidity was inconsistent
Large trades caused sharp price moves
Jane Street changed this by using sophisticated algorithms that continuously adjust prices based on real-time supply, demand, and risk. The result is:
Narrower bid–ask spreads
Deeper order books
More stable short-term pricing
For investors, this reduces transaction costs. For traders, it means faster fills—but also tougher competition.
2. ETFs and Price Efficiency
Jane Street is one of the largest ETF market makers in the world. ETFs rely on a mechanism where prices stay close to their underlying assets through arbitrage. Jane Street plays a key role in this process.
Their impact includes:
Keeping ETF prices aligned with net asset value (NAV)
Enabling massive ETF growth globally
Making passive investing cheaper and more reliable
Without firms like Jane Street, ETFs would trade with larger discounts or premiums, reducing trust in the product. Their efficiency helped fuel the explosion of ETFs across equities, commodities, bonds, and thematic strategies.
3. Volatility: Reduced on Average, Sharper in Extremes
Jane Street’s presence generally reduces everyday volatility. Constant liquidity smooths price movement during normal conditions. However, in extreme events, the picture changes.
During market stress:
Algorithms widen spreads
Liquidity can temporarily vanish
Prices can move suddenly and violently
This doesn’t mean Jane Street causes crashes, but it highlights a new reality: modern markets are stable—until they aren’t. When risk models flip to “defensive,” liquidity providers step back simultaneously, amplifying sudden moves.
4. Speed and the Rise of Microstructure Trading
Jane Street operates at ultra-high speed, reacting to market signals in microseconds. This reshaped market microstructure in several ways:
Price discovery happens faster
Arbitrage opportunities disappear quickly
Traditional discretionary trading edges shrink
For slower participants, this creates frustration. Patterns that once worked for minutes now work for seconds—or not at all. This is why many retail traders feel markets have become “harder” or “unfair,” even though they are technically more efficient.
5. Impact on Retail Traders
Jane Street doesn’t trade against retail traders directly in a predatory sense, but its presence changes the game:
Positive impacts
Lower spreads
Better execution prices
Easier entry and exit
Negative impacts
Fake breakouts due to liquidity probing
Stops hunted in low-liquidity zones
Retail strategies losing edge faster
Many retail traders unknowingly trade against sophisticated liquidity models. This is why modern trading education increasingly emphasizes:
Market structure
Liquidity zones
Institutional footprints
6. Institutional Trading and Strategy Evolution
Jane Street forced traditional institutions to evolve. Old-school floor trading and manual arbitrage could not compete with algorithmic precision.
As a result:
Banks adopted quant desks
Hedge funds invested heavily in data science
Trading shifted from intuition to probability models
Risk management also improved. Jane Street is known for strict risk controls, scenario testing, and disciplined capital allocation. This professionalized trading across the industry.
7. Cultural Impact: Redefining What a Trader Is
Jane Street changed the identity of a “trader.” Today, traders are often:
Mathematicians
Engineers
Physicists
Data scientists
The firm’s culture emphasizes:
Collaboration over ego
Continuous learning
Intellectual honesty
This influenced the broader finance world, making quantitative skills more valuable than aggressive personalities or gut instinct.
8. Regulatory and Ethical Implications
Jane Street operates within regulations, but its scale raises questions:
Should ultra-fast firms have speed advantages?
Is liquidity real if it disappears during crises?
Do algorithms create unequal access?
Regulators worldwide now focus more on:
Market fairness
Order-to-trade ratios
Algorithmic risk controls
Jane Street’s success indirectly pushed regulators to modernize frameworks designed for a pre-algorithm era.
9. Global Impact, Including Emerging Markets
Jane Street trades globally, including emerging markets through derivatives, ETFs, and arbitrage links. This has several effects:
Faster price transmission from global cues
Increased correlation across markets
Reduced inefficiencies
For countries like India, this means domestic markets respond more quickly to global flows. While this increases efficiency, it also reduces insulation from global shocks.
10. The Bigger Picture: Markets as Machines
Jane Street symbolizes a broader shift: markets are no longer human-driven arenas—they are machine ecosystems. Prices move not because of stories alone, but because of models reacting to probabilities, correlations, and risk constraints.
This doesn’t eliminate opportunity—it changes it. Traders who understand liquidity, structure, and behavior thrive. Those relying only on indicators struggle.
Conclusion
Jane Street’s impact on financial markets is profound yet understated. It improved liquidity, tightened spreads, enhanced ETF efficiency, and pushed trading into a new quantitative era. At the same time, it raised the bar for participation, forcing traders and institutions alike to adapt.
Jane Street did not “break” the markets—it rewired them. Understanding its role helps explain why modern price action behaves the way it does: fast, efficient, occasionally ruthless, and deeply structural.
In today’s world, trading is no longer about beating the market emotionally—it’s about understanding the systems that move it. Jane Street is one of the architects of that system.

Market Reform FalloutUnderstanding the Aftershocks of Structural Change
Market reforms are often introduced with ambitious goals: boosting efficiency, improving transparency, attracting investment, and accelerating long-term economic growth. Governments, regulators, and international institutions promote reforms as necessary corrections to outdated systems. However, while reforms may promise long-term gains, they almost always generate short-term disruptions, unintended consequences, and social tensions. These consequences—known as market reform fallout—shape economic outcomes far more than policy announcements alone.
Market reform fallout refers to the economic, financial, social, and political aftershocks that emerge when structural changes alter how markets function. These aftershocks can be temporary or persistent, localized or systemic, depending on the scale, speed, and design of reforms.
Why Market Reforms Are Necessary—but Risky
Markets naturally evolve, but institutional rigidities often prevent them from adapting efficiently. Reforms are typically introduced to address:
Inefficiencies and monopolistic practices
Fiscal imbalances and rising public debt
Capital misallocation
Weak financial systems
Low productivity and competitiveness
However, markets are complex adaptive systems. Changing one rule often triggers reactions across employment, capital flows, consumption, and investor sentiment. The gap between policy intent and market reality is where fallout begins.
Short-Term Economic Disruptions
One of the most visible forms of market reform fallout is short-term economic instability.
1. Volatility in Financial Markets
Reforms related to taxation, subsidies, labor laws, or financial regulation can immediately affect earnings expectations. Equity markets often react with sharp volatility as investors reassess risk and profitability. Bond yields may spike if reforms raise inflation or fiscal uncertainty.
Currency markets are particularly sensitive. Capital account liberalization or interest rate reforms can trigger sudden inflows or outflows, leading to exchange rate instability.
2. Slower Growth During Transition
Structural reforms frequently slow economic activity in the short run. Removing subsidies raises input costs, tightening credit reduces liquidity, and deregulation disrupts established supply chains. Businesses often delay investment until policy clarity emerges, creating a temporary growth vacuum.
Employment and Labor Market Fallout
Labor markets are among the most affected areas during reforms.
Job Losses in Legacy Sectors
When governments liberalize industries or privatize public enterprises, inefficient firms often downsize or shut down. While reforms aim to reallocate labor toward productive sectors, the transition is rarely smooth. Workers in traditional industries face job losses before new opportunities emerge.
Informalization Risks
In developing economies, rigid labor reforms can unintentionally expand informal employment. Firms may avoid compliance costs by hiring contract or off-book workers, weakening job security and social protection.
Skill Mismatch
Reforms often favor capital-intensive or technology-driven sectors. Workers without relevant skills struggle to transition, widening inequality and fueling social resistance to reform agendas.
Social and Political Backlash
Economic fallout often spills into the social and political domain.
Rising Inequality
Market reforms may disproportionately benefit capital owners, skilled labor, and urban populations in the early stages. Rural communities, small businesses, and low-income households often bear higher costs through inflation, reduced subsidies, or job losses.
This perception—whether accurate or not—creates political resistance and erodes trust in institutions.
Public Protests and Policy Reversals
History shows that poorly communicated or rapidly implemented reforms can trigger widespread protests. Fuel price reforms, pension restructuring, and agricultural market liberalization are frequent flashpoints.
Political backlash may force governments to dilute or reverse reforms, reducing credibility and increasing policy uncertainty—often worsening the original problem.
Sector-Specific Fallout
Financial Sector Reforms
Banking and capital market reforms strengthen systems in the long run but can initially expose hidden weaknesses. Stricter norms often reveal non-performing assets, leading to credit contraction and reduced lending to businesses.
Agricultural Market Reforms
Reforms aimed at improving price discovery and market access may hurt small farmers if institutional support systems are weak. Without adequate storage, logistics, and bargaining power, farmers may face price volatility rather than stability.
Energy and Commodity Reforms
Removing price controls and subsidies improves fiscal discipline but raises costs for households and industries. Inflationary pressure often follows, forcing central banks to tighten policy—creating a feedback loop of slower growth.
Impact on Investment and Capital Flows
Reforms strongly influence domestic and foreign investment behavior.
Initial Capital Flight
Uncertainty around new rules, taxation, or regulatory enforcement can trigger short-term capital flight. Investors prefer clarity over optimism, and reform phases often involve ambiguity.
Long-Term Capital Attraction
If reforms succeed, they improve transparency, contract enforcement, and market depth. Over time, this attracts patient capital, foreign direct investment, and institutional participation. The challenge lies in surviving the transition phase.
The Role of Timing and Sequencing
One of the biggest determinants of reform fallout is sequencing.
Rapid reforms without institutional readiness amplify shocks
Gradual reforms reduce volatility but risk losing momentum
Poor coordination between fiscal, monetary, and structural policies magnifies instability
Countries that align reforms with business cycles and provide buffers—such as targeted welfare support or credit guarantees—experience milder fallout.
Lessons from Global Experience
Market reform fallout teaches several recurring lessons:
Communication matters as much as policy
Markets and citizens react less to reforms themselves and more to uncertainty around them.
Safety nets are non-negotiable
Without social protection, even economically sound reforms face rejection.
Institutions must evolve alongside markets
Courts, regulators, and enforcement mechanisms must adapt to new rules.
Reforms are political as well as economic
Ignoring distributional impacts leads to instability and reversals.
Conclusion: Fallout Is Not Failure
Market reform fallout is not a sign that reforms are flawed; it is evidence that markets are deeply interconnected with society. Structural change inevitably produces winners and losers, short-term pain and long-term gain. The true measure of reform success lies not in avoiding fallout—but in managing it intelligently.
Well-designed reforms anticipate disruption, protect vulnerable groups, maintain policy credibility, and allow markets time to adjust. When governments acknowledge fallout as part of the reform process rather than denying it, they increase the probability that reforms deliver sustainable growth, resilience, and inclusive prosperity.
In the end, market reforms reshape not just economies—but expectations, behavior, and trust. How leaders navigate the fallout determines whether reform becomes a foundation for progress or a trigger for prolonged instability.

Derivatives Explained in Detail (Imply & Describe)Introduction to Derivatives
Derivatives are financial instruments whose value is derived from an underlying asset. That underlying asset can be anything that has a measurable price—stocks, stock indices, commodities, currencies, interest rates, bonds, or even weather and volatility. The derivative itself has no independent value; its worth implies and reflects movements in the price of the underlying asset.
In simple terms:
If the underlying asset moves, the derivative moves.
Derivatives are widely used in modern financial markets for risk management (hedging), price discovery, speculation, and arbitrage. They are essential tools for institutions, traders, corporations, and even governments.
Meaning and Implication of Derivatives
The word derivative comes from the idea that the instrument “derives” its value from something else. For example, a futures contract on crude oil derives its price from the spot price of crude oil. If crude oil prices rise, the value of that futures contract generally rises as well.
The implied meaning of derivatives is forward-looking. Unlike spot market transactions, derivatives often represent expectations about future prices. When traders buy or sell derivatives, they are expressing a view—bullish, bearish, or neutral—on how the underlying asset will behave in the future.
Thus, derivatives markets often act as a mirror of market sentiment, reflecting expectations, fear, confidence, volatility, and institutional positioning.
Key Characteristics of Derivatives
No Physical Ownership
Most derivatives do not involve ownership of the underlying asset. You can trade derivatives on gold without owning gold, or on stocks without owning shares.
Leverage
Derivatives allow traders to control a large value of assets with relatively small capital. This magnifies both profits and losses.
Contract-Based
Derivatives are legal contracts that specify terms such as price, quantity, expiration date, and settlement method.
Time-Bound
Most derivatives have an expiry date. Their value decays or changes as time passes, especially in options.
Risk Transfer
Derivatives shift risk from one party to another. Hedgers transfer risk; speculators absorb it for potential profit.
Types of Derivatives
1. Futures Contracts
A futures contract is an agreement to buy or sell an asset at a predetermined price on a future date.
Traded on exchanges (NSE, BSE, CME)
Standardized contracts
Daily mark-to-market settlement
Widely used in commodities, indices, and currencies
Implication:
Futures reflect collective expectations of future prices and institutional positioning.
2. Options Contracts
An option gives the buyer the right but not the obligation to buy or sell an underlying asset at a fixed price before or on expiry.
Call Option: Right to buy
Put Option: Right to sell
Options involve a premium, which is the cost of the contract.
Implication:
Options imply market expectations of volatility, not just direction. Concepts like implied volatility are derived directly from option prices.
3. Forwards Contracts
Forwards are private, customized agreements between two parties to trade an asset at a future date.
Not traded on exchanges
High counterparty risk
Common in corporate hedging (FX, interest rates)
Implication:
Forwards reflect negotiated future price expectations between specific parties.
4. Swaps
Swaps involve the exchange of cash flows between two parties.
Interest rate swaps
Currency swaps
Commodity swaps
Implication:
Swaps help institutions manage long-term financial risks and funding costs.
Why Derivatives Exist
1. Hedging Risk
Producers, exporters, investors, and institutions use derivatives to protect against adverse price movements.
Example:
A farmer hedges crop prices using futures
An airline hedges fuel costs
An exporter hedges currency risk
Here, derivatives imply risk insurance rather than speculation.
2. Speculation
Traders use derivatives to profit from price movements without owning the asset.
Lower capital required
Faster returns (and losses)
High risk, high reward
Implication:
Speculation adds liquidity but increases volatility if unmanaged.
3. Arbitrage
Arbitrageurs exploit price differences between markets.
Example:
Spot vs futures mispricing
Index vs constituent stocks
Derivatives help enforce price efficiency in financial markets.
Role of Derivatives in Price Discovery
Derivatives markets often react faster than cash markets because:
Lower transaction costs
Higher leverage
Institutional dominance
As a result, futures and options prices often lead spot prices. This makes derivatives a crucial tool for understanding:
Market trend direction
Institutional activity
Volatility expectations
In this sense, derivatives imply where “smart money” is positioned.
Risks Associated with Derivatives
Leverage Risk – Small moves can cause large losses
Liquidity Risk – Wide spreads during volatile periods
Time Decay – Especially harmful for option buyers
Complexity Risk – Misunderstanding contract behavior
Counterparty Risk – In OTC derivatives
Derivatives are powerful tools, but misuse can lead to catastrophic losses, as seen in multiple global financial crises.
Derivatives in the Indian Market
In India, derivatives are actively traded on NSE and BSE, mainly in:
Index derivatives (NIFTY, BANK NIFTY)
Stock futures and options
Currency derivatives
India’s derivatives market often has higher volumes than the cash market, highlighting its importance in price discovery and institutional trading.
Economic Importance of Derivatives
From a macroeconomic perspective, derivatives:
Improve market efficiency
Allow better risk distribution
Enhance capital allocation
Support global trade and investment
However, excessive speculative use can amplify systemic risk, making regulation essential.
Conclusion
Derivatives are not merely trading instruments; they are the backbone of modern financial markets. Their value is implied by the movement of underlying assets, expectations of future prices, and market psychology. When used responsibly, derivatives provide stability, efficiency, and risk management. When misused, they can magnify losses and destabilize entire economies.
Understanding derivatives is crucial for anyone involved in finance, trading, economics, or investment strategy. They are neither good nor bad by nature—their impact depends entirely on how intelligently they are used.

Trade with Volume: The Hidden Power Behind Price (In-Depth)1. What Is Volume in Trading?
Volume represents the number of shares, contracts, or lots traded during a specific time period. In equities, it is the number of shares exchanged; in futures and forex, it reflects contracts or tick volume. Every trade requires both a buyer and a seller, but volume measures how active and aggressive that interaction is.
High volume means strong interest and participation. Low volume means lack of commitment. Price can move on low volume, but such moves are fragile and often reverse. Sustainable trends almost always require expanding volume.
In simple terms:
Price shows direction
Volume shows strength
2. Why Volume Is More Important Than Indicators
Most indicators—RSI, MACD, moving averages—are derived from price. Volume, however, is raw market data, not a derivative. Institutions, hedge funds, and smart money cannot hide their volume. They may disguise orders, but accumulation and distribution leave volume footprints.
Retail traders often get trapped because they trade patterns without volume confirmation. A breakout without volume is usually a false breakout. A reversal without volume is often a temporary pullback. Volume filters noise and exposes real intent.
3. Volume Confirms Trends
A healthy trend must be supported by volume.
In an uptrend, volume should increase during upward moves and decrease during pullbacks.
In a downtrend, volume should expand on declines and contract on rallies.
If price makes higher highs but volume declines, it signals weak participation—a warning of trend exhaustion. This phenomenon is known as volume divergence, and it often appears near major tops and bottoms.
Trend traders use volume to decide whether to hold, add, or exit positions. When volume confirms trend direction, staying in the trade becomes statistically favorable.
4. Volume and Breakouts
Breakouts are one of the most traded setups, but also one of the most failed—mainly because traders ignore volume.
A true breakout requires:
Expansion in volume
Wide-range candles
Acceptance above resistance or below support
If price breaks resistance on low volume, it suggests lack of institutional interest. Such breakouts are often stop-hunts designed to trap retail traders. High-volume breakouts, on the other hand, indicate fresh money entering the market, increasing the probability of follow-through.
Professional traders often wait for volume confirmation before entering, even if it means missing the first few points.
5. Volume at Support and Resistance
Support and resistance levels gain significance when combined with volume. When price approaches support:
Rising volume suggests strong buying interest
Falling volume suggests buyers are weak
At resistance:
High volume with rejection indicates distribution
High volume with breakout indicates absorption of supply
Institutions accumulate positions quietly near support with moderate volume, then push price higher with explosive volume. Similarly, they distribute near resistance before major declines. Observing volume behavior at key levels reveals who is in control—buyers or sellers.
6. Accumulation and Distribution
One of the most powerful uses of volume is identifying accumulation and distribution phases.
Accumulation occurs when large players buy gradually without moving price much. Volume increases, but price stays in a range.
Distribution occurs when institutions sell into retail buying enthusiasm. Volume remains high, but upside progress stalls.
These phases often precede major moves. Traders who recognize accumulation early can enter before breakouts. Those who spot distribution can exit before crashes. Volume is the only reliable tool to detect these silent transitions.
7. Volume Indicators and Tools
While raw volume itself is powerful, several indicators help interpret it:
Volume Moving Average: Compares current volume to historical norms.
On-Balance Volume (OBV): Tracks cumulative buying and selling pressure.
Volume Profile: Shows where trading activity is concentrated across price levels.
VWAP (Volume Weighted Average Price): Used heavily by institutions for intraday bias.
Accumulation/Distribution Line: Measures whether volume favors buyers or sellers.
These tools don’t replace price action—they enhance it. The best traders combine volume analysis with structure, not indicators alone.
8. Volume in Intraday Trading
In intraday trading, volume is even more critical. The first hour of trading often sets the tone for the day. High volume during opening range breakouts signals institutional participation. Low volume midday moves are often fake and best avoided.
Scalpers use volume spikes to enter momentum trades. Intraday reversals are most reliable when they occur with climactic volume, indicating exhaustion. Without volume, intraday setups lack edge.
9. Volume in Different Markets
Volume behaves differently across markets:
Equities: Actual traded volume is transparent and highly reliable.
Futures: Centralized volume makes it ideal for volume analysis.
Forex: Uses tick volume, which still correlates strongly with real activity.
Crypto: Volume is crucial due to manipulation; fake moves often occur on thin volume.
Regardless of market, the principle remains the same: strong moves require strong participation.
10. Common Mistakes Traders Make with Volume
Many traders misunderstand volume by:
Using volume alone without context
Ignoring volume at key levels
Overtrading low-volume markets
Assuming high volume is always bullish or bearish
Volume must always be read relative to price action and market structure. It is not directional by itself—it explains why price is moving.
11. Volume and Risk Management
Volume also helps with risk management. Trades entered on high volume have better liquidity, tighter spreads, and smoother execution. Low-volume trades increase slippage and false signals. Professionals prefer trading instruments with consistent, healthy volume.
Stop-loss placement improves when volume is considered. Stops placed beyond high-volume nodes are less likely to be hunted.
12. The Institutional Perspective
Institutions think in terms of liquidity, not indicators. Volume tells them where liquidity exists. Retail traders who learn volume analysis begin to think like institutions—waiting for confirmation, avoiding thin markets, and aligning with dominant flows.
Volume is the bridge between retail charts and institutional reality.
Conclusion
Trading with volume transforms how you see the market. It shifts your focus from prediction to confirmation, from hope to evidence. Price can lie, patterns can fail, and indicators can lag—but volume reveals participation, strength, and intent.
If price is the story, volume is the truth behind it.
Traders who master volume stop chasing moves and start positioning alongside smart money. In the long run, volume is not just an indicator—it is a strategic edge that separates consistent traders from emotional gamblers.

Smart Money Secrets: How Institutions Really Control the Markets1. Smart Money Thinks in Liquidity, Not Indicators
Retail traders focus on indicators like RSI, MACD, or moving averages. Smart money focuses on liquidity—where orders are resting.
Liquidity exists at:
Previous highs and lows
Trendline breaks
Obvious support and resistance
Round numbers (100, 500, 1000)
Stop-loss clusters
Institutions need large volumes to enter or exit positions. They cannot buy or sell all at once without moving price against themselves. So instead, they hunt liquidity, pushing price toward areas where retail stops and pending orders sit.
That’s why price often:
Breaks resistance, then reverses
Sweeps a low before rallying
Triggers stop-losses before the real move
These are not random moves. They are liquidity grabs.
2. Accumulation and Distribution Are the Core Game
Smart money operates in phases, not single trades.
Accumulation Phase
Institutions accumulate positions when:
Price is moving sideways
Volatility is low
Sentiment is negative or boring
Retail interest is minimal
This phase often looks like a “range” or “consolidation.” Retail traders get chopped, frustrated, and exit—while smart money quietly builds positions.
Expansion (Markup or Markdown)
Once enough positions are accumulated:
Price breaks out aggressively
Volume expands
News suddenly turns positive (or negative)
Retail traders chase the move
Distribution Phase
At the top or bottom:
Price again moves sideways
Volatility compresses
Retail believes the trend will continue forever
This is where institutions offload positions to emotional traders.
Smart money buys boredom and sells excitement.
3. Smart Money Uses Time as a Weapon
Retail traders want quick profits. Smart money uses time to exhaust them.
Institutions are patient. They can hold positions for weeks or months. During this time:
Price may move slowly or erratically
Fake breakouts trap traders
Multiple stop hunts occur
Most retail traders quit right before the real move begins.
Time-based manipulation is why:
Breakouts fail repeatedly before succeeding
Strong moves come after long consolidation
Trends feel “obvious” only after they’ve already run
4. News Follows Smart Money, Not the Other Way Around
A major secret is this: smart money positions itself before news becomes public.
Institutions don’t wait for:
Earnings announcements
Rate decisions
Economic data
Instead, they anticipate outcomes and use news as a liquidity event.
That’s why you often see:
Price moving before news
“Good news” causing a market drop
“Bad news” triggering rallies
News gives smart money an excuse to:
Trigger stops
Exit positions
Reverse trends
Retail traders react to headlines. Smart money uses them.
5. False Breakouts Are a Feature, Not a Bug
One of the most painful experiences for retail traders is the false breakout. For smart money, false breakouts are essential tools.
They serve three purposes:
Trigger stop-losses
Induce breakout traders to enter
Provide liquidity for institutional entries
When price breaks a key level and quickly returns, it often signals:
Smart money has completed accumulation
Liquidity has been collected
The real move is coming in the opposite direction
This is why experienced traders wait for confirmation after the trap, not the breakout itself.
6. Smart Money Respects Market Structure
Institutions operate within market structure, not random entries.
Key structure concepts include:
Higher highs and higher lows (bullish control)
Lower highs and lower lows (bearish control)
Break of structure (trend shift)
Change of character (early reversal signal)
When structure breaks:
Smart money adapts
Positions are reduced, hedged, or reversed
Retail traders often hold losing positions hoping structure will “come back.” Institutions exit without emotion.
7. Risk Management Is the Ultimate Edge
Smart money does not aim for perfection—it aims for survival and consistency.
Core principles:
Small risk per trade
Asymmetric reward (small risk, large upside)
Accepting losses as business expenses
Never being emotionally attached to a bias
Institutions win not because they predict every move, but because their losers are controlled and their winners are allowed to run.
Retail traders often do the opposite.
8. Smart Money Thinks in Probabilities, Not Certainty
There is no “sure shot” trade in smart money thinking.
Instead:
Every trade is a probability bet
Bias is adjusted as new data appears
Flexibility is valued over ego
Institutions are comfortable being wrong quickly. Retail traders try to be right at all costs.
9. Retail Sentiment Is a Contrarian Indicator
One of the oldest smart money secrets is this:
When the majority is confident, risk is highest.
Institutions monitor:
Retail positioning
Social media sentiment
Option flows
Crowd behavior
Extreme optimism or pessimism often marks:
Market tops
Market bottoms
Smart money doesn’t follow the crowd—it feeds on it.
10. The Real Secret: Discipline Over Intelligence
The final truth is uncomfortable: smart money is not always smarter—it is more disciplined.
They have:
Rules they don’t break
Systems they trust
Emotions removed from execution
Most retail traders fail not because of lack of knowledge, but because of:
Overtrading
Revenge trading
Ignoring risk
Emotional decision-making
Smart money wins because it treats trading as a process, not a thrill.
Conclusion
Smart money secrets are not hidden in complex indicators or secret formulas. They are visible in price behavior, liquidity, structure, and human psychology. Institutions exploit impatience, emotion, and predictability. Retail traders who learn to think like smart money—waiting, observing, managing risk, and respecting structure—move from being liquidity providers to informed participants.
The market is not against you—but it rewards those who stop reacting and start thinking like capital, not crowds.

BTC 4H Update
Price still trapped in a descending structure.
Lower highs intact, trendline resistance holding.
🔻 Rejection near 71.6k
🧱 Major supply: 85.9k – 90.4k
🛡 Key support: 59.9k
As long as BTC stays below the trendline, rallies look like relief bounces.
Break above = momentum shift.
Lose 60k = next leg down.

Short to Swing Investment Stock - GMR POWER**GMR POWER - Fibonacci Retracement Play | Weekly Setup**
📊 **Long-Term Accumulation Zone with Multiple Entry Strategies**
**Technical Setup:**
✅ Trading in Fibonacci retracement zone (0.382-0.618)
✅ Consolidating after strong base formation from 60-70 levels
✅ Weekly timeframe showing accumulation pattern
✅ RSI neutral with room for upside momentum
**Current Price:** 109.58
**Entry Strategies:**
**Aggressive Buy:** Current levels (109-115)
- For momentum traders
- Quick move possible to 126+
**Conservative Buy:** Above 126.60 breakout
- Confirmation entry
- Lower risk, higher conviction
**Fibonacci Levels:**
- 0.382: 119.54 (minor resistance)
- 0.5: 128.87 (key breakout level)
- 0.618: 138.19 (major resistance)
- 0.786: 151.46 (swing target)
**Targets:**
- **Grand Swing Target:** 158.70
- **Short to Long-Term:** 189-217 zone
**Support/SL:** Below 98.71 (weekly candle close basis)
**Strategy:** Ideal for patient investors. Accumulate in current zone or wait for 126+ breakout. Weekly structure suggests strong upside potential once consolidation completes.
**Disclaimer:** This is for educational purposes only and not financial advice. Do your own research and consult a financial advisor before investing. Trade at your own risk.

Buy on Dips - SCHNEIDER Analysis**SCHNEIDER - Buy on Dips | Strong Demand Zone + Triple Bottom**
📊 **Strong Price Action at Key Demand Zone**
Triple bottom formation at critical support - classic accumulation pattern:
**Why Buy on Dips:**
✅ Triple bottom shows institutional accumulation - **Demand Zone:** 561-600 (tested 3x since May 2025)
✅ Price defending demand zone with conviction
✅ Strong bounce from support - buyers stepping in
✅ All major MAs trending upward
**Targets:**
- **Tgt 1:** 862 (+12%) / - **Tgt 2:** 920 (+20%) / - **Tgt 3:** 1,000 (+30%)
**Strategy:**
Accumulate on any dip towards 730-750 zone. Strong hands at support making this a low-risk, high-reward setup.
**SL:** Below 730 (weekly close)
**Disclaimer:** This is for educational purposes only and not financial advice.
Always do your own research and consult with a financial advisor before making any investment decisions.
Trade at your own risk.

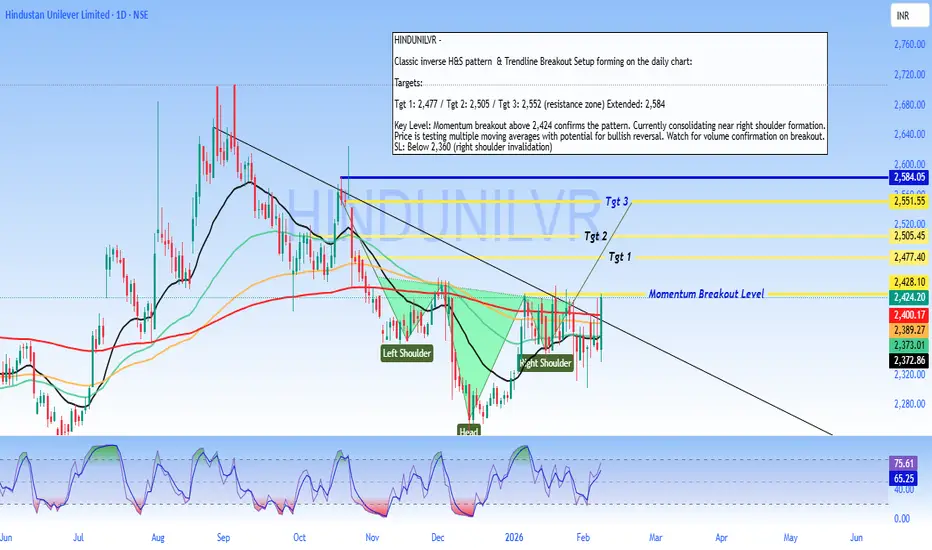
HINDUNILVR - Inverse Head & Shoulders & Trendline Breakout Setup**HINDUNILVR - Inverse Head & Shoulders & Trendline Breakout Setup**
Classic inverse H&S pattern forming on the daily chart:
- **Head:** ~2,280 (Dec-Jan bottom)
- **Shoulders:** Left shoulder at ~2,370 (Nov), Right shoulder at ~2,373 (current)
- **Neckline/Breakout Level:** 2,424
**Targets:**
- **Tgt 1:** 2,477
- **Tgt 2:** 2,505
- **Tgt 3:** 2,552 (resistance zone)
- **Extended:** 2,584
**Key Level:** Momentum breakout above 2,424 confirms the pattern. Currently consolidating near right shoulder formation.
Price is testing multiple moving averages with potential for bullish reversal. Watch for volume confirmation on breakout.
**SL:** Below 2,360 (right shoulder invalidation)
Feel free to adjust the stop-loss or add your own risk management preferences!
Disclaimer: This is for educational purposes only and not financial advice. Always do your own research and consult with a financial advisor before making any investment decisions. Trade at your own risk.
I think chart is telling somethingUnderline asset is above 50,100,200 days MA.
Supertrend is active.
RSI is above 50
MACD is above zero line.
Volume breakout at 50 days MA.

ETH/USD Daily — Support Bounce Setup in a Strong Downtrend
Chart Analysis:
Market Structure:
ETH is clearly in a bearish trend on the daily timeframe. Lower highs and lower lows are intact after a sharp rejection from the major supply zone around 3,300–3,400 (yellow zone).
Impulsive Sell-Off:
The recent move down is strong and aggressive, suggesting capitulation-style selling rather than a slow grind. This often precedes at least a technical relief bounce.
Key Support Zone (Red): ~1,900–2,000
Price has tapped into a well-defined demand/support area, where buyers previously stepped in. The long lower wicks here hint at buying interest and absorption.
Proposed Entry:
The marked entry is based on a support reaction, not a trend reversal. This is a counter-trend long, so it’s tactical, not positional.
Target Zone (Green): ~2,450–2,550
This zone aligns with:
Prior structure support → resistance flip
Likely liquidity resting above
Mean reversion after an extended drop
Bias & Expectations:
Short-term: Bullish relief bounce toward the green zone
Medium-term: Still bearish unless ETH reclaims and holds above ~2,600–2,700
Expect high volatility—clean V-shaped recoveries are rare in this context
Risk Note:
If price loses the 1,900 support decisively, the setup is invalidated and opens the door for continuation toward lower psychological levels.
📌 Summary:
This chart shows a high-risk, counter-trend bounce play off major daily support, targeting a logical resistance zone above. Good for disciplined traders, not for blind bottom-catching.

Bearish Continuation Setup After Dead-Cat Bounce (1H)
What the chart is saying:
Clear bearish trend: Price has been making lower highs and lower lows. The broader structure is decisively bearish.
Range breakdown: The blue box shows a consolidation range that broke to the downside, confirming continuation rather than accumulation.
Strong sell-off into demand: Price aggressively dropped into the red support zone (~62k–64k), where buyers stepped in hard, creating a sharp bounce.
Relief rally, not reversal: The current move up is a retracement, not a trend change. Momentum looks corrective, not impulsive.
Key resistance zone (~71k–72k):
This green area is previous support turned resistance
It aligns with the breakdown level → classic short opportunity
Planned trade idea (as drawn):
Entry: Into resistance (green zone)
Invalidation: Clean acceptance above resistance
Target: Prior support / liquidity pool around 63k
R:R: Favorable if rejection confirms
Bias:
📉 Bearish below resistance
Only a strong breakout + hold above 72k would weaken the short thesis
What to watch next:
Rejection wicks, bearish engulfing, or momentum divergence at resistance
Volume drying up on the push into the green zone
Failure to reclaim broken structure
⚠️ This setup assumes trend continuation, not a bottom. Until structure flips, rallies are sell-the-rip candidates.

BTCUSD Daily – Bearish Breakdown & Sell-the-Retests Setup
Here’s what the chart is saying, clean and to the point:
Market Structure
Clear distribution → breakdown sequence on the daily.
Price topped near the mid-90Ks, rolled over, and lost the 83–84K demand zone (former support marked in blue).
That loss flipped market structure firmly bearish.
Key Levels
Major breakdown level: ~83–84K (prior demand → resistance)
Supply / entry zone: ~72–74K (blue zone labeled “entry”)
Current support: ~67.4K (thin blue line)
Primary target: ~60–62K (grey demand zone)
Price Action Logic
The vertical sell-off into ~67K suggests impulsive bearish strength, not exhaustion.
The projected path shows a dead-cat bounce / consolidation into ~72–74K.
That zone aligns with:
Prior consolidation
Bearish retest logic
Likely supply from trapped longs
Trade Thesis (as illustrated)
Bias: Short
Entry idea: Sell a rejection in the 72–74K zone
Invalidation: Strong daily close back above ~75K
Target: 60–62K demand (first meaningful higher-timeframe support)
Big Picture
Unless BTC reclaims the 80K+ region quickly, this chart favors continuation lower, not a V-shaped recovery. The structure says rallies are for selling, not buying.

POWERGRID: Trend Reversal Indicators & Key LevelsThe stock of POWERGRID is showing signs of a potential trend reversal after an extended downtrend. Several technical factors across multiple timeframes support this shift in momentum.
The stock has recently managed to close above the 200-day EMA, a level widely monitored for assessing long‑term trend shifts. A golden crossover—where a shorter‑term moving average crosses above a longer‑term one—has also taken place.
This movement has been supported by strong trading volume, adding weight to the possibility of a positive structural change.
A triangle breakout has been observed on the chart, indicating that price has moved decisively out of a prolonged consolidation pattern.
Breakouts supported by volume are often interpreted as signals of improving momentum.
On the weekly timeframe, a bullish MACD crossover has been confirmed.
Weekly MACD signals tend to carry stronger implications for medium‑term momentum, suggesting sustained upward interest.
The RSI has approached the upper band, reflecting strong momentum.
However, this positioning also indicates the possibility of a short‑term pullback or cooling phase.
A potential supply zone around ₹318 may act as an area of temporary resistance.
Key Levels to Monitor:
Possible Supply / Resistance Zone: ₹318
Major Resistance Level: ₹354 (may be tested after consolidation or a short‑term pullback)
Support Zone: Around ₹250 (critical reference level for this setup)
Disclaimer: This analysis is intended solely for educational and informational purposes. It does not constitute financial advice or a recommendation to buy, sell, or hold any security. Investors should conduct their own research and consult a licensed financial advisor before making investment decisions.

XAUUSD (H2) – Liam's AnalysisXAUUSD (H2) – Liam View
Rally into supply | Volatility risk rising
Gold is rebounding from the 4550–4600 demand base, but the broader H2 structure still points to a selling environment. The current move higher looks corrective, driven by short covering and liquidity rotation rather than a confirmed trend reversal.
From the chart, price is rotating back toward 4900–5030, a zone where previous distribution and liquidity rest. Unless price can accept above this area, rallies should be treated as selling opportunities, not breakout confirmation.
Key technical zones
Major selling zone: 5536 – 5580 (HTF supply)
Near-term reaction zone: 5000 – 5030
Key demand / base: 4550 – 4600
Intraday support: ~4730
Market context
Recent US political headlines and institutional reviews add another layer of headline-driven volatility, increasing the risk of sharp swings and liquidity sweeps. In such conditions, gold often reacts erratically intraday, but higher-timeframe structure tends to reassert itself once the noise fades.
Outlook
As long as price stays below 5030, the bias remains sell-side dominant.
Failure to hold above 4730 would reopen downside risk toward the demand base.
Only a clean H2 acceptance above 5030 → 5100 would neutralize the bearish structure.
Execution note
Avoid chasing momentum in news-driven sessions.
Let price come to levels. Trade the reaction, not the headlines.
— Liam

Part 2 Intraday Institutional Trading What Moves Option Premium?
Premium depends on:
Underlying price movement
Time left to expiry
Volatility (IV)
Interest rates
Demand & supply
If markets move aggressively, option premiums rise quickly.

Part 1 Intraday Institutional Trading ITM, ATM, OTM Options
These describe where the current price is compared to strike price.
a) ITM – In The Money
Call: Current price > Strike
Put: Current price < Strike
ITM options cost more.
b) ATM – At The Money
Current price ≈ Strike price
Most volatile and liquid.
c) OTM – Out of The Money
Call: Current price < Strike
Put: Current price > Strike
OTM is cheaper but risky; goes to zero quickly on expiry.

ETH BearishWhile the market is currently in a strong bearish phase and sentiment is driven by fear, price action suggests a long-term recovery ahead. I expect 2026 to form a macro bottom, 2027 to be a consolidation year, and 2028 to initiate the next major bullish cycle in crypto.

Part 5 Advance Trading Strategies Why Do Options Have Time Decay? (Theta)
Options lose value as expiry approaches.
This is called Theta Decay.
Example:
Monday premium: ₹100
Thursday premium: ₹20
Expiry day: ₹0
This happens because time is part of the option’s value. If market doesn’t move, buyer loses money; seller gains.

Part 4 Technical Analysis Vs. Institutional Option TradingPut Options (PE) Explained
Put = Right to sell
You buy a put when you expect the price to go down.
Loss is limited to premium paid.
Profit can rise significantly in sharp downtrends.
Example:
If Nifty is at 22,000 and you buy 21,900 PE, you are expecting Nifty to fall below 21,900.

RELIANCE 1 Month Time Frame 📌 Latest Trading Price (market close Feb 6 2026): ₹1,450.85 on NSE/BSE.
📈 Key Resistance Zones (Upside)
₹1,455–₹1,460 — immediate technical resistance (pivot cluster)
₹1,470–₹1,480 — next barrier above recent highs seen in early Feb price swings
~₹1,500 — psychological resistance (round number) — watch if momentum sustains
Bullish scenario: Break and hold above ~₹1,460–₹1,470 with decent volume could point toward ₹1,480–₹1,500 next.
📉 Key Support Levels (Downside)
₹1,440–₹1,442 — first support cluster from pivots
₹1,430–₹1,435 — deeper near-term support if current level breaks
₹1,380–₹1,390 — broader monthly lower support (recent swing lows)
Bearish risk: A sustained close below ₹1,430 may shift bias lower toward ₹1,380.
📌 Quick Practical Summary
Levels to watch this month (chart/time-frame sensitive):
• Buy/Support:
₹1,440–₹1,442 (first line)
₹1,430–₹1,435 (next support)
₹1,380–₹1,390 (deeper zone)
• Sell/Resistance:
₹1,455–₹1,460 (initial resistance)
₹1,470–₹1,480 (secondary area)
₹1,500+ if strong break above

Bitcoin - Rising Wedge - Go Short!Bitcoin seems to be breaking down from this rising wedge that it has been trading in the past few hours. Once it get's broken, expecting it to flush to the downside pretty quickly.
