Gold Analysis & Trading Strategy | February 2-3✅ From the 4-hour timeframe, after forming a trend reversal at the 5596 high, gold has established a clear bearish alignment in the moving average system. Price consecutively broke below the Bollinger middle and lower bands, forming an accelerated downward structure. After finding its first clear stabilization near 4402, the market has entered a phase of technical recovery after an oversold condition. However, MA10 and MA20 remain sharply pressing downward, indicating that this rebound is more of a correction within the trend, rather than a true reversal.
✅ On the 1-hour timeframe, after bottoming at 4402, price formed a step-like rebound. However, the rebound has consistently been capped by moving averages, with multiple rejections near MA20, forming a weak consolidation rebound structure. The Bollinger Bands have begun to contract, suggesting that bearish momentum has eased into a consolidation phase, but there is still no clear sign of bullish control.
✅ Combining both timeframes, the market is currently in an oversold corrective consolidation within a broader bearish trend. As long as price fails to reclaim and hold above 5000, the overall structure remains defined as a post-top corrective cycle. The current movement appears more like preparation for the next directional move rather than a trend reversal.
🔴 Resistance: 4880–4950
🟢 Support: 4520–4580
✅ Trading Strategy Reference:
At this stage, the primary approach is to sell on rebounds, with light long positions considered only near lower support zones. Patience is required while waiting for key resistance levels.
🔰 Short Strategy (Sell on Rebound)
👉 Entry Zone: 4880–4920, scale into short positions
🎯 Target 1: 4700
🎯 Target 2: 4550
🎯 Extended Target: 4400
📍 Logic:
This area is a confluence resistance zone formed by the 4-hour moving averages and previous structural breakdown levels. Rebounds into this region are likely to face renewed selling pressure.
🔰 Long Strategy (Oversold Rebound)
👉 Entry Zone: 4520–4580, light long positions only
🎯 Target 1: 4700
🎯 Target 2: 4850
🎯 Extended Target: 4950
📍 Logic:
This zone aligns with previous lows and the lower Bollinger Band, creating a technical support confluence suitable for a rebound — but only as a corrective move.
✅ Risk Control Reminders
👉 Do not chase rebounds; patiently wait for resistance levels
👉 Long positions are for corrective rebounds only and should be light in size
👉 Short positions align with the broader trend and offer better potential
👉 In extreme volatility, strict stop-loss discipline is essential.
X-indicator

#XAGUSD⚡ Silver – What Happens Next? ⚡
🥈 Silver began a new impulsive cycle in April 2025, with its 1st wave in October. After a flat corrective 2nd wave (C failure), it surged into a powerful 3rd wave, peaking at $84 on 29 Dec 2025.
📈 The 4th wave followed as another flat correction with strong buying pressure, before Silver entered its largest 5th wave, hitting a record high of $121 on 29 Jan 2026.
🚨 But here’s the critical signal: the entire 5th wave was retraced in just one day. In Elliott Wave terms, this invalidates the continuation of the bull run.
📉 Conclusion:
• The $121 peak marks a long-term high.
• Silver is likely to revert to its true value below $60 by mid-March 2026.

ABCapital -> A Clear opportunity.Currently playing larger wave 3.
Played all earlier sub waves perfectly.
Currently playing sub wave C of 4 of 5 of 3.
Well aligned with fib ratio's.
Also clear divergence in RSI.
Minimum target of 335/-(Around 5%) is very much possible in short term.

RSI OVER SOLDHi
Looking good for
Rain over sold and stock already discounted on cigarette tax news
Target of 384 in 3 months time frame
Target of 435 in 6 months time frame
Target of 482 in 15 months time frame
Tax on cigarette will pass to consumer, no impact on profit

Repeated Kumo Breakdowns on NIFTY – 2H LTFThe budget-day price action has resulted in yet another Kumo breakdown on the NIFTY 2H timeframe.
Does this add more weight to the already active bears ?
Or is this an opportunity for bulls to attempt base formation near potential bearish exhaustion?
Let’s evaluate the structure.
What would materially improve the odds for Bulls?
- A decisive 2H close above the 0.786 Fibonacci retracement of the budget-day fall.
This would open up the possibility of price action retesting the Kumo bottom.
- A decisive 2H close above the Kumo break candle, indicating improving bullish strength and the ability to penetrate deeper into the cloud.
- A decisive 2H close above the Kumo top, which would signal structural negation of the current Kumo breakdown.
What would materially improve the odds for Bears?
- A decisive 2H close below the 0.618–0.786 Fibonacci zone, preferably with upper wicks, indicating rejection from resistance.
- A decisive 2H close below both Tenkan and Kijun, which are already positioned below the Kumo bottom.
- A decisive 2H close below the recent 2H swing low, confirming continuation beyond equilibrium.
Price action is once again at an important decision-making zone.
Let’s wait and watch how the structure resolves.
This is an educational market-structure analysis and not trading advice.

BTCUSD Weekly Close Decides the Next Major Move 83,500 Is strongBTCUSD is at a critical decision zone.
A weekly close above 83,500 can trigger a short-term relief rally towards the 0.618 Fibonacci retracement.
However, the 106,300 – 106,800 region remains a major supply and profit-booking zone.
Timeframe Context:
This analysis is based on the daily structure with weekly candle confirmation.
Key Observations:
• 83,500 is acting as a decisive support/resistance flip level
• A weekly close above 83,500 increases the probability of a move towards the 0.618 retracement zone
• The 106,300 – 106,800 area aligns with 0.618 Fibonacci + historical supply, making it a high-risk zone for fresh longs
Trading Insight:
Any upside from current levels should be treated as a relief rally, not a confirmed bullish continuation.
Strong rejection or bearish confirmation near the 0.618 zone can lead to a larger corrective move or crash.
Conclusion:
Trade the move, respect the levels, and wait for confirmation —
levels lead, price reacts.
Keep MRPL on your WatchlistMRPL forming a Symmetrical Triangle Breakout Setup📈
✔️RSI above 65 and rising
✔️Trading above EMA50
✔️Volume increasing
✔️+11 months of consolidation
enter after breakout confirmation
Disc: not a recommendation. DYOR

#US100📈 US100 Technical Outlook – Corrective Phase in Play
After completing its 5-wave impulsive structure, US100 has entered its corrective phase.
• The A wave began in October 2025 and concluded on 21 Nov 2025.
• The index then started rising in its B wave, retracing more than 61.8%, which signals the development of a flat correction.
🔹 Structure of the B Wave
• The A sub-wave unfolded in 5 smaller waves, indicating a zig-zag formation.
• Since A retraced less than 61.8%, the current rise is part of the C sub-wave.
• A parallel channel projection suggests the C wave could extend towards 26,800–27,000.
⏳ Timing Consideration
• The A sub-wave lasted 13 days.
• By proportion, the C wave could stretch up to 21 days, implying a potential 2-week bullish run.
⚠️ Risk Management
A prudent stop-loss around 25,000 is advisable while tracking this move.

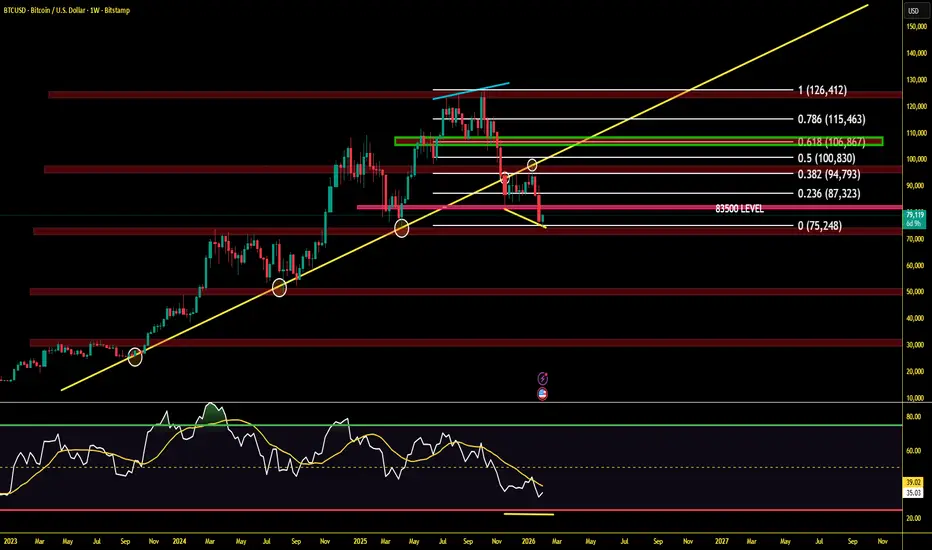
BTCUSD Monthly Outlook -Potential Pullback - 0.618 B4 Major Move🔴This analysis is based on the Monthly timeframe, with Fibonacci drawn from the recent swing high to the current low.
The price is currently in a corrective phase, and based on its structure and Fibonacci alignment, there is a high probability of a retracement toward the 0.618 level before the next major directional move.
📊 Key Levels & Expectations
0.618 Fibonacci zone: 105,400 – 105,800
This zone aligns with a strong historical resistance/supply area
Price may attempt a corrective pullback into this region (marked with the small red arrow)
This move should be viewed as a retracement, rather than a trend reversal.
⚠️ High-Risk Area – Not a Buy Zone
Even if the price reaches the 0.618 resistance zone, the overall structure remains weak unless there is: a strong bullish monthly close, Clear volume expansion, and acceptance above the resistance. Without these confirmations, the 0.618 zone is expected to act as a sell-on-strength area.
🩸 Downside Scenario
If rejection occurs from 105.4K – 105.8K, a larger downside move (marked by the big red arrow) becomes highly probable.
Key support to watch:
81,100 – 83,500 (critical structure support)
A break and close below this zone can accelerate bearish momentum.
🧠 Trading Perspective
This is a patience-based market:
Short-term upside is possible
But risk remains elevated
A safer approach is waiting for confirmation at key levels
📌 This idea is shared for educational and market-structure discussion only.
🔔 Note
I’ll be actively sharing structured, level-based BTC analysis here going forward.
Follow if you prefer probability-based setups over emotional bias.

EUR/USDEURUSD experienced a clean intraday sell-side liquidity sweep, breaking below the prior range low with strong bearish displacement, signaling a stop-driven move rather than organic trend continuation.
Price tagged the lower liquidity pool, printed a sharp rejection wick, and immediately delivered a V-shaped reaction, indicating short-term exhaustion and responsive buying at discount.
Market Structure Read
Range low taken with momentum expansion
Stops flushed, creating temporary price inefficiency
Immediate bullish reaction suggests sell pressure is weakening, not building
Current Zone Logic
Price is reacting from a deep discount zone, where short-term participants are covering and early longs are stepping in
The marked green box represents a mean-reversion / mitigation zone, not a trend-reversal confirmation yet

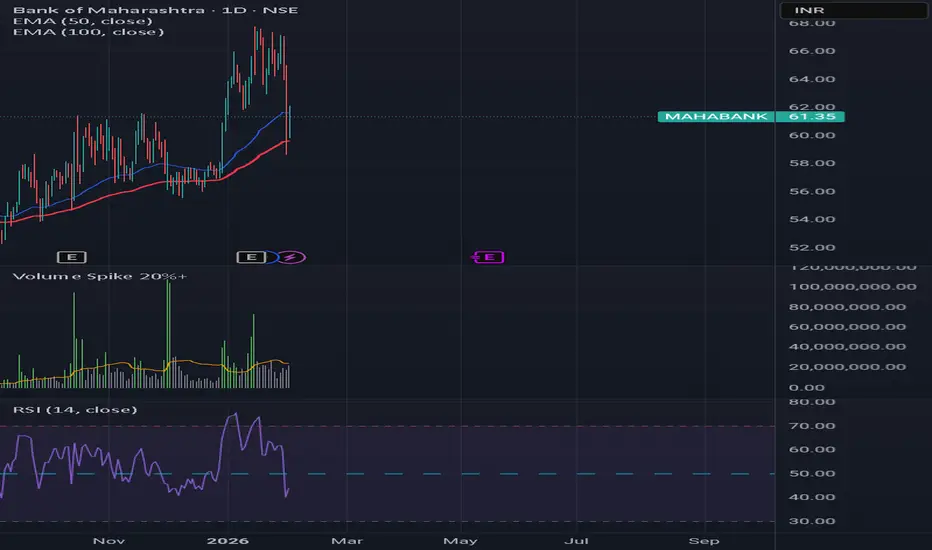
MAHABANKShowing support at 8t 50 days MA
RSI bounced back from its lower level (39 to 43) and becoming stronger.
MACD on monthly chart indicates share prices is preparing for longterm bet.
Gold (XAUUSD) – Short View 1 hour ChartGold has bounced from the 4,540–4,560 demand zone, hinting at a short-term bottom.
As long as price holds above this support, a relief move is possible.
Next upside targets:
➡️ 4,850 – 4,900 (minor resistance)
➡️ 5,000 – 5,100 (key supply zone)
Risk:
Below 4,540, downside can reopen toward 4,400.
Overall: Short-term bounce, trend still cautious until 5,100 is reclaimed.

Gold bounced from 100 MAGold bounced back from it's 100 MA. Recovery could be seen faster than Silver.

XAUUSD Might start profit booking.FOMC Today might move a lot during NY. XAUUSD Might start profit booking.

What happens when major indices (Nifty & BankNifty) align with What happens when major indices (Nifty & BankNifty) align with each other not only in terms of market structure but also in terms of trend direction & timing ?
Well, we end up with high-probability trade environments that allows for asymmetrical risk-to-reward
Note - While the 15-minute chart highlights the broader alignment, the timing and rejection behavior becomes much clearer when drilling down to the 5-minute structure

Xauusd 2 feb 2026Look for 4635.90 it will act as a pivot point keep Eyes on that point it will move very fast from that point.
Yes my descriptions are short but at the point thanks thanks a lot.

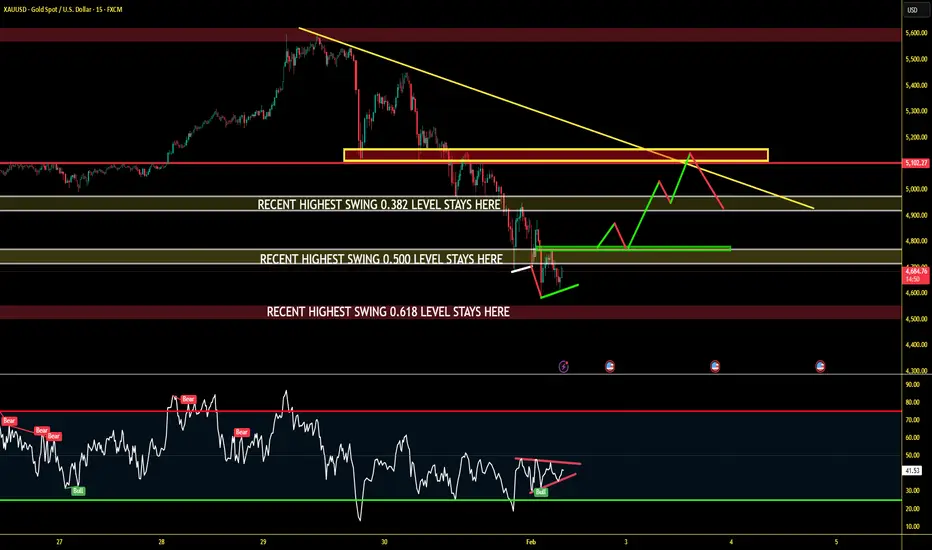
XAUUSD 15M – Bullish Reversal Setup Explained Above 4700 Level After a strong sell-off, Gold is now reacting near a high-probability demand zone.
🔍 My Analysis & Thinking:
• Price has reached the 61.8% Fibonacci retracement of the recent major swing
• RSI (15 Min) is showing a clear bullish divergence
• Selling momentum is weakening after the big fall
• Structure suggests a potential higher low formation
📈 Trade Plan (IF–THEN Logic):
✅ IF price breaks above 4700 (yellow resistance zone)
✅ AND gives a clean retest + bullish confirmation
➡️ THEN BUY
🎯 Upside Targets:
4800 , 4900, 5000 zone (major supply & trendline confluence)
🛑 Invalidation:
Breakdown below 61.8% (4500 -4550 level ) support with strong momentum
⚠️ This is a patience trade — confirmation > prediction.
📊 KEY LEVELS TO MENTION IN CAPTION
Support Zone:
🔹 61.8% Fib – Major demand area
Breakout Level:
🟡 4700 (Yellow Rectangle)
Targets:
🎯 4800 → 4900 → 5000
Bias:
🔄 Short-term bullish after confirmation
XAUUSD 15M – Bullish Reversal Setup Explained Above 4700 Level
#eicher motor back with recovery on daily chart#eicher motor back with recovery on daily chart frame
Add above 6942 for 7613 (10%)
stoploss below 6699 for traders

Gold Breaks Structure: Bears in Full Control1️⃣ Market Structure (Smart Money Concept)
The uptrend that started mid-January has clearly ended.
Multiple BOS (Break of Structure) to the downside confirm a trend reversal.
Repeated ChoCH near the top shows distribution by smart money.
Recent impulsive bearish leg = strong institutional selling, not retail noise.
📌 Conclusion: Market structure is now bearish.
2️⃣ Price Action
Sharp impulsive bearish candles with minimal retracements → sellers in control.
Demand zones are getting violated and flipped into supply.
No bullish engulfing or accumulation pattern yet.
Last candle closed near the lows, indicating no buyer absorption.
📌 Conclusion: Bearish continuation likely.
3️⃣ Moving Averages (Dynamic Resistance)
Price is trading below all key EMAs (fast, mid, slow).
EMAs have bearishly crossed and are fanning downward.
Pullbacks are respecting EMA resistance perfectly.
📌 Sell zone:
4,600 – 4,650 (EMA + structure confluence)
4️⃣ Volume Analysis
Breakdown happened with expanding volume → confirmation.
Selling volume dominates buying volume.
No volume divergence yet → trend still healthy.
📌 Conclusion: Bears have strength and commitment.
5️⃣ Key Levels (High Probability Zones)
🔴 Resistance (Sell on Rally)
4,650 – 4,600 → Broken structure + EMA zone
4,720 – 4,760 → Previous demand → supply flip
🟢 Support / Targets
4,540 → Intraday reaction zone
4,480 → Liquidity pocket
4,402 → Major swing low & HTF support
4,286 → Weekly demand (if panic selling continues)
6️⃣ Liquidity & Session Bias
Equal lows (W) have been taken out → liquidity grab completed.
After liquidity sweep, price continued lower → true bearish intent.
Expect London/NY pullback → sell continuation pattern.
7️⃣ Fibonacci Perspective
Current pullbacks are holding below 38.2% retracement → weak bulls.
Strong bearish trends usually respect 23.6% – 38.2% only.
Deeper retracement (>50%) needed to consider bullish reversal.
8️⃣ Trade Bias & Scenarios
✅ Primary Scenario (High Probability)
Sell on pullback below 4,650
Targets:
TP1: 4,540
TP2: 4,480
TP3: 4,402
⚠️ Invalidation
Hourly close above 4,720
Structure reclaim + EMA hold needed for bulls
🧠 Final Verdict
📉 Trend: Strong Bearish
🔥 Momentum: Seller-dominated
🎯 Strategy: Sell rallies, not bottoms
❌ Avoid: Catching falling knife

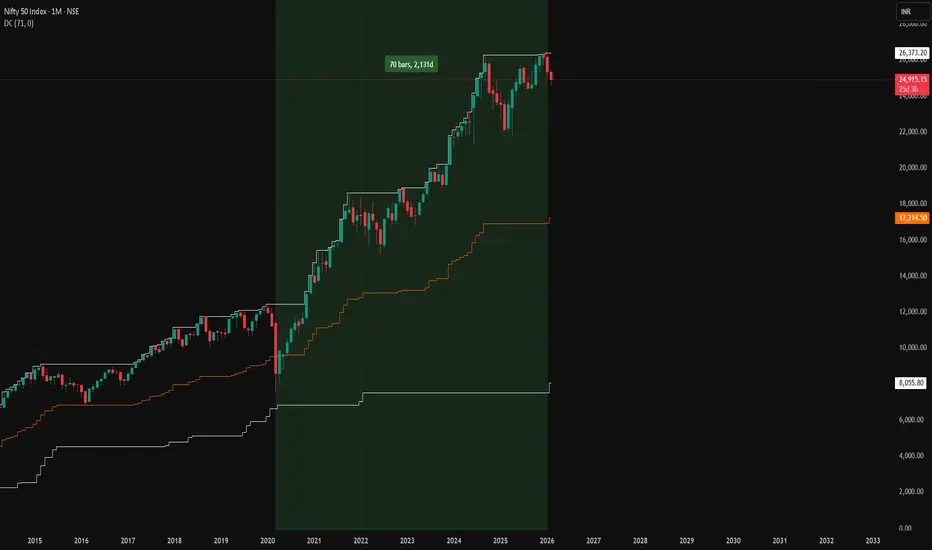
Major EventDC contraction starts linked to march 2020 ( start to 1st lockdown in India)
Major event : India budget 2026
XAUUSD – H4 Outlook: Liquidity ResetFebruary has opened with heightened volatility across global markets, and gold is no exception. After a strong upside run, XAUUSD has experienced a sharp corrective move, driven largely by deleveraging flows rather than a structural trend reversal.
Current price action suggests gold is entering a rebalancing phase, where liquidity is being cleared before the market can attempt a renewed push higher.
📈 Market Structure & Higher-Timeframe Context
Gold previously traded in a strong bullish structure, but the recent sell-off marked a clear market structure shift (MSS) on the H4 timeframe.
The impulsive decline swept sell-side liquidity below prior consolidation zones, a typical behavior after an extended rally.
Despite the speed of the drop, price is now approaching key support and demand areas, where selling pressure may begin to slow.
This type of move often reflects position reduction and risk-off behavior, not the end of the broader bullish narrative.
🔍 Key Zones to Monitor
Primary Support / Buy Zone: ~4,280 – 4,350
This area represents a strong demand zone where price may stabilize and form a base.
Short-Term Reaction Zone: ~4,450 – 4,500
A zone where price could oscillate during consolidation, suitable for short-term reactions rather than trend trades.
Sell-Side Liquidity Cleared:
The recent drop has already taken liquidity below previous lows, reducing immediate downside pressure.
Upside Rebalance Zones (FVG / Supply):
~4,850 – 4,900
~5,200 – 5,350
These areas are likely to act as resistance during any recovery phase.
🎯 Market Scenarios
Scenario 1 – Controlled Correction (Base Case):
Gold may continue to range or dip modestly into the 4,280–4,350 support zone, allowing the market to complete its liquidity reset. Holding this area would keep the broader bullish structure intact.
Scenario 2 – Recovery After Stabilization:
Once selling pressure is absorbed, price may begin a gradual recovery, targeting the 4,850–4,900 zone first. Acceptance above this level would open the door toward higher resistance areas.
Scenario 3 – Deeper Reset (Lower Probability):
A clean break below the main support would suggest a deeper correction, but at this stage, such a move would still be viewed as corrective within a larger cycle, not a full trend reversal.
🌍 Macro Backdrop (Brief)
The sharp sell-off in gold, silver, equities, and crypto reflects a global deleveraging wave, intensified by rising geopolitical risks and shifting risk sentiment. In such environments, gold often experiences short-term drawdowns, even as its longer-term role as a hedge remains intact.
This reinforces the idea that the current move is more about resetting positioning than changing long-term direction.
🧠 Lana’s View
Gold is not in a hurry.
After a powerful run, the market often needs to pause, rebalance, and absorb liquidity before the next meaningful expansion.
Lana remains patient, focusing on how price behaves around key H4 support zones, rather than reacting emotionally to volatility.
✨ Let the correction do its work. Structure will guide the next move.

TRADINGVIEW IS LOOKING FOR A NEW INDIAN REGION MODERATOR!Join Our Team: Exciting Opportunity to Become a Moderator for the Indian Region Community at TradingView!
Hello TradingView Enthusiasts,
Are you passionate about trading and the TradingView platform? We are on the lookout for a new moderator to join our INDIAN REGION Community and help elevate the experience for users like you.
As a moderator, your role is pivotal. You'll guide members, ensure adherence to our community standards, and help users maximize their TradingView experience. This is your chance to shine and directly influence the community dynamics while ensuring a friendly and respectful environment.
The General Tasks are:
✅ Replying to user inquiries that might get sent to you.
✅ Welcoming and encouraging new users
✅ Help reward and recognize users through TradingView Boosts and Editors Picks.
✅ Keeping the peace in our chat rooms
✅ Helping ensure that the site rules are followed
✅ Help maintain the quality of the site - eg unsuggesting poor ideas and untagging non-educational posts.
✅ Being visible - keep posting your ideas, chat with users, post comments on users' ideas etc
While this is an unpaid volunteer position, the benefits are substantial:
✅ Exclusive Access : Engage directly with our internal team, including the founders.
✅ Influence Development : Provide input on platform enhancements and new functionalities.
✅ Free Plan : Enjoy a free ULTIMATE account along with free data packs and exclusive merchandise.
✅ Boost Your Profile : Gain significant exposure, increase your follower count, and enhance your presence across the site.
✅ Career Opportunities : Many of our moderators have transitioned into full-time roles, using this position as a stepping stone to further their careers within TradingView.
We are looking for a Community Leader. We're looking for someone who:
✅ Has in-depth knowledge of the TradingView platform.
✅ Maintains a strong reputation within the community through high-quality content and helpful interactions.
✅ Engages positively with community members, respects diverse opinions, and upholds our community standards.
✅ Can dedicate at least one hour daily to moderating and supporting the community.
✅ Has been an active, respected TradingView member for over six months with minimal rule violations.
✅ Possesses solid general trading knowledge and can communicate effectively in both spoken and written English.
A good indication of this is:
✅ 100 or more posted trade ideas
✅ Have posted educational ideas
✅ Consistently get likes for your posted ideas (quality over quantity)
✅ 100 or more genuine followers
✅ Interact in Minds
✅ Regularly respond to comments on your own and others posts
✅ Have created and posted a Script
You don't need to have done all of these things, but it does help you stand out in the crowd and demonstrate you are familiar with multiple areas of our site.
Think this could be you? Learn more about what it means to be a moderator here:
www.tradingview.com
Ready to apply? Please fill out this form in English:
forms.gle/bsdGF1hw64wc3Epq6
🤔 If you have any questions or need further information, feel free to reach out to @zAngus .
We're excited to see who will join our team next and help us continue to provide a world-class trading community experience.
Warm regards,
💖 TradingView Team
Private idea

"BTCUSD WARNING THIS IS NOT A DIP… A MAJOR DROP IS COMING”⚠️ BTC MARKET WARNING – HIGH RISK ZONE AHEAD 🚨
This is not a normal analysis.
This is a clear market warning.
CRYPTO:BTCUSD is showing strong bearish signals on the higher timeframe, and ignoring these signs could be extremely costly. The chart clearly suggests that the market is preparing for a deeper correction, not a small pullback.
🔴 PRICE ACTION – DISTRIBUTION CONFIRMED
Bitcoin has faced strong rejection near the top, visible through long upper wicks and consecutive bearish candles.
After making higher highs, the market has lost structure, and price is now forming lower highs and lower lows.
➡️ This behavior typically signals a trend reversal, not a temporary dip.
🔴 KEY SUPPORTS HAVE TURNED INTO RESISTANCE
Multiple important levels have already been broken:
Previous support zones are now acting as strong resistance
Price is failing to reclaim the 86,000 area, which is a major red flag
This clearly indicates that buyers are losing strength, while sellers are in control.
🔴 RSI CONFIRMS BEARISH CONTINUATION
Weekly RSI has dropped below the 45–44 zone
This area historically signals bearish continuation
Repeated bearish signals on RSI confirm weak market momentum
⚠️ When RSI breaks and holds below this level on higher timeframes, corrections often last weeks or even months.
🔴 DOWNSIDE TARGETS – THIS IS NOT A SMALL DROP
If the current structure continues, the following downside levels are likely:
🎯 Target 1: ~83,200
🎯 Target 2: ~79,200
🎯 Target 3: ~70,000 (High-probability zone)
This represents a potential 18–20% downside, which is completely normal on a weekly chart after a strong rally.
🔴 MARKET PSYCHOLOGY – THE BIGGEST TRAP
What is happening right now:
Traders are aggressively buying the dip
Overconfidence after a long bullish run
Emotional decisions without confirmation
📉 This phase is where most retail traders lose money.
🧠 CLEAR WARNING MESSAGE
The market is no longer here to reward emotions — it is here to test discipline.
Long positions carry high risk
No stop-loss equals account damage
Blind dip-buying is a retail trap
🛑 WHAT SHOULD TRADERS DO NOW?
✔️ Protect capital
✔️ Wait for higher-timeframe confirmation
✔️ Avoid emotional trading
✔️ Only experienced traders should consider short-term setups with strict risk management
⚠️ FINAL WARNING
Those who respect the warning will survive.
Those who ignore it will remember this phase.
