COLPAL - STWP Equity Snapshot📊 STWP Equity Snapshot – Colgate-Palmolive (India) Ltd (COLPAL)
(Educational | Chart-Based Interpretation)
COLPAL has transitioned from a corrective phase into a demand-led recovery, with price reacting decisively from the 2097–2074 demand zone. This zone has historically attracted buyers, and the recent rebound reflects active absorption of selling pressure rather than a passive bounce. Price is now stabilising around the 2184 balance area, which acts as an important near-term reference. Sustained holding above this zone keeps the short-term structure stable and allows price to test higher reaction zones between 2288 and 2358, where acceptance will determine continuation quality. On the downside, any weakness below 2184 increases risk toward 2138 initially, followed by a deeper retest of the 2097–2074 primary demand zone, where the broader structure would be reassessed. As long as price remains above this demand band, the larger trend framework stays constructive.
Indicator readings from the dashboard support this developing structure. The presence of a strong bullish candle emerging after a period of consolidation indicates renewed buyer initiative. Bollinger Band behaviour shows prior volatility compression, with early signs of expansion now appearing, suggesting a shift from balance toward directional intent rather than a late-stage move. The BB squeeze context increases the relevance of the current expansion attempt, while RSI near the bullish mid-zone (~60) reflects improving internal strength without signs of exhaustion. Price holding above short-term trend measures reinforces near-term stability. At the same time, interaction with a wide CPR structure suggests that the market remains in a balanced environment, where consolidation, pauses, or controlled pullbacks toward value zones are more likely than immediate acceleration. Acceptance and follow-through remain more important than candle size alone.
Volume behaviour adds important confirmation to the price structure. Participation has expanded during bullish candles, indicating genuine buyer involvement rather than a low-liquidity reaction. Volume intensity remains within a healthy range, with no signs of climax or exhaustion typically associated with late-stage moves. Pullbacks have occurred on relatively lighter volume, suggesting that selling pressure is being absorbed rather than aggressively expanding. Overall, volume dynamics align with a controlled recovery and support the view that the move is being built through participation rather than emotion.
From a short swing perspective, COLPAL maintains a positive structural bias as long as price holds above the 2097–2074 demand zone. If acceptance improves and momentum sustains, higher range-expansion reference zones between 2388 and 2541 come into focus over the coming sessions. Conversely, sustained acceptance below 2074 would elevate downside risk and indicate a transition from recovery into a deeper corrective phase. Until such failure occurs, consolidation above demand should be viewed as healthy digestion of gains rather than structural weakness.
Final Outlook (Condition-Based):
Momentum is moderate and improving, the broader trend remains upward, risk stays elevated due to the recovery nature of the move and nearby supply, and volume remains supportive but requires continued follow-through.
💡 STWP Learning Note
Strong recovery candles show intent — confirmation comes only with acceptance above supply.
⚠️ Disclaimer
This post is shared strictly for educational and informational purposes. It is not investment advice or a recommendation. Please consult a SEBI-registered financial advisor before making any financial decision.
🚀 Stay Calm. Stay Clean. Trade With Patience.
X-indicator

BEL - STWP Equity Snapshot📊 STWP Equity Snapshot – Bharat Electronics Ltd (BEL)
(Educational | Chart-Based Interpretation)
Market Structure
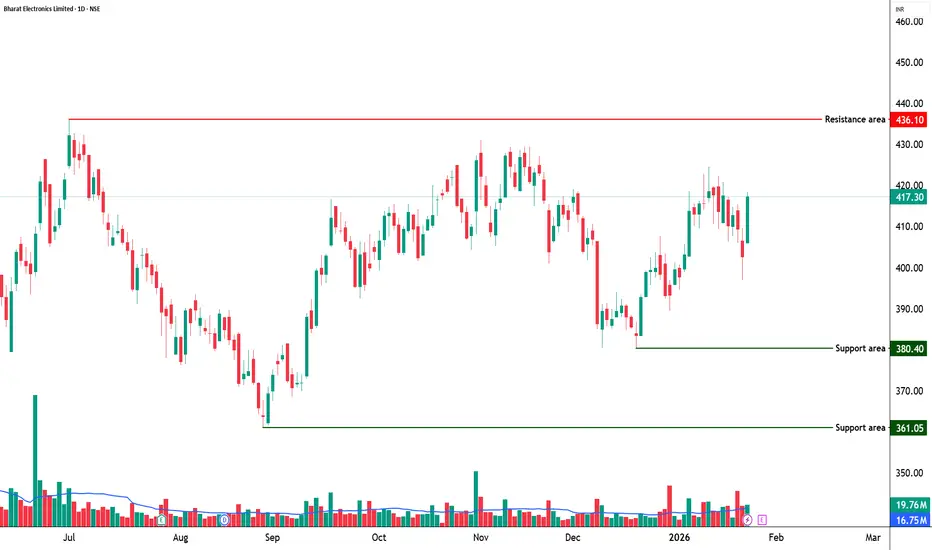
BEL continues to trade in a structurally strong uptrend, characterized by higher highs and higher lows on the daily timeframe. Recent price action reflects consolidation after a sharp upward expansion, suggesting digestion of gains rather than distribution. The broader structure remains constructive, with price holding above key support zones and maintaining bullish alignment.
Demand–Supply Structure
Price has respected a well-defined demand zone in the 402–397 region, where buyers have consistently defended declines. The recent bullish reaction from this area indicates demand absorption and willingness to support price at higher value levels. Overhead supply is visible near recent highs, but selling pressure appears controlled, indicating healthy supply management rather than aggressive profit booking.
Key Levels – Daily Timeframe
Primary demand zones are placed near 409, followed by deeper structural support around 402–397. These zones represent areas where buyers have previously stepped in with conviction. On the upside, resistance and reaction zones are located near 421, 426, and 434, which may act as pause or acceptance areas during further upside attempts.
What the Chart is Saying
Momentum remains supportive, with RSI holding near 57–58, reflecting healthy strength without signs of exhaustion. Price continues to trade above key moving averages, reinforcing trend integrity. Volume participation remains above average during bullish candles, suggesting continuation interest rather than speculative activity.
CPR Impact
BEL is trading above the CPR pivot with a relatively narrow CPR structure, which generally supports directional continuation rather than range-bound behavior. Acceptance above the CPR zone indicates short-term bullish control. However, the projected CPR ahead appears wider, hinting at the possibility of brief consolidation before the next directional phase.
Additional Structure Observations
Recent pullbacks have been shallow and followed by strong recovery attempts, indicating dip-buying behavior. Short-term moving averages remain positively aligned, while the longer-term structure continues to slope upward. The absence of heavy selling volume during declines suggests effective absorption of supply. Overall, the structure supports continuation, subject to normal consolidation and acceptance checks.
Intraday Reference Levels (Structure-Based)
The 418 zone acts as the near-term balance area and remains the key intraday reference. Sustained holding above 418 keeps the structure stable and supports upside testing toward the 436–449 zone, which represents upside reaction areas where price may pause or require acceptance. On the downside, weakness below 418 increases risk toward the 402–397 demand zone, where intraday structure would be reassessed. These levels define intraday risk versus opportunity, not directional certainty.
Swing Reference Levels (Hybrid Model | 2–5 Days)
From a short-term swing perspective, BEL remains within a positive structural framework as long as price holds above the 402–397 primary demand zone. If strength sustains, the 449–473 zone emerges as a higher range-expansion reference area over the coming sessions. Conversely, sustained acceptance below 397 would elevate downside risk and indicate a shift from consolidation toward deeper corrective behavior. Until such failure occurs, consolidation above demand should be viewed as constructive.
Final Outlook (Condition-Based)
Momentum remains strong and supportive of the prevailing structure. The trend is clearly up, with buyers maintaining control above key demand zones. Risk remains elevated due to proximity to resistance and recent price expansion, while volume stays moderate and healthy, supporting continuation rather than exhaustion.
💡 STWP Learning Note
Strong trends often pause through consolidation, not reversal.
Respect structure and let price confirm continuation.
📘 STWP Approach
Observe price. Respect risk.
Trade structure, not prediction.
⚠️ Disclaimer
This post is shared strictly for educational and informational purposes.
It is not investment advice or a recommendation.
Please consult a SEBI-registered financial advisor before making any financial decision.
🚀 Stay Calm. Stay Clean. Trade With Patience.
POL/USDT MACRO SETUP | 1700%+ POTENTIAL IF HTF STRUCTURE HOLDSPOL is currently trading within a major higher-timeframe accumulation zone after a prolonged downtrend from the 2024 highs. Price is building a long-term base inside a falling wedge / descending channel, a structure that often precedes macro trend reversals.
Technical Structure
• HTF demand holding at $0.13 – $0.10
• Price compression near multi-year lows, indicating seller exhaustion
• Falling wedge approaching maturity (bullish reversal pattern)
• Macro structure remains valid above 0.097 (HTF close)
• A break and acceptance above ~0.17 is required for bullish confirmation
Expansion Targets (HTF): $0.286 / $0.435 / $0.704 / $1.20 / $2.00+
This presents a high risk-to-reward positional setup if HTF demand continues to hold and a confirmed breakout occurs with volume.
Invalidation: HTF close below $0.097
This analysis is for educational purposes only.
Not financial advice. Always do your own research.

ZOTA - STWP Equity Snapshot📊 STWP Equity Snapshot – Zota Health Care Ltd
(Educational | Chart-Based Interpretation)
Market Structure
ZOTA witnessed a sharp corrective phase from higher levels, followed by a strong rebound from a well-defined demand zone. The recent candle stands out as a decisive bullish reaction, indicating aggressive buying interest after prolonged selling pressure. Despite the strength of the bounce, price is still trading within a broader range, and the larger trend structure has not yet shifted into a clear uptrend.
Demand–Supply Structure
Price moved deeply into a historical demand zone where buyers stepped in with conviction. The strong bullish candle suggests absorption of selling pressure and short-term buyer dominance. However, overhead supply zones remain active, meaning the current move should be viewed as a recovery from demand rather than a confirmed breakout. Sustained strength is required for further range expansion.
Key Levels – Daily Timeframe
Immediate demand zones are placed near 1376, followed by lower structural supports around 1290 and 1250. These are areas where buyers have previously defended price. On the upside, resistance zones are visible near 1451, 1526, and 1652, where selling pressure has historically emerged. These levels act as reaction zones and help define the current range.
What the Chart is Saying
Momentum has improved significantly after the recent bullish expansion, supported by strong volume participation. RSI is recovering from lower levels, indicating improving internal strength, but it is still not in a trending zone. The structure remains range-bound, suggesting that price may consolidate or oscillate between demand and supply zones before showing directional clarity.
CPR Impact
ZOTA is currently interacting with a wide CPR structure, which typically signals indecision and range-bound behavior. Earlier price action stayed below CPR resistance, reinforcing the lack of strong directional bias. For any sustained bullish shift, price would need to show acceptance above the CPR pivot with follow-through. Until then, the CPR structure supports a cautious, range-based view.
Additional Structure Observations
The rebound candle carries added significance as it formed with an open equal to the low, indicating immediate buyer control and minimal intraday selling pressure. This move was supported by clear volume expansion, suggesting participation beyond short-term traders and pointing toward stronger hands absorbing supply near demand. Short-term moving averages are attempting to turn up, reflecting improving momentum, while price remains below longer-term averages, keeping the broader structure neutral. RSI has recovered from lower levels but is still below bullish expansion zones, indicating support without trend confirmation. Additionally, the projected wide CPR for the next session reinforces the probability of consolidation or two-sided activity rather than immediate directional continuation. Overall, the move reflects strength from demand, but structural acceptance above nearby supply is still required for confirmation.
Intraday Reference Levels (Structure-Based)
The reference price zone near 1400 acts as a short-term decision area. Weakness below this zone may expose price toward lower demand regions around 1290. On the upside, reaction zones near 1450 and above are areas where price may pause or face selling pressure. These are observational levels, not predictions.
Swing Reference Levels (Hybrid Model | 2–5 Days)
For the short swing perspective, the 1400 zone remains the structural reference. Failure to hold demand increases downside risk toward deeper support zones. If strength sustains, higher range-expansion zones above previous resistance come into focus, but only as conditional possibilities within the broader range.
Final Outlook (Condition-Based)
Momentum is strong in the short term, supported by volume expansion. The trend remains range-bound, with no confirmed directional control yet. Risk remains high due to the counter-trend nature of the recovery and nearby supply zones. Volume is elevated, indicating participation, but structure confirmation is still pending.
💡 STWP Learning Note
Strong rebounds from demand show intent — not confirmation.
Let structure and acceptance guide bias, not candle size.
📘 STWP Approach
Observe price. Respect risk.
Trade structure, not excitement.
⚠️ Disclaimer
This post is shared strictly for educational and informational purposes.
It is not investment advice or a recommendation.
Please consult a SEBI-registered financial advisor before making any financial decision.
🚀 Stay Calm. Stay Clean. Trade With Patience.

HAL Weekly Chart suggest BO above 4680 ... 20% upside Possible.HAL Weekly Chart suggest BO above 4680 ... 20% upside Possible.
HAL looks breaking out from Earlier tops of 4680 after long time. Expect momentum to continue for 20% upside soon.
We can see multiple patterns on chart ... Daily CUP / Weekly CUP / DEC 24 Top Breakout.
LTP - 4736
SL - 4650
Targets - 5680+
timeframe - 10-12 weeks.
Happy Investing.

What"s next for IBKR ?Stock has been testing the 52 wk high resistance zone for quite a few times . After the earning boost , stock is poised to give a new ATH in the next 3-6 months depending upon macro and global uncertainities. Next stock target from current price is 86-90 $ per share translating into a return of almost 10 % from the current levels .

Part 9 Trading Master Class With Experts Role of Options in Modern Financial Markets
Options play a crucial role in:
Price discovery
Risk transfer
Market liquidity
Institutional hedging
Algorithmic and quantitative trading

End of the crazy gasInside the channel targetting 5.635 to 5.64. If rejected from there, bears are in for a treat after the mad week in the recent history of natgas
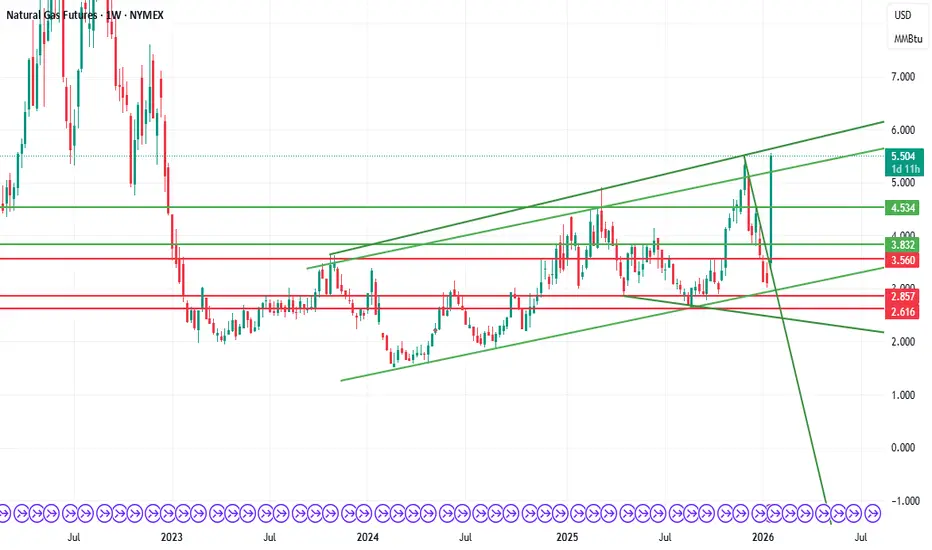
NatGas LongCurrent Price: 3.557, immediate support and SL 3.498 , long with a target of 3.75, and trailing it to 3.9 4.091 and so on. For short positions enter after support 3 break and take support 2 as SL , tgt would be kept at 3.25.

Part 10 Trade Like Institutions Volatility (Vega)
Options become expensive when volatility rises.
This usually happens:
Before major news: RBI policy, elections, budgets, Fed meetings.
During event-based uncertainty.
After events → IV crashes → Options become cheaper → Buyers suffer.

NIFTY – Short-term & Long-term Outlook from Demand ZoneNifty has shown a strong rejection from the 24,900–24,500 historical demand zone.
On the 4H chart:
Long lower wick near 24,900 indicates aggressive buyer participation.
RSI exhaustion and reversal suggests selling pressure has weakened.
Trendline and EMAs remain intact.
Short-term View:
Above 24,900 → upside possible towards 25,600 – 25,900
Below 24,900 (sustained) → downside towards 24,500
Long-term View:
24,500 is the major invalidation level.
Above 24,700–24,900, bias remains bullish on dips.
Upside targets: 26,000 – 26,400+
Disclaimer:
I am not a SEBI registered advisor. This analysis is for educational purposes only. Please do your own research before taking any trades.

XAUUSD (Gold) – Short-Term Bullish Rebound Within Broader ConsolPrice Action
Gold has rebounded from the recent swing low near 4775–4780, forming higher lows.
Price is moving along an ascending trendline (blue dashed line), indicating short-term bullish momentum.
However, the broader structure still looks like a range / consolidation after a prior impulsive move.
RSI (14)
RSI is around 54, back above the mid-line (50).
Earlier bearish RSI divergence played out, but momentum is now recovering, suggesting buyers are regaining control.
No overbought condition yet → room for further upside.
Awesome Oscillator (AO)
AO remains below zero, but red bars are shrinking.
This signals waning bearish momentum and a potential shift toward bullish pressure.
MACD (12,26,9)
MACD is still slightly below the signal line, but histogram is contracting upward.
Early signs of a bullish crossover forming if momentum continues.
Key Levels
Immediate Support: 4800 / 4775
Trend Support: Rising trendline from recent low
Resistance: 4850 → 4875
Upside Extension: 4900+ if bullish continuation confirms

KALYANKJIL 1 Week Time Frame 📌 Current Price Snapshot (Weekly Context)
₹~391–396 — the stock is trading near its 52‑week low range after heavy selling pressure.
NSE/BSE trend is bearish on weekly charts (sell signals and down momentum).
📊 1‑Week Time Frame – Pivot & Key Levels
📉 Weekly Pivot & Levels (from pivot analysis)
(These are derived from weekly pivot point calculations, representing expected turning points for the week)
📌 Weekly Pivot:
Pivot: ~₹479.12
👊 Weekly Resistances:
R1: ~₹495.23
R2: ~₹522.97
R3: ~₹539.08
🛑 Weekly Supports:
S1: ~₹451.38
S2: ~₹435.27
S3: ~₹407.53
👉 The current market price (~₹392–396) is below the first major weekly support (~₹451) and closer to the third weekly support at ~₹407.5 — indicating deep bearish momentum this week.
🧠 Summary – 1‑Week Level Playbook
Bearish near‑term risk:
Break below ~₹407 opens potential towards psychological lower bands.
Key levels for traders this week:
Support to watch: ~₹407 (S3)
Initial resistance to challenge: ~₹451 (S1 on weekly pivot)
Major resistance zones: ~₹495 and ~₹523

XAUUSD H1 – Liquidity Grab Completed, Buy the DipMarket Context
Gold has just completed a strong impulsive rally, leaving behind multiple liquidity pockets and imbalance zones below. The current pullback is technical in nature, serving as a rebalancing phase after expansion rather than a trend reversal.
From a macro perspective, safe-haven demand and a cautious Fed outlook continue to support Gold, keeping the broader bias tilted to the upside.
Technical Structure (H1 – MMF)
Market structure remains bullish with higher highs and higher lows.
The recent sell-off is a liquidity grab into previous demand zones.
No confirmed bearish CHoCH at this stage.
Price is still holding above the major H1 GAP liquidity zone.
Trading Plan – MMF Style
Primary Scenario – Trend-Following BUY
Prefer BUY setups on pullbacks into:
BUY zone 1: 4,759 – 4,729
BUY zone 2 (deep): 4,669 – 4,600
Only execute BUYs after clear bullish reaction and structure hold.
Avoid FOMO at premium levels.
Upside Targets
TP1: 4,817
TP2: 4,892
TP3: 4,898 (liquidity sweep zone)
Alternative Scenario
If price fails to hold above 4,729 and sweeps deeper liquidity into the GAP H1 zone, wait for re-accumulation signals before re-entering BUYs.
Invalidation
An H1 close below 4,600 invalidates the bullish setup and requires a full structure reassessment.
Summary
The broader trend remains bullish. The current move is a corrective pullback into liquidity, offering high-quality buy-the-dip opportunities. Patience and confirmation remain key — let price come to you.

XAUUSD – H2 Technical AnalysisLiquidity Pullback Within a Strong Bullish Structure | Lana ✨
Gold continues to trade within a well-defined bullish structure on the H2 timeframe. The recent surge was impulsive, followed by a healthy retracement that appears to be rebalancing liquidity rather than signaling a trend reversal.
Price action remains constructive as long as the market respects key structural levels and the ascending trendline.
📈 Market Structure & Trend Context
The overall trend remains bullish, with higher highs and higher lows still intact.
Price continues to respect the ascending trendline, which has acted as reliable dynamic support throughout the uptrend.
The recent pullback occurred after an aggressive upside expansion, fitting the classic sequence:
Impulse → Pullback → Continuation
No clear distribution pattern is visible at this stage. As long as structural support holds, the bias remains BUY on pullbacks, not selling strength.
🔍 Key Technical Zones & Value Areas
Primary Buy POC Zone: 4764 – 4770
This area represents a high-volume node (POC) and aligns closely with the rising trendline.
It is a natural zone where price may rebalance before resuming the bullish trend.
Secondary Value Area (VAL–VAH): 4714 – 4718
A deeper liquidity zone that could act as support if sell pressure temporarily increases.
Near-term resistance: 4843
Acceptance above this level strengthens the continuation scenario.
Psychological reaction zone: 4900
Likely to generate short-term hesitation or profit-taking.
Higher-timeframe expansion targets:
5000 (psychological level)
2.618 Fibonacci extension, where major liquidity may be resting.
🎯 Trading Plan – H2 Structure-Based
✅ Primary Scenario: BUY the Pullback
Buy Entry:
👉 4766 – 4770
Lana prefers to engage only if price pulls back into the POC zone and shows bullish confirmation on H1–H2 (trendline hold, strong rejection of lower prices, or bullish follow-through).
Stop Loss:
👉 4756 – 4758
(Placed ~8–10 points below entry, beneath the POC zone and the ascending trendline)
🎯 Take Profit Targets (Scaled Exits)
TP1: 4843
First resistance zone — partial profit-taking recommended.
TP2: 4900
Psychological level with potential short-term reactions.
TP3: 5000
Major psychological milestone and upside expansion target.
TP4 (extension): 5050 – 5080
Area aligned with the 2.618 Fibonacci extension and higher-timeframe liquidity.
The preferred approach is to scale out gradually and protect the position, adjusting risk as price confirms continuation.
🌍 Macro Context (Brief)
According to Goldman Sachs, central banks in emerging markets are expected to continue diversifying reserves away from traditional assets and into gold.
Average annual central bank gold purchases are projected to reach around 60 tons by 2026, reinforcing structural demand for gold.
This ongoing accumulation supports the idea that pullbacks are more likely driven by positioning and profit-taking, rather than a shift in long-term fundamentals.
🧠 Lana’s View
This remains a pullback within a bullish trend, not a bearish reversal.
The focus stays on buying value at key liquidity zones, not chasing price at highs.
Patience, structure, and disciplined execution remain the edge.
✨ Respect the trend, trade the structure, and let price come to your zone.

NIFTY – Bearish Structure Playing Out as AnticipatedIn my previous posts, I had clearly highlighted the possibility of a trend shift and warned that the ongoing price action could resolve to the downside. Over the last few sessions, price has started to play out exactly along those lines.
1. Bearish crossover (mini death cross)
A bearish crossover between the short-term and medium-term moving averages has now occurred. This was already anticipated and mentioned in earlier posts, and it marks a loss of bullish momentum after the ATH zone.
2. Clean breakdown below key support
Price has decisively broken below an important support and trendline structure. This confirms the bearish bias and strengthens the view that the broader market is under distribution rather than accumulation.
3. Next immediate support zone
The marked zone below acts as the next immediate support, where we may expect temporary consolidation or a technical bounce. However, unless there is strong follow-through buying, this should be treated cautiously.
4. Caution on bullish moves
Any signs of bullishness from here are likely to be temporary retracements, which may eventually trigger further sell-offs.
➡️ Avoid fresh swing longs until overall market sentiment turns favorable.
➡️ Existing positions should be managed with strict stop-losses and disciplined risk management.
The market is behaving in line with what was discussed earlier. Until structure changes and strength is proven, the risk remains on the downside. Patience and capital protection are more important than chasing trades in such phases.
📢📢📢
If my perspective changes or if I gather additional fundamental data that influences my views, I will provide updates accordingly.
Thank you for following along with this journey, and I remain committed to sharing insights and updates as my trading strategy evolves. As always, please feel free to reach out with any questions or comments.
Other posts related to this particular position and scrip, if any, will be attached underneath. Do check those out too.
Disclaimer : The analysis shared here is for informational purposes only and should not be considered as financial advice. Trading in all markets carries inherent risks, and past performance is not indicative of future results. It’s essential to conduct your own research and assess your risk tolerance before making any investment decisions. The views expressed in this analysis are solely mine. It’s important to note that I am not a SEBI registered analyst, so the analysis provided does not constitute formal investment advice under SEBI regulations.

Elliott Wave Analysis XAUUSD – 22/01/2026
1. Momentum
– D1 momentum is currently preparing to reverse, which warns that the market may enter a corrective phase or move sideways for at least several days. We need to wait for today’s daily candle close to confirm this signal.
– H4 momentum is preparing to reverse to the upside, signaling the possibility of a bullish move on the H4 timeframe today. This is an important move that needs to be closely monitored.
– H1 momentum is currently rising and approaching the overbought zone, indicating that the short-term bullish momentum is weakening. When H1 momentum enters the overbought area and reverses, a short-term corrective decline is likely to occur.
2. Wave Structure
D1 Timeframe
– On the daily timeframe, price is currently in the late stage of the blue wave 5.
– At the same time, D1 momentum is preparing to reverse, therefore we need to wait for today’s daily close for confirmation.
– If the D1 momentum reversal to the downside is confirmed, this would warn of a relatively extended corrective move following the D1 trend.
– In that scenario, price may:
– Move back inside the rising price channel
– Test the lower boundary of the channel
– Or even decline deeper toward the previous wave 4 base around 4276
– Therefore, we must anticipate and prepare for deeper corrective scenarios.
H4 Timeframe
– With yesterday’s decline, the current structure is likely forming orange wave 4.
– Using the 0.382 Fibonacci retracement of orange wave 3, the potential target zone for wave 4 is around 4667.
– At the moment, H4 momentum is preparing to reverse upward, signaling that a bullish move may appear today.
– This upward move is very important because:
– If H4 momentum reverses up and reaches the overbought zone
– But price fails to create a new high
– This would warn of a deeper corrective process on the higher timeframe.
H1 Timeframe
– On H1, price has already reached the target of the purple wave 4.
– However, there is currently a confluence of multiple wave 4 structures from higher timeframes, so caution is required.
– H1 momentum is preparing to move into the overbought zone, which warns of a potential decline within the next few hours.
– This decline creates an expectation that price may sweep liquidity below around 4737, which is the target zone for the Buy setup.
3. Expectations and Price Targets
– After the corrective move, the next bullish leg will be very important due to the overlap of multiple wave structures on higher timeframes, meaning volatility is expected to be significant.
– Therefore, profit targets should be set appropriately and managed flexibly.
– The most ideal target for the bullish move is the completion of purple wave 5 around 4959.
– However, as analyzed on the H4 timeframe:
– If momentum rises but price fails to break the previous high
– In that case, it is advisable to prioritize taking profits in this area, as it may signal the formation of wave 4 on the H4 timeframe, leading to a deeper decline.
4. Trading Plan
– Buy setup: 4738 – 4736
– SL: 4728
– TP1: 4758
– TP2: 4816
– TP3: 4870

XAUUSD – Trendline broken, focus on Buying liquidityMarket Context
After a strong impulsive rally, Gold has broken below the short-term ascending trendline, signaling a technical correction and liquidity rebalancing phase. However, the higher-timeframe structure remains intact, and the current decline is still viewed as corrective rather than a trend reversal.
From a fundamental perspective, safe-haven demand and a cautious monetary policy outlook continue to support Gold. This keeps deeper pullbacks attractive for institutional accumulation rather than aggressive selling.
Structure & Price Action (H1)
Short-term bullish trendline has been broken → transition into a corrective phase.
No confirmed bearish CHoCH on H1 at this stage.
Price is rotating within a range, targeting liquidity pools below.
Multiple Demand + Liquidity + H1 GAP zones are located beneath current price.
Upper zones remain Supply / Liquidity Sell areas for potential reactions.
Key Levels to Watch
Supply / Liquidity Sell: 4,949 – 4,874
Mid reaction zone: 4,824
Primary BUY zone: 4,755 – 4,729
Deep BUY zone (H1 GAP – Liquidity): 4,665 – 4,600
Trading Plan – MMF Style
Primary Scenario – Buy at Discount
Look for BUY setups at:
BUY zone 1: 4,755 – 4,729
BUY zone 2: 4,665 – 4,600 (H1 GAP & liquidity)
Entries only after clear bullish reactions and structure holding.
Avoid premature entries while price remains mid-range.
Upside Targets
TP1: 4,824
TP2: 4,874
TP3: 4,949 (upper liquidity sweep)
Alternative Scenario
If price fails to reach lower zones and holds above 4,824, wait for a break & retest to re-enter BUY positions in trend direction.
Invalidation
An H1 close below 4,600 invalidates the BUY bias.
Stand aside and reassess overall market structure.
Summary
The broader bullish bias remains intact, while the current move represents a healthy pullback for liquidity absorption. The optimal strategy is patience—BUY at discounted zones with confirmation, not by chasing price.

XAUUSD – Short-Term Trendline Broken, Focus on Buying Liquidity Market Context
After a strong impulsive rally, Gold has broken below the short-term ascending trendline, signaling a technical correction and liquidity rebalancing phase. However, the higher-timeframe structure remains intact, and the current decline is still viewed as corrective rather than a trend reversal.
From a fundamental perspective, safe-haven demand and a cautious monetary policy outlook continue to support Gold. This keeps deeper pullbacks attractive for institutional accumulation rather than aggressive selling.
Structure & Price Action (H1)
Short-term bullish trendline has been broken → transition into a corrective phase.
No confirmed bearish CHoCH on H1 at this stage.
Price is rotating within a range, targeting liquidity pools below.
Multiple Demand + Liquidity + H1 GAP zones are located beneath current price.
Upper zones remain Supply / Liquidity Sell areas for potential reactions.
Key Levels to Watch
Supply / Liquidity Sell: 4,949 – 4,874
Mid reaction zone: 4,824
Primary BUY zone: 4,755 – 4,729
Deep BUY zone (H1 GAP – Liquidity): 4,665 – 4,600
Trading Plan – MMF Style
Primary Scenario – Buy at Discount
Look for BUY setups at:
BUY zone 1: 4,755 – 4,729
BUY zone 2: 4,665 – 4,600 (H1 GAP & liquidity)
Entries only after clear bullish reactions and structure holding.
Avoid premature entries while price remains mid-range.
Upside Targets
TP1: 4,824
TP2: 4,874
TP3: 4,949 (upper liquidity sweep)
Alternative Scenario
If price fails to reach lower zones and holds above 4,824, wait for a break & retest to re-enter BUY positions in trend direction.
Invalidation
An H1 close below 4,600 invalidates the BUY bias.
Stand aside and reassess overall market structure.
Summary
The broader bullish bias remains intact, while the current move represents a healthy pullback for liquidity absorption. The optimal strategy is patience—BUY at discounted zones with confirmation, not by chasing price.

Thematic ETFs & Sector Funds for India in 2026🧠 1. Understanding Thematic & Sector Funds in India
📌 What Are Sector Funds?
Sector funds are investment vehicles (often mutual funds or ETFs) that concentrate their assets in one specific industry or sector of the economy—like banking, IT, infrastructure, or energy. These funds aim to capture the full performance cycle of that one sector. They hold only stocks from that sector and therefore have high concentration risk and potentially high returns if the sector outperforms.
📌 What Are Thematic Funds?
Thematic funds also focus on a broad theme or trend—but rather than being confined to a single sector, they may span multiple sectors that fit the underlying idea. A theme could be consumption, business cycle, digital transformation, or green energy. Thematic funds must invest at least ~80% of their assets in stocks tied to the theme.
📌 Thematic ETFs vs Sector Mutual Funds
ETFs (Exchange-Traded Funds): Listed on stock exchanges and traded like stocks, ETFs can offer lower expense ratios, intraday pricing, and transparency.
Mutual Funds (Sector or Thematic): Often actively managed and traded based on NAV (net asset value) at the end of the trading day.
Difference in Practice: ETFs are typically passive (tracking an index), while sector/thematic mutual funds can be active or semi-passive.
📊 2. Why Investors Use These Funds in 2026
🎯 Focused Exposure
Sector/thematic funds allow investors to selectively target growth drivers in the Indian economy—such as rapid urbanisation, rising middle-class consumption, infrastructure spend, or digitisation.
📉 Diversification vs Concentration
Sector funds have minimal diversification, giving deep exposure to sector movements.
Thematic funds, because they span multiple sectors linked by a narrative (e.g., ESG or digital economy), offer moderate diversification relative to sector funds, but still higher concentration than broad equity funds.
📈 Tactical Strategies
Many investors view these funds as tactical or satellite allocations (not core holding), because returns and risk can vary dramatically depending on economic cycles. For instance, sector funds often work very well when a specific sector is booming—but can lag significantly when that sector weakens. Experts suggest using them only as a small part of a broader portfolio strategy.
📌 3. Major Themes & Sectors in the Indian Market (2026)
📌 A. Infrastructure & Capex
India’s infrastructure push, under multiple government initiatives, continues to be a key secular theme. Funds in this space invest in companies tied to construction, engineering services, power utilities, logistics, and related capital goods.
Examples:
ICICI Pru Nifty Infrastructure ETF — tracks infrastructure companies.
Quant Infrastructure Fund — strong long-term historical CAGR among thematic funds.
Why It Matters: India’s National Infrastructure Pipeline and related spending targets fuel demand for businesses in this space.
📌 B. Consumption & Domestic Growth
As household incomes rise, themes tied to domestic consumption (ranging from FMCG to automobiles and retail services) remain strong.
Examples:
Nippon India ETF Nifty India Consumption — exposure to consumption companies.
SBI Consumption Opportunities Fund — thematic mutual fund capturing diverse consumer demand.
Why Few Investors Like It: Consumption trends are closely linked to demographic changes and urbanisation, often yielding stable growth opportunities.
📌 C. Banking & Financial Services
Traditionally a pillar of the Indian economy, financials—especially banks and PSU banks—remain a favourite for tactical investors.
Examples:
Kotak Nifty PSU Bank ETF — focused on public sector banks.
Nippon India ETF Nifty PSU Bank BeES — tracks PSU bank index.
Investor Angle: Rotational strategies sometimes favour this sector during banking or credit cycles.
📌 D. Technology & Digital Themes
Tech exposure spans not just traditional IT services, but digital transformation trends such as cloud, automation, and AI.
Examples:
ICICI Pru Nifty IT ETF — technology sector ETF.
ICICI Pru Technology Fund — mutual fund with broader tech exposure.
Why It’s Catchy: Tech firms often benefit from global digital adoption trends, but can be volatile due to global cyclical pressures.
📌 E. Defence & Strategic Industries
With rising defence spending and a focus on domestic manufacturing, defence has become a thematic focus.
Examples:
Motilal Oswal Nifty India Defence ETF — defence-focused ETF.
Why It’s Trending: Government policy support and strategic investments in aerospace and defence manufacturing bolster this theme.
📌 F. Metals, Energy & Commodities
Commodity cycles and industrial demand also create opportunities—from metals/refineries to energy companies.
Examples:
Mirae Asset Nifty Metal ETF — metals sector exposure.
Motilal Oswal Nifty Energy ETF — ETFs tracking energy & utilities.
🎯 4. Thematic Funds (Mutual Funds) to Watch in 2026
Sectoral mutual funds—another important segment—are actively managed thematic equity funds.
Examples (based on performance or popularity):
ICICI Pru Business Cycle Fund — focuses on cyclical trends across sectors.
SBI PSU Fund — diversified PSU-oriented theme.
HDFC Defence Fund — defence industry exposure.
Quant Infrastructure Fund — strong historical CAGR.
DSP Healthcare Fund & SBI Healthcare Opportunities Fund — healthcare & pharma themes.
These funds span a variety of thematic ideas including business cycles, PSUs, infrastructure, technology, and healthcare.
⚠️ 5. Risks & Limitations
🔥 High Concentration Risk
By design, sector/thematic funds often invest heavily in a narrow universe. While this can amplify gains when the theme works, it also means sharper declines when it doesn’t.
🧨 Volatility & Timing
Performance often swings with economic cycles or sentiment—making timing important. Many retail investors enter after strong performance, only to face downturns later.
📉 Inflow Fluctuations
Recent market data show inflows into thematic/sector funds have fluctuated sharply, with periods of both rapid growth and sudden slowdown—suggesting investor sentiment is volatile.
🧠 ETF Liquidity Concerns
Unlike broad index ETFs, many sector/theme ETFs suffer from lower liquidity, which can widen bid-ask spreads and affect trading prices.
📊 6. How These Fit Into a Portfolio (Practical Tips)
🧩 Core vs Satellite Strategy
Core Investments: Broad index funds or diversified equity funds.
Satellite Allocation: Sector/thematic funds (5–15% of total equity allocation), for tactical exposure to growth trends.
📆 Long vs Short Term
Use sector/thematic funds for long-term structural themes, but monitor risk and rebalance regularly.
For short-term tactical plays, ETFs allow more flexibility due to intraday pricing.
⚖️ Diversification Balance
To mitigate risk, never concentrate a major portion of your portfolio solely in one theme/sector—even if the narrative looks strong.
🧠 Conclusion
In 2026, thematic ETFs and sector funds remain powerful investment tools in India for capturing specific growth stories—from infrastructure and defence to tech and consumption themes. They offer a focused way to participate in structural tailwinds. However, they come with higher concentration risk and volatility than broad market exposures. Used wisely—as satellite elements within a diverse portfolio—they can enhance returns, but they are not a replacement for diversified investing.
If you're considering these, align your choice with your risk appetite, time horizon, and thematic conviction, and review regularly to ensure the underlying story still holds.

NIFTY 5M – Fresh Long Entry After Retracement | Fibonacci-Based NIFTY has respected the 0.382–0.5 Fibonacci retracement zone and is showing a clean bullish response on the 5-minute timeframe.
🔹 Fresh Long Entry: 25250
🔹 Invalidation / SL: Below 25100
🔹 Upside Target: 25555
🔹 Structure: Higher Low + Strong Impulse
🔹 Context: Trend continuation after healthy pullback
This setup aligns with price structure + Fibonacci confluence, suitable for intraday momentum traders.
⚠️ Trade with proper risk management.
📊 Not financial advice.

CONSOLIDATION IN STOCKS ? Lets Elobrate Base Chart ADANIENSOLConsolidation in technical analysis refers to a period when a stock trades within a tight range, showing indecision between buyers and sellers. It’s important because breakouts from consolidation often signal strong moves. Traders typically enter after a confirmed breakout, manage risk with stop-losses, and remember that patience and discipline are key takeaways.
📊 What is Consolidation in Technical Analysis?
Definition: Consolidation occurs when a stock’s price moves sideways within a defined range of support and resistance, reflecting market indecision.
Visual Pattern: Prices form horizontal channels, triangles, or rectangles.
Market Psychology: Buyers and sellers are balanced, waiting for new information or momentum before committing.
🌟 Importance of Consolidation
Signals Pause Before Trend Continuation or Reversal: Consolidation often precedes major moves.
Helps Identify Breakout Opportunities: Traders watch for volume spikes and price moves beyond support/resistance.
Reduces Noise: It filters out random fluctuations, giving clearer entry signals.
🎯 When to Enter Stocks
Breakout Entry: Enter after price breaks above resistance (bullish) or below support (bearish).
Confirmation Needed: Look for increased trading volume to validate the breakout.
Avoid Premature Entry: Entering inside the consolidation range can lead to false signals.
⚖️ Risk Management After Entry
Stop-Loss Placement:
For long trades: just below support.
For short trades: just above resistance.
Position Sizing: Risk only a small percentage of capital per trade (commonly 1–2%).
Trailing Stops: Adjust stops as the trend develops to lock in profits.
Avoid Overtrading: Consolidation can last longer than expected; patience is crucial.
🧠 Investor/Trader Key Takeaways
Patience Pays: Consolidation is a waiting game; don’t rush entries.
Volume is Critical: Breakouts without volume often fail.
Discipline in Risk Management: Always define risk before entering.
Adaptability: Consolidation can lead to continuation or reversal—be prepared for both.
Mindset: Treat consolidation as preparation, not stagnation.
👉 The essence: Consolidation is the calm before the storm. Smart traders wait for the breakout, confirm with volume, and manage risk tightly. Different consolidation patterns are like triangles, flags, rectangles

Morning Star in SENSEX & NIFTYObserving MORNING STAR Pattern in Sensex & Nifty.
With the Tariff issues kind of subsiding and considering Budget on 1st Feb, market will see an Uptrend in the coming few weeks.
Sensex will rebound strongly and might reach around 85750 in the near term.
