Silver Bullish Breakout on Monthly & Weekly CharPattern Formed: Symmetrical Triangle (Long-Term Consolidation)
Breakout Type: Bullish Breakout on Monthly & Weekly Chart
Volume Confirmation: Strength in breakout with price expansion
Measured Move Target: ~$44 (based on triangle height projection)
Immediate Resistance Zone: $44.11 (Historical supply zone)
Support Levels Post-Breakout:
Immediate Support: $34.78
Strong Support: $33.28
XAG USD (Silver / US Dollar)

Silver’s Bullish Cycle: Zones to Buy, Levels to Aim ! Silver is running one of its strongest bullish phases in recent years, having broken through key ranges and now holding around the mid-43s with momentum still intact. The structure shows that 42.7 is the immediate support staying above this level keeps short-term bulls in control. Once pressure mounts, the wider zone between 40 and 41 is where the market is Trend to react with macro catalysts, whether it’s Fed commentary, shifts in the dollar, or changes in yields. This zone is less about weakness and more about price discovery, often a place where institutional demand re-enters. A deeper correction cannot be ruled out, and the 37 region stands out as the medium-term load-up zone, where longer-term players will rebuild exposure. On the upside, silver has scope to stretch toward 44.9, and once momentum extends further, the 47.8 handle comes into play. From a macro perspective, the trend is supported by a weakening dollar, softer yields, and the Fed’s slow shift toward deeper rate cuts, while silver’s dual role both as a safe-haven and an industrial metal tied to the energy transition gives the rally added structural strength. Taken together, the bias remains firmly higher, with dips into support zones offering opportunities rather than threats. Trade safe!
Key Levels to Watch:
Immediate support: 42.7
Reaction zone: 40.0 – 41.0
Medium-term load up zone: 37.0
Upside targets: 44.9 and 47.8

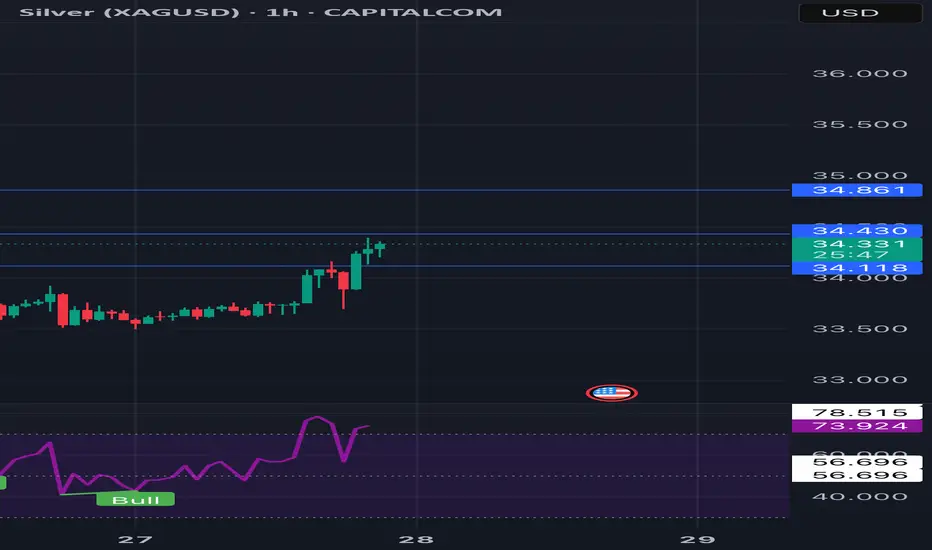
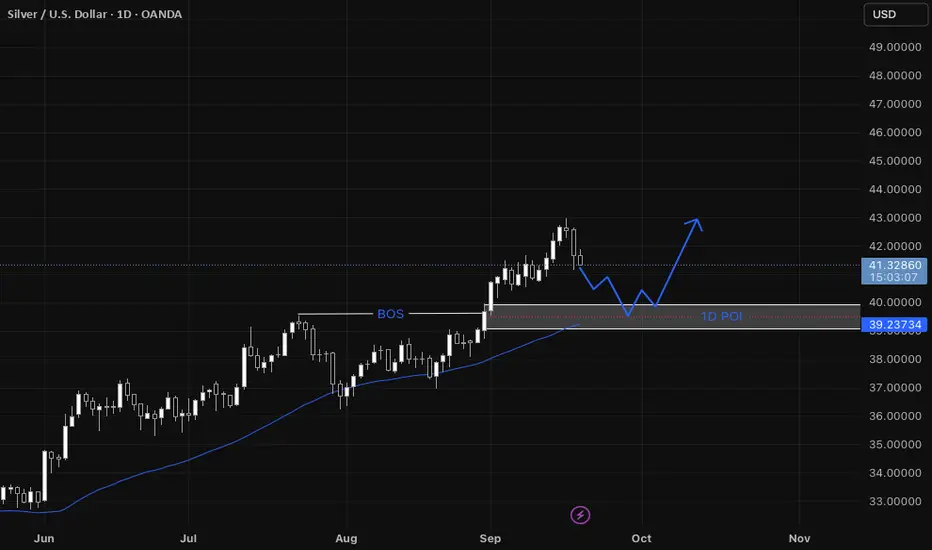
XAGUSD Step-by-step entry plan for XAGUSD
1. We have our Daily Point of Interest (POI)
- On the daily a zone that contains:
* a fair value gap (FVG),
* a break of structure (BOS) that previously acted as resistance and is now expected to act as support, and
* support from the 44 SMA.
2. Wait for price to return to the Daily POI
- Only consider the setup if price actually comes back into that daily POI zone.
3. Switch to the 1-hour timeframe to refine the entry
- Look for a shift in structure on the 1-hour (i.e., evidence that momentum is shifting bullish: BOS to the upside, higher highs/higher lows).
4. Confirm a 1-hour fair value gap forms
- The structure shift on 1-hour should create a 1-hour FVG (a short intraday imbalance).
5. Wait for the 1-hour FVG to be filled
- Let price fill that 1-hour FVG (price moves into/through the gap).
6. Look for a bullish confirmation on the filled 1-hour FVG
- After the fill, require a clear bullish formation on 1-hour (examples: bullish engulfing candle, strong demand candle, a higher-low + rejection wick).
7. Enter on the 1-hour bullish confirmation
- Enter when price breaks the confirmation level (e.g., breaks above the local 1-hour high formed by the bullish setup) or on a confirmed bullish candle close per your entry rules.
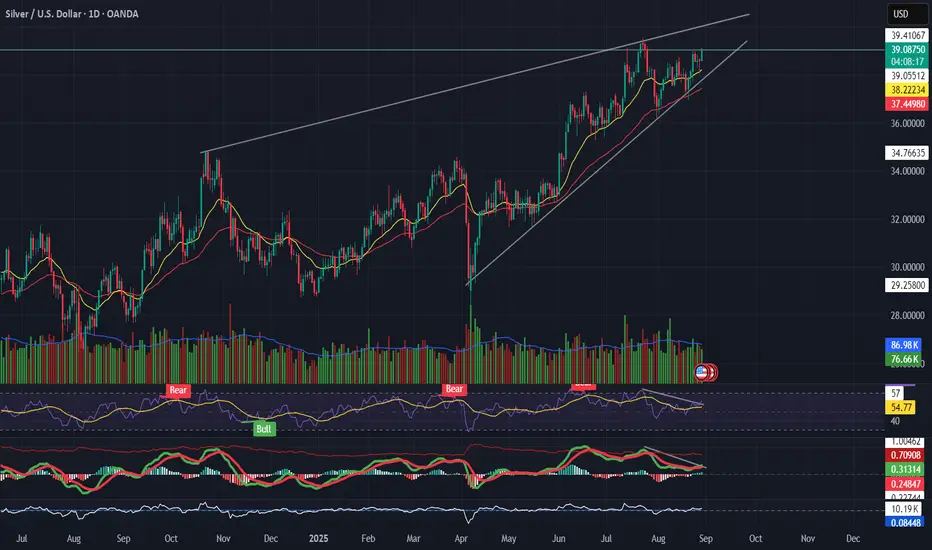
Silver (XAGUSD) Trading in a rising wedge Pattern📌 Silver (XAGUSD)
Trading in a rising wedge, pressing resistance near $39.
RSI divergence → price making higher highs, momentum not following.
MACD rolling over while price climbs = possible bearish divergence.
Support to watch: $37.3 → wedge breakdown if breached.
👉 Bullish only if $39.5 breaks with strong volume; otherwise, risk of pullback.
---
🎯 Takeaway
Silver = extended wedge → caution, momentum weak.
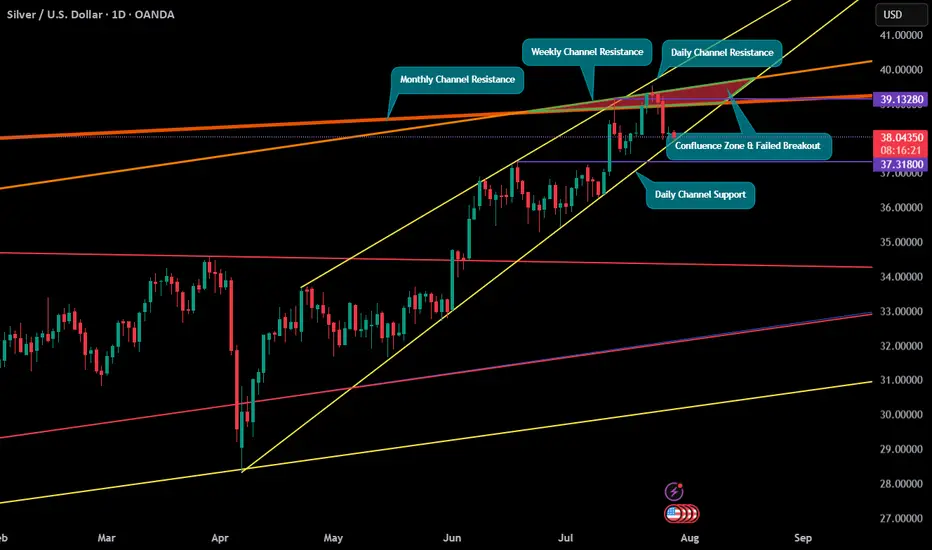
Silver at Multiple Confluence ResistanceSilver came up to a confluence of three Channel Resistances on all major timeframes i.e. Monthly, Weekly & Daily. Near term support currently is only the Daily Channel Support line & the last breakout attempt on D1 has failed to a certain extent. Should big volatility be expected? A break of such strong resistance may signal strong bullish momentum but can the support hold under such conditions.
SILVER 1D🔹 Silver Technical View
🔸 Timeframe:
🔸 Bias:
🔸 Strategy:
🧠 Key Levels Marked on Chart
Below 35.56 can see 34.40/34.00
Above 36.50 can see 37.90+
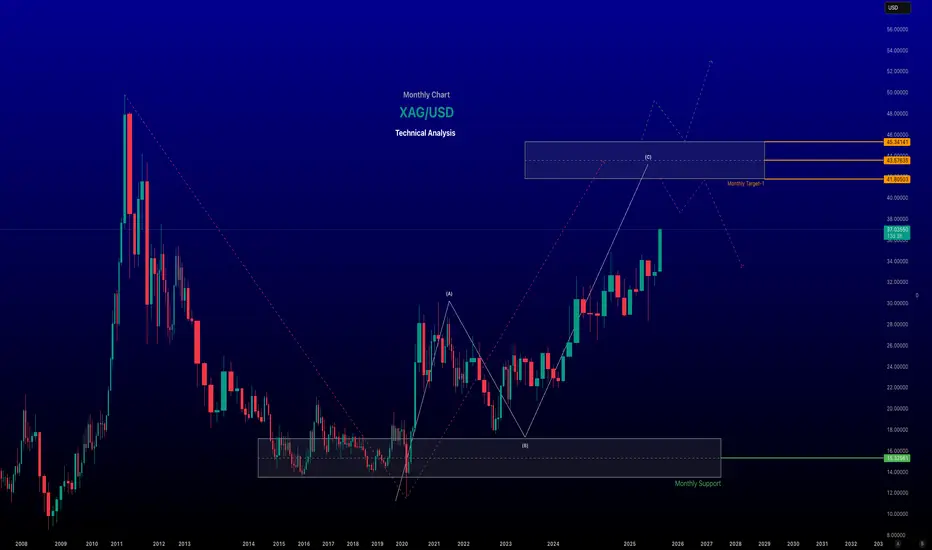
XAG/USD (Silver Spot vs. US Dollar) Analysis - Monthly Chart ~~ XAG/USD (Silver Spot vs. US Dollar) Analysis ~~
#Current Price and Recent Performance
As of June 18, 2025, the XAG/USD spot price is approximately $37.00 per troy ounce at the time of posting, reflecting a 13-year high. Silver has surged nearly 30% year-to-date in 2025, driven by heightened safe-haven demand amid geopolitical tensions, particularly in the Middle East, and global economic uncertainties. Over the past month, silver prices have risen by 12.43%, and year-over-year, they are up 23.33%.
-- Key Drivers of Recent Trends
Geopolitical Tensions: Escalating conflicts, such as Israel’s military actions in Iran, have boosted demand for safe-haven assets like silver and gold. This has been a significant catalyst for silver’s rally, with prices climbing in tandem with gold.
US Dollar Weakness: A softer US dollar, influenced by expectations of Federal Reserve rate cuts and softer inflation data, has supported higher silver prices. Since silver is priced in USD, a weaker dollar makes it more affordable for foreign investors, increasing demand.
Industrial Demand: Silver’s dual role as a precious and industrial metal (used in electronics, solar panels, and medical devices) accounts for ~56% of its demand. Growing industrial applications, particularly in green technologies, continue to support price growth.
Supply Constraints: A persistent supply deficit of 150–200 million ounces annually (10–20% of total supply) and declining above-ground inventories by nearly 500 million ounces in recent years have tightened the market, pushing prices higher.
Speculative Activity: Futures and spot market trading on exchanges like COMEX and the London Bullion Market, coupled with speculative interest, contribute to price volatility. The market is also influenced by “paper silver” (futures, ETFs), which some argue suppresses physical silver prices.
~~Technical Analysis~~
Current Levels and Trends: Silver is trading above the key support zone of $34.90–$35.15, maintaining a bullish outlook. Recent suggest a strong bullish trend, with a breakout above a downward trend line and minor resistance on the 4-hour chart.
Support and Resistance:
Support: Key levels include $34.99, $33.70, $32.67, and the 0.618 Fibonacci retracement at ~$35.00.
Resistance: Immediate resistance lies at $37.85, with further targets at $38.00 and potentially $40.34–$44.21 in the coming weeks or months.
-- Disclaimer --
This analysis is based on recent technical data and market sentiment from web sources. It is for informational purposes only and not financial advice. Trading involves high risks, and past performance does not guarantee future results. Always conduct your own research or consult a SEBI-registered advisor before trading.
#Boost and comment will be highly appreciated
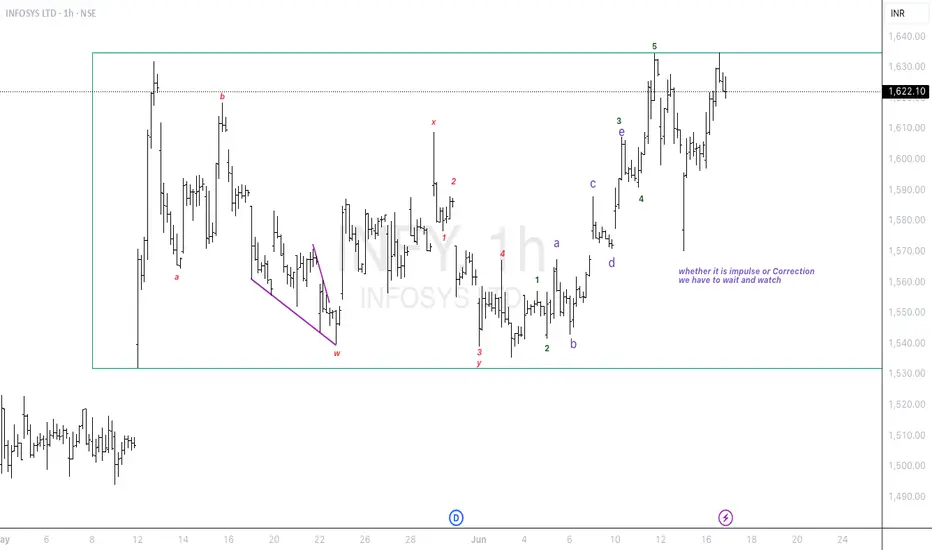
Infosys impulse or correction continuation.....
Elliott Wave Analysis:-
Possibility no.1:-
A corretion has been completed. Now an impulse wave has beed arised.
Possibility no.2:-
After the correction of WXY wave there may be a correction continuation which may form WXYXZ. We have to wait and watch the structure formation.
I am not a SEBI registered advisor. Before taking a trade do your own analysis or consult a financial advisor. I share chart for education purpose only. I share my trade setup.
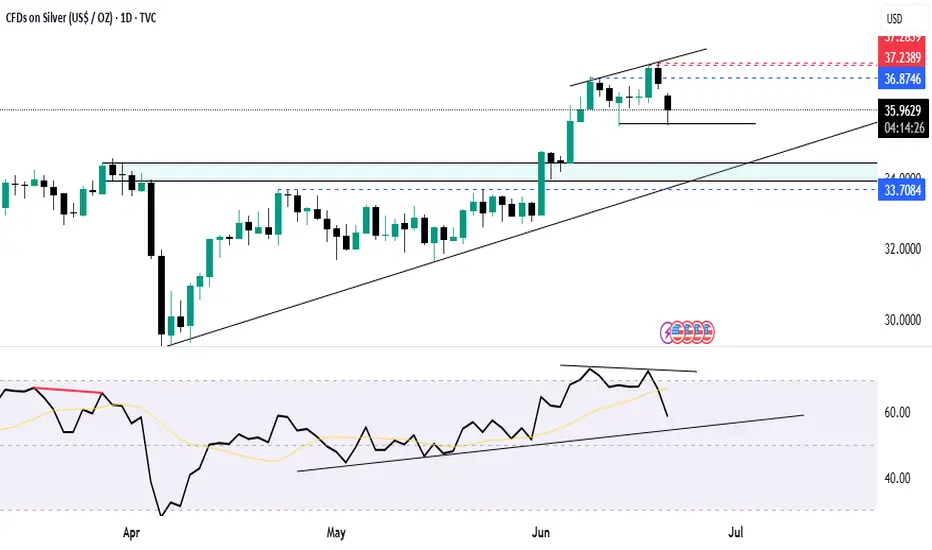
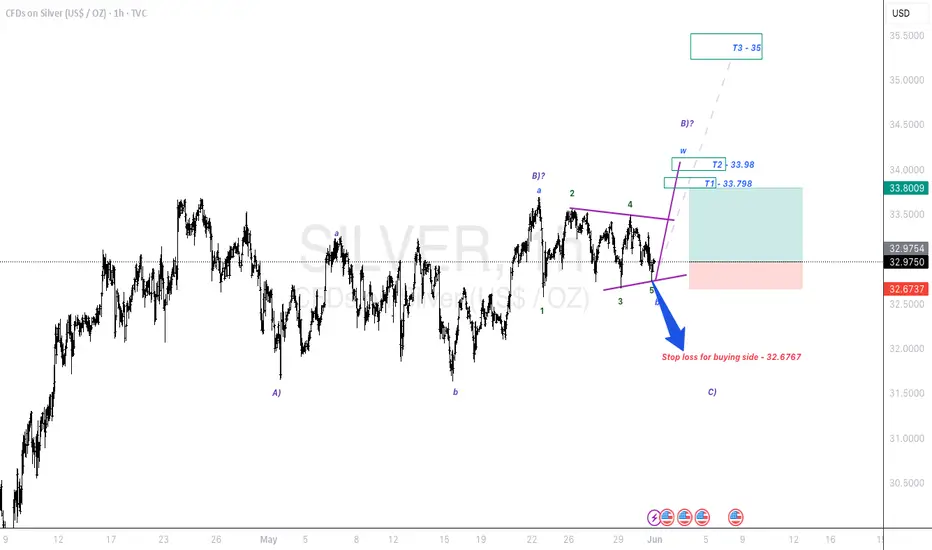
Analysis on Silver : XAGUSDSilver run halts at immediate resistance $36.12698
On breakout, upside targets are T1, T2 and T3 as mentioned respectively.
If price rejects this and falls below the Immediate support, then the 2024 year's high level will be a strong support to invalidate bullish sentiment.
Below S2, it will still be a weak bullish zone instead of a reversal or bearish knock.
IMO, a pullback is quite possible before hitting the upper targets. A valid close is important above the immediate resistance level.
There is a slight negative divergence in RSI to support the pullback.

Silver (XAG/USD) Bullish Breakout Setup – 4H Chart Analysis📈 Bullish Setup
Key Zones & Levels:
🔵 Current Price: 33.48
🟣 EMA 70 (Support): 32.83
🔻 Acting as dynamic support
🟦 Demand Zone:
📍 32.54 - 32.83
🟢 Strong buying interest expected here
🟥 Resistance Zone:
📍 Around 33.48 - 33.60
⚠️ Breakout above this zone could trigger buying momentum
Trade Setup:
🚀 Entry Point:
🔵 33.11 - 33.12
🛑 Stop Loss:
🔻 32.54 (Just below demand zone and EMA)
🎯 Target (Take Profit):
🎯 35.50
✨ Potential gain if breakout confirms
Price Path Projection:
🔹 Scenario 1: Bounce from demand zone → Break resistance → Hit target
🟢➡️📈➡️🎯
🔸 Scenario 2: Immediate breakout above resistance
📈⚡➡️🎯
Summary:
Trend: Bullish
EMA and trendline support price
Risk/Reward is favorable
Watch for confirmation before entry

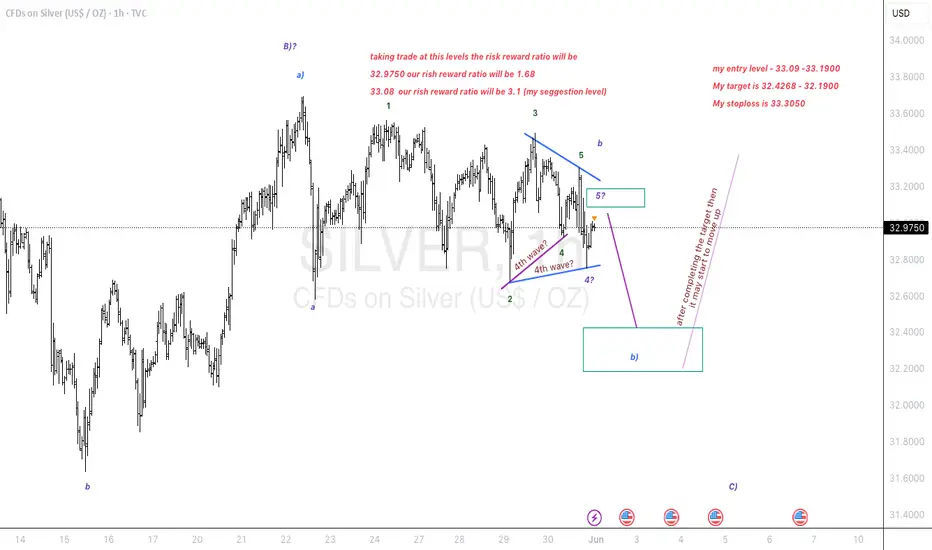
Triangle breakout in silver. Down to earth..
Elliott Wave Analysis:-
1st possibility:- (look Previous chart published)
Silver is in a triangle breakout. if it is getting towards upside breakout then we have a nice opportunity of pullback and and we can add it if the pullback occurs. else we can enjoy this journey quietly.
2nd possibility:-
Silver had already made a pullback towards down side breakout. Once it start the way it will fly towards downside and then it will complete a C wave in whole B wave then upside C wave will be impulsive.
My Entry, Stop, Target all have been discussed.
My suggestion to take a trade at this place to reduce the risk better reward.
I just spoke what chart whisper's in my ear.
I am not a SEBI registered advisor. Before taking a trade do your own analysis or consult a financial advisor. I share chart for education purpose only. I share my trade setup.
silver in triangle breakout. Two possibilities. one is impulisveElliott Wave Analysis:-
1st possibility:-
Silver is in a triangle breakout . if it is getting towards upside breakout then we have a nice opportunity of pullback and and we can add it if the pullback occurs. else we can enjoy this journey quietly.
2nd possibility:-
Silver had already made a pullback towards down side breakout. Once it start the way it will fly towards downside and then it will complete a C wave in whole B wave then upside C wave will be impulsive.
This type 2 will be discussed in next chart. I will post it as seperately chart for clear understanding .
I am not a SEBI registered advisor. Before taking a trade do your own analysis or consult a financial advisor. I share chart for education purpose only. I share my trade setup.
Precision Pays Off: Analysis Hit Again! Another Win🎯 Analysis On Point Again!
My recent analysis played out exactly as expected. 📉📈 Those who followed my instructions not only gained profits but also improved their trading knowledge and decision-making skills.
Success in trading isn't just about luck — it's about learning to read the market with precision and discipline. 📚💡
To those who’ve been riding along — congratulations on your gains! 🥂 And to the new followers, stay tuned. The next winning setups are just around the corner.
Let’s grow, learn, and earn — together. 🚀💸

XAG/USD Rejection Looming at Key Resistance – Bearish Reversal A🔍 Chart Analysis – XAG/USD
1. Trend & EMAs:
The chart shows two key exponential moving averages:
📈 EMA 50 (Red): 33.1940
📉 EMA 200 (Blue): 32.8684
Price is currently above both EMAs, indicating a short-term bullish trend, but a possible bearish rejection is forming near resistance.
2. Key Zones:
🟥 Resistance Zone: 33.45 – 33.60
Price has repeatedly tested this zone and reversed, suggesting strong selling pressure.
Multiple wicks into this zone show buyer exhaustion.
🟩 Support Zone: 32.60 – 32.85
Strong demand observed here with consistent bounces.
The EMA 200 also aligns with this support, reinforcing its strength.
3. Price Behavior & Pattern:
🧱 Repetitive Bearish Drops: Marked by blue rectangles, suggesting a pattern of sharp sell-offs after touching resistance.
🔁 Potential Double Top Pattern forming near the resistance zone, a classic bearish reversal signal.
🧭 The projected path suggests:
A short-term retest of the resistance.
Followed by a pullback toward the support zone around 32.60.
Breakdown below support could open further downside potential.
📌 Summary:
⚠️ Short-Term Outlook: Bearish bias if resistance holds.
📍 Key Level to Watch: 33.60 (breakout) and 32.60 (breakdown).
🔄 Trade Plan:
Consider short entries near 33.45–33.60 resistance zone with stops above 33.65.
Target around 32.65–32.60 support zone.
📊 Indicators in Play:
EMA confluence supports trend analysis.
Price structure and rejection patterns suggest likely mean reversion to support.

Silver MCX - Elliot Wave Counts - Long TradeSilver lagged Gold in the entire run up through the year
However, in last week Silver held quite well, while Gold has been correcting.
It seems like weekly Wave 4 is done and 1,2 of Wave 5 are done.
Wave 3 - targets 1.1L, 1.15L. Wave 5 targets + 1.2L
All the best!

"Silver – Bearish Move Toward Support"🧠 Market Overview:
Instrument: Likely Silver (based on file name).
Chart Context: The price is currently trading below both the 50 EMA (red) and 200 EMA (blue), indicating bearish momentum and a possible shift in market structure.
📊 Key Technical Components:
🔹 Exponential Moving Averages (EMA):
50 EMA (32.614) is above the 200 EMA (32.526) but both are above the current price.
This crossover is recent and could indicate the beginning of a larger downtrend if confirmed by continued price action below both EMAs.
🔹 Market Structure:
POI (Point of Interest) marks a previous swing high where selling pressure emerged.
The chart shows internal liquidity (INT.LQ) sweeps both above and below consolidation areas, hinting at smart money manipulation to grab liquidity before making a move.
🔹 Resistance Zone:
Clearly defined between approx. 33.4–34.0, where price was rejected after a failed attempt to break higher.
Multiple rejections from this zone show strong selling pressure.
🔹 Support Zone:
Sitting between approx. 30.8–31.2.
Price previously consolidated here before a bullish move, making it a likely target for a return test or a potential bounce.
📉 Bearish Scenario & Projection:
The price broke below a short-term structure and failed to hold above EMAs.
The current price action shows a bearish pullback likely to form a Lower High (LH).
The projected path shows a pullback to previous support-turned-resistance, followed by a breakdown targeting the support zone.
✅ Bias:
Short-term bias: Bearish
Medium-term bias: Bearish, unless price reclaims the 200 EMA and consolidates above the resistance zone.
🔍 Confluences Supporting Bearish Outlook:
Price below EMAs (dynamic resistance).
Failed higher highs with liquidity sweeps (indicating smart money selling).
Clear market structure shift to the downside.
Anticipated retest of support zone around 30.8–31.2.

Silver (XAG/USD) Falling Wedge Breakout –Bullish Setup Targeting📉 Pattern: Falling Wedge
🔵 Price was consolidating inside a falling wedge (🔽), which is typically a bullish reversal pattern.
🟡 Multiple touchpoints along the trendline confirm the structure.
Support Zone: 🔵
Area: 31.95 – 32.10
✅ Price tapped into this strong demand zone
🔥 Big bullish wick shows rejection – buyers stepping in!
EMA 70: 🔴
🧭 Acting as a potential dynamic resistance at 33.04
Watch for a clean breakout above it to confirm momentum.
Trade Setup:
Entry: ✅ Current area (~32.44) looks like a good long entry after bounce.
Stop Loss: ❌ Below 31.95 (under the blue zone)
Target: 🎯 33.68510 (Previous high)
📈 Huge upside potential if wedge breakout confirms!
Summary:
📉 Pattern: Falling Wedge
🔵 Strong Support Zone
✅ Bullish Rejection
🎯 Target: 33.68
❌ Stop Loss: Below 31.95
⚠️ Watch EMA 70 for resistance
🟢 Bias: Bullish – looking for breakout!

"Silver Short Setup: Supply Zone Rejection &Targeting Major SptChart Analysis for Silver/USD (XAG/USD) 🪙
🔵 Entry Point: 32.64870
📍This is where the trade is planned to start (short/sell).
🧲 Price is approaching this level again — watch for rejection.
🟥 Supply Zone: 32.65 - 33.16
⚠️ “SuPly Zone!” — Area of potential selling pressure.
🧱 Price previously reversed here, so it's a key resistance.
👀 Wait for bearish confirmation before entering.
❌ Stop Loss: 33.16322
🚨 Risk control: If price hits this level, the setup is invalid.
📈 If price breaks above, it could go higher — time to exit.
🎯 Target Point: 30.58219
🪂 The take profit zone — aim here!
🧊 It’s a previous support level where price might bounce.
📉 Trade Direction: SHORT (SELL)
🧾 Entry: 32.64870
🛑 Stop Loss: 33.16322
✅ Target: 30.58219
⚖️ Risk/Reward: ~1:4
🔻 Potential Move: -6.16%
📊 Trend & Indicators
🟠 Price recently moved up, now facing resistance.
🟢 EMA (7) is being tested — may act as dynamic resistance.
🔄 Several swing highs/lows marked with yellow dots — helps visualize market structure.
What to Watch For:
🔎 Bearish candlestick patterns inside the supply zone.
🧨 Sharp rejection or wick candles = good entry signal.
⏱️ Patience is key — let the setup come to you.

XAG/USD Eyes Upside Targets as Wave C MaturesXAG/USD is currently trading in a corrective phase where wave B appears to have completed, and wave C is currently forming. Based on the current price action, it doesn’t seem likely that this entire move will result in a full bullish recovery. The structure suggests that this could be sub-wave C of wave 4, potentially completing around the 26.79944 level. Going forward, if the 5th wave begins to unfold, potential targets could be in the range of 29.74182 to 30.57528.

"Silver on the Rise: RBR Zone Holds the Key to $33.49!"Key Zones:
🔵 RBR Zone (Rally-Base-Rally):
🔹 Acts as support
🔹 Price consolidating above it
🔹 If held, it could trigger a move up
📍 Support:
RBR Zone: ~$31.80–$32.10
Deeper support at $30.45 🛡️
🎯 Target Point: $33.49
Strong resistance zone
Previous high zone = profit-taking spot
📉 Downside Risk:
If price breaks below RBR zone and trendline
Could fall to $30.45 support zone
Trend Structure:
📈 Uptrend (Higher Highs + Higher Lows)
🧵 Trendline acting as dynamic support
🟡 Price bouncing from marked pivot zones
Scenarios:
🟢 Bullish Case:
✅ Hold RBR zone
✅ Bounce from trendline
🚀 Target = $33.49
🔴 Bearish Case:
❌ Break below RBR zone
⚠️ Risk drop to $30.45
Summary:
📊 Bias: Bullish above $32.00
📥 Entry Idea: Buy from RBR zone on confirmation
🎯 Target: $33.49
❌ Stop Loss: Below $31.50

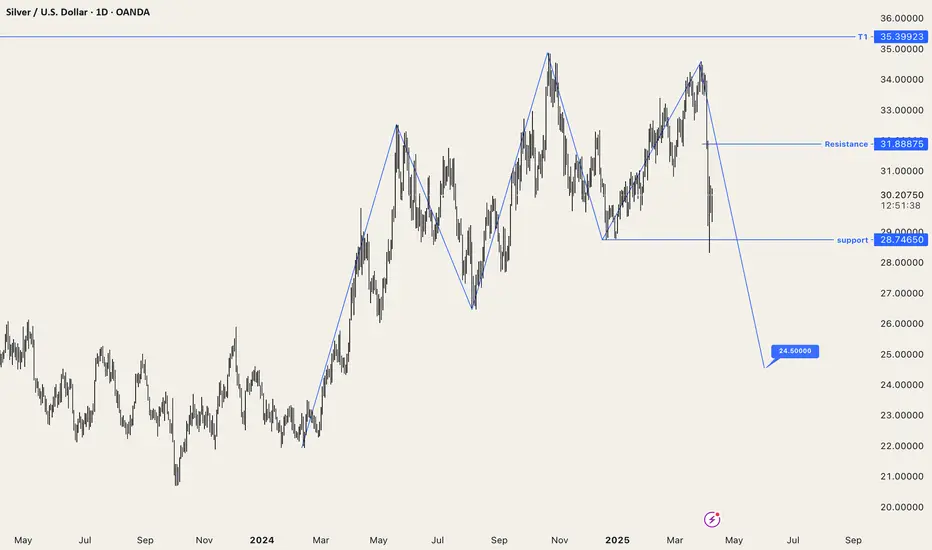
XAG: Silver projected for a fall till 24.50
Bearish invalidation if the price doesn't close, confirms the close below $28.75, and breaks the resistance level of 31.8875.
Right now it's a wait-and-watch scenario. Trade for sell will be active either on rejection of resistance or break-down of support
Silver (XAG/USD) Price Analysis – Key Levels & Market Outlook🔍 Key Observations:
📊 Current Price: 34.19250 USD
📈 DEMA (9, close): 34.25605 USD
🎯 Target Price: 35.38940 - 35.5000 USD
🔵 Zones Identified:
🟦 Supply Zone: 34.50 - 34.80 USD (🔼 Selling pressure area)
🟦 RBS Zone: 34.00 - 34.20 USD (🔽 Potential bounce zone)
🟦 Lower RBS Zone: 32.80 - 33.20 USD (⬇️ Strong support)
📉 Market Scenarios:
✅ Bullish Case:
Price bounces off the RBS zone at 34.00 USD ➡️ Uptrend resumes 🚀
Target: 35.50 USD 🎯
❌ Bearish Case:
Breaks below 34.00 USD ❗
Next stop: 33.00 USD ⚠️
📢 Final Thoughts:
🟢 Buyers: Wait for a bounce at 34.00 USD before entering 📈
🔴 Sellers: Look for rejection at 34.50 - 34.80 USD or breakdown below 34.00 USD 📉
⚡ Key Level to Watch: 34.00 USD 👀 A hold = bullish 📊, a break = bearish ⚠️

Silver Price Alert: Is XAG/USD Headed for $34.108? Learn Why!"Join us for an educational session on XAG/USD as we analyze key market trends and technical signals pointing to a potential drop toward $34.108. Understand the factors driving gold prices and gain insights to improve your trading strategy!
#chartanalysis
#xagusd
#trendanalysis