Gold short-term analysis: a new round of rise beginsPrecious metals benefited significantly from a sudden surge in risk aversion this week. U.S. President Donald Trump confirmed that reciprocal tariffs would be imposed on all countries on Tuesday, after hopes for a possible last-minute easing were dashed. Market tensions have risen significantly as the deadline approaches. Meanwhile, major banks remain bullish on the outlook for precious metals. Goldman Sachs Group Inc. sharply raised its gold forecast, predicting it will reach $4,500 by the end of the year.
Unexpected central bank demand and strong inflows into gold ETFs are the main factors supporting prices. U.S. Treasury yields gapped lower on Monday, approaching the March low of 4.172%. Market data shows that gold pricing has not only not become more expensive, but has become cheaper, suggesting that the market expects the current high to become the new normal and there is still room for upside in the future.
The 1-hour moving average of gold continues to cross upward and diverge. The support of the 1-hour moving average of gold has moved up to 3096, but gold is now far away from the moving average. So wait patiently for the adjustment and then continue to go long after stepping back. The 1-hour gold price fell to 3100 yesterday and stabilized again. So today, gold continues to go long on dips above 3100.
Don't guess the top of gold in a bull market. This is the best reflection of this year's market. The current market has hit a new high. For our intraday gold investment, I think we should continue to be bullish, because in the general direction, gold has completely broken through and stabilized above the 3100 mark. The trend in the first quarter showed a trend of exceeding strong rise, and the market continued to attack higher points above!
After gold stepped back, it hit a new high again. Gold bulls continued to be strong. Gold broke through 3127 again, so bulls were better and gold fell back to continue to be bullish. From the one-hour chart, gold broke through the new high in the morning and continued to rise, and the intraday 3127 line has turned into a support level. If it falls back to 3127 again, we will buy directly!
Key points:
First support: 3125, second support: 3113, third support: 3102
First resistance: 3148, second resistance: 3159, third resistance: 3170
Operation ideas:
Buy: 3120-3123, SL: 3112, TP: 3140-3150;
Xauusd(w)

XAUUSD IN MIDDLE ZONE ANY TIME BREAKOUT MODE 15 POINTS XAUUSD strong zone intraday wise if active above 3133
there is no resistance upto 3138 next 3148
wait for active
Buy above 3133
Stoploss..............3127.....6 points
Target1.............3138.....5 points
Target2.............3148
another side
Sell below 3124
Stoploss 3133......9 points
Target1..........3118....6 points
Target2...........3106.....18 points
Disclaimer- This level only for educational purpose only . Do ur own analysis

Gold Kicks Off April with a New ATH – Bulls Remain in Control Gold continued its explosive rally during the early Asian session today, printing yet another All-Time High (ATH) after retesting the 3,12x zone overnight.
The U.S. stock market reversed sharply higher in the New York session, and if this bullish momentum continues, gold could see a short-term pullback near current resistance before heading higher again.
However, if equities fail to hold and roll over, gold may push further into uncharted territory, eyeing extended targets around 315x – 317x.
📰 Macro Focus:
Investors seem to have interpreted Trump’s latest trade stance as more "measured" than previously feared.
In his latest comments, he signaled that “tariffs may play a smaller role in the overall economic strategy.”
This has calmed markets slightly but hasn’t slowed down the gold rush.
📈 Price Action & Outlook:
With current momentum and sentiment, gold still looks likely to print fresh ATHs this week.
The next major upside target sits around 316x – 318x, where we may finally see a significant pullback as FOMO cools down.
For now, watch the 312x – 311x zones for potential short setups at local resistance — as marked in AD’s key levels.
🧭 Key Technical Levels:
🔻 Support: 3133 – 3122 – 3111 – 3100
🔺 Resistance: 3158 – 3166 – 3172 – 3180
🎯 Trade Zones:
🟢 BUY ZONE: 3122 – 3120
SL: 3116
TP: 3126 – 3130 – 3134 – 3138 – 3142 – 3146 – 3150
🔴 SELL ZONE: 3170 – 3172
SL: 3176
TP: 3166 – 3162 – 3158 – 3152 – 3148 – 3144 – 3140
📊 What to Watch Today:
Investors will be closely watching ISM Manufacturing PMI and JOLTS Job Openings during the US session — expect volatility spikes.
As gold hovers near new ATHs, stay disciplined:
✅ Respect SL/TP
✅ Manage risk according to your account size
✅ Don’t get caught up in emotional trades
Wishing you a powerful and profitable start to the new month. Let’s flow smart.
— AD | Money Market Flow

Gold Spot (XAU/USD) Price Analysis –Key Zones & Potential Movemt🔵 Key Price Levels:
Current price: 🟠 $3,130.99
DEMA (9): 🔵 $3,138.21
Target price: 🎯 $3,174.92
📌 Zones Identified:
🟢 Demand Zone (Support) ⬇️: Strong buying interest, potential bounce area. If price falls here, buyers may step in.
🟡 RBR Zone (Rally-Base-Rally) 🔄: A mid-level area where price could consolidate before moving up.
🔴 Supply Zone (Resistance) ⬆️: Sellers might emerge, causing a reversal or slowdown in price movement.
📈 Potential Price Action:
🔹 Scenario 1 (Bullish 🐂): A retrace to the RBR Zone 🟡 could lead to a bounce 📈 toward the Target 🎯 at $3,174.92.
🔹 Scenario 2 (Bearish 🐻): If price drops below the Demand Zone 🟢, it may signal a trend reversal 📉.
🔹 Breakout Confirmation: If price breaks above the Supply Zone 🔴, it may continue rallying 🚀 toward the target point.

Gold Hits Projected Target ZoneThe price is currently within the projected topping area that I marked on chart and We're seeing increased volatility in the 3,100-3,150 zone, expecting that the bullish momentum may continue for another 1-2 days as no significant weakness is visible on higher timeframes,After the current push, expect the projected correction phase to begin and we have to wait for higher time frame to confirm this, This upcoming correction should be viewed as a healthy reset within the longer-term bull market rather than a trend reversal.

Gold Next Move 3200?🔎 15-Minute Chart (Intraday Analysis)
50 EMA as Dynamic Support:
Price is respecting the 50 EMA (red line), indicating bullish strength.
📈 Support Levels:
$3,099 & $3,087 - Strong support zones for a possible bounce.
$3,071 - Deeper support if price pulls back further.
• Current Price Action:
• Price is pushing higher but approaching resistance.
📌 Conclusion: If the 50 EMA holds, price could continue its upward move. If it breaks, we may see a pullback toward $3,099 or lower.
🔎 1-Hour Chart (Short-Term Targets & Ranging Market)
⚠️ Breakout from Ranging Market:
• Price was consolidating in a range around $3,098 - $3,120 before breaking out.
Fibonacci Targets:
• 1st Target: $3,141 (already reached).
• 2nd Target: $3,162 (next potential level).
Support & Resistance Levels:
📉 Resistance: Near $3,141 - $3,162 (Fib targets).
📈 Support: Around $3,098 and $3,087 (marked with red and green lines).
📌 Conclusion: The breakout is bullish, and if price holds above $3,141, it may push toward $3,162. A break below $3,098 could signal a retracement.
🔎 4-Hour Chart (Trend & Key Levels)
Trend: Strong uptrend inside an ascending channel.
Buy Entry & Exit Points:
• A Buy was placed near the lower trendline.
• Buy Exit was taken at a key resistance level before a pullback.
• POI (Point of Interest) Level:
• A demand zone (light blue area) around $2,980 - $3,000, where price previously reacted.
Moving Averages:
• The 50 EMA (red line) is acting as a dynamic support.
• The 200 EMA (blue line) is providing long-term support.
Resistance & Support Levels:
📉 Resistance: Near $3,150 (upper trendline).
📈 Support: Around $3,059 and $2,980 (marked green lines).
📌 Conclusion: Price is moving towards the upper trendline. If it breaks, we could see more bullish momentum. If rejected, a pullback toward POI is likely.
🔹 Overall Market Summary & Trading Plan
✅ Bullish Bias: Price is in an uptrend on multiple timeframes.
✅ Next Resistance: $3,150 - $3,162 (watch for rejection or breakout).
✅ Pullback Zone: $3,098 - $3,087 (potential buy area).
🚨 Risk Management: If price breaks below $3,087, a deeper retracement may occur.
📌 Trade Idea:
🟢 Long Entry: On pullbacks to $3,098 - $3,087.
🎯 Target: $3,150 - $3,162.
❌ Stop Loss: Below $3,071 for risk control.
👉 Always follow TP/SL to protect your capital and maximize profits!
Stay tuned for updates once the confirmations are in place!
Please support me with your likes and comments to motivate me to share more analysis with you and share your opinion about the possible trend of this chart with me !
📢 Best Regards , Silver Wolf Traders Community
Disclaimer: This is for educational purposes only.
Always trade responsibly and manage your risk effectively

XAUUSD 23 POINTS FALL SHARF FALL BELOW 3113.30...UPTO 3090XAUUSD weak below zone 3113.30
There is no suport upto 3090
wait for active mode
Sell below only 3113.30
Stoploss 3021......8 points
Target1.....3109........4.30 points
Target2.....3100........13.30 points
Target3......3090.........23++ points
Disclaimer - This level only my view and education purpose only. Do ur own analysis

XAUUSD 20 PTS SHARP FALL SURE BELOW 3113.50XAUUSD weak below 3113.50
sharp fall will chance upto 3093.....20 points
weak zone there is no suport zone below 3113.50 letsee
wait for active zone
Sell below...................3113.50
Stoploss.....................3121....7.50 points
Target1.........3109.50.....4points
Target2.........3100.........13.50 points
Target3..........3093........20+ points
Disclaimer- This level only for education purpose . Do ur own analysis

Next Gold Move To 3500 ?📰 Fundametal news:
Key points:
⚡Gold hits record high at $3,128.06
⚡Trump expected to announce reciprocal tariffs on April 2
⚡Silver, platinum, palladium set for monthly gains
Trump is expected to announce reciprocal tariffs on April 2, while automobile tariffs will take effect on April 3
🚨 Technical Analysis
4-Hour Chart Analysis
Trend: Strong bullish channel (marked by red trendlines).
📈 Support Levels:
3,057 (key level in case of correction).
3,007 (next major support below).
📉 Resistance Levels:
🔸Upper boundary of the bullish channel near 3,140-3,150.
The price is respecting the trend channel.
🔸If gold remains inside this channel, it may continue rising towards the upper boundary (around 3,140-3,150).
🔸A breakdown of the channel could signal a correction.
1-Hour Chart Analysis
🔸Trend: Strong bullish momentum with a new all-time high at 3,127.962.
📈 Support Levels:
🔸3,057 (previous resistance turned support).
🔸2,999 (major historical support).
📉 Resistance Levels:
🔸No historical resistance beyond the all-time high, meaning price discovery mode.
🔸Gold is in a price discovery phase after breaking above previous highs.
🔸A possible pullback to 3,057 could provide a buying opportunity if bullish momentum continues.
15-Minute Chart Analysis
Trend: Short-term uptrend but facing resistance near 3,128.
📈 Support Levels:
🔸Minor support at 3,109 (highlighted blue zone).
🔸50 EMA (red line) acting as dynamic support.
📉 Resistance Levels:
💡3,128 is a strong resistance level where price is struggling to break out.
🔸The price gapped up and continued its bullish momentum.
🔸The price is hovering above support, indicating potential consolidation before another move.
Overall Trading Plan & Strategy:
Bullish Scenario:
🔸If price breaks 3,128 with strong momentum, we could see 3,140+ in the short term.
🔸Pullback to 3,109-3,057 could provide a buying opportunity if it holds support.
Bearish Scenario:
🔸If gold fails to hold 3,109, a drop to 3,057 or even 3,007 could be expected.
🔸Breaking below the trend channel would signal a deeper correction.
💡 Conclusion: The trend is bullish, but resistance at 3,128 needs to be broken for further upside. Watch for support at 3,109 and 3,057 for potential buy opportunities.
👉 Always follow TP/SL to protect your capital and maximize profits!
Stay tuned for updates once the confirmations are in place!
Please support me with your likes and comments to motivate me to share more analysis with you and share your opinion about the possible trend of this chart with me !
📢 Best Regards , Silver Wolf Traders Community
Disclaimer: This is for educational purposes only.
Always trade responsibly and manage your risk effectively

XAUUSD 14 POINTS SELL BELOW 3114 SHARP FALL UPTO 3100..XAUUSD weak below only 3114
below 3114 there is no suport so sharp fall will hapen
wait for active zone
sell below 3114
stoploss..3121.......7 points
Target1........3109.50...4.50 points
Target2........3100........14 points
Disclaimer - This level only for education purpose only

GOLD SURGE CONTINUES – FEAR, WAR & END-OF-MONTH VOLATILITYGold opened this week with a strong upside gap, once again reminding us of how unpredictable Mondays can be following highly volatile weekends.
As always, when the market gaps significantly after the weekend, it's best to wait for price to absorb the remaining volume before locking into new setups.
As mentioned in previous outlooks, the current BUY pressure is still high, driven by a global wave of FOMO and fear, caused by:
Rising geopolitical tensions,
Global economic instability,
And even natural disasters now hitting parts of Asia.
Asian stock markets dropped sharply this morning after weekend developments escalated — with the Russia–Ukraine war showing no signs of de-escalation. In fact, new reports suggest a broader regional impact, further boosting risk-off sentiment.
💡 Safe Haven Flows Are Back in Full Force
Right now, gold is the #1 asset investors are paying attention to.
It's being treated as the ultimate flight-to-safety amid global panic and uncertainty.
And with this momentum, new ATHs may still be ahead.
📅 End-of-Month Candle Close – Expect Whipsaws
Today also marks the final trading day of the month, meaning we could see aggressive stop hunts and liquidity sweeps as large players look to close their monthly books.
➡️ Be extra cautious today — sharp moves up or down may occur due to end-of-month positioning.
Whether BUY or SELL, it’s best to trade tight, scalp smart, and respect your SL/TP.
Key Levels for 01/04:
🔺 Resistance: 3116 – 3132
🔻 Support: 3092 – 3085 – 3076 – 3066
🎯 Trade Plan:
SELL ZONE: 3130 – 3132
SL: 3136
TP: 3125 – 3120 – 3115 – 3110 – 3105 – 3100
BUY ZONE: 3066 – 3064
SL: 3060
TP: 3070 – 3075 – 3080 – 3085 – 3090 – 3095 – 3100
Stay sharp and trade with discipline.
End-of-month volatility is not for the weak hands.
— AD | Money Market Flow

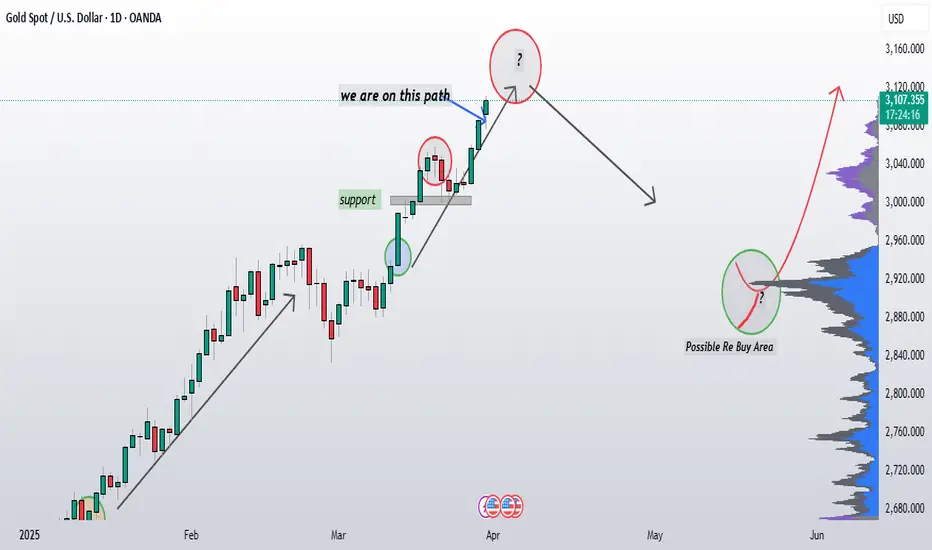
Gold target hit at 3100: Still looking strong My previously projected path from the beginning of the year has played out with remarkable accuracy, validating our bullish outlook since January 2025 and we have captured every buy move with great precision .
We've seen consistent higher highs and higher lows within this uptrend.Recent price action shows increased volatility near to current price zone 3100-10.
The market is now entering my projected topping area (red circle),The market has followed projected path and is now entering a critical decision zone (This week or next) after this I am expecting a subsequent correction phase as marked on chart.
Is gold going to be eclipsed?
-------------------------
Timeframe: 240 Min
-------------------------
The price action suggests a completed impulse structure originating from the 2833 low, with gold now trading at an all-time high. Based on cluster zones and Fibonacci extensions, wave (5) still has the potential to extend toward the 3150-3200 range. This zone represents a key resistance level where buying momentum may slow down, signaling an impending shift in market dynamics.
Once wave (5) completes, it will mark the end of wave ((3)) of a higher degree, setting the stage for a corrective move. A retracement toward the previous wave (4) level is expected as wave ((4)) develops, aligning with historical corrective behavior after extended rallies. This phase will provide crucial insights into the market’s next major move. Stay tuned for further updates.

GOLD – Unshaken Through Chaos - 50 new all-time highs🟡 GOLD – Unshaken Through Chaos | A Structural Bull Run Backed by Global Repricing
Gold isn’t just rallying — it’s sending a message.
Over the past 12 months, gold has set over 50 new all-time highs, a breakout sequence unmatched in over a decade. This is now officially the longest bullish streak in 12 years, and the third longest in modern history, only behind the volatile 1979–1980 period — a time when the global economy was grappling with runaway inflation, stagnant growth, and widespread unemployment.
But what makes this current bull cycle unique is not just the price action, but the structural shift behind the move.
📈 The Numbers Speak for Themselves:
YTD 2024 performance: +16%
12-month gain: +39%
Price range: From ~$1,200 to nearly $1,600/oz
3rd consecutive bullish year
These gains are not speculative pumps — they are a response to systemic instability. The macro backdrop is screaming uncertainty:
Sticky, structural inflation
Slowing global economic growth
Real interest rates still hovering around zero or negative
Geopolitical risk escalating in nearly every region of the world
This isn’t a short squeeze. It’s a capital migration.
🏦 The Central Bank Bid: The Silent Giant
What separates this rally from past cycles is who’s buying.
Unlike the 2011 gold run — driven heavily by retail FOMO and speculative ETF flows — today’s surge is institutionally anchored.
The strongest force in the current trend? Central banks.
Led by China, Russia, Turkey, and several BRICS nations, central banks have been accumulating gold at a record pace, shifting reserves away from USD exposure and hedging long-term geopolitical and economic risks. This isn't just diversification — it's a statement of monetary sovereignty.
Their consistent demand is forming a strong floor under price, insulating gold from violent retracements even during short-term corrections.
🔍 The Psychology of this Bull Market
This isn’t the kind of rally that fades on CPI noise.
The capital flow is defensive, not aggressive.
Funds are rotating into gold not to chase yield, but to preserve value. In times when fiat devaluation, sovereign debt instability, and political fragmentation are on the rise — gold doesn’t just shine, it leads.
The market is re-pricing systemic risk.
Investors are no longer reacting to inflation headlines. They are positioning for longer-term fragility in global monetary policy. That’s why even when inflation prints soften temporarily, gold still holds ground.
📌 What Comes Next?
Yes, technically, a pullback is healthy — even expected.
Extended breakouts are often followed by short-term consolidations. But the medium- to long-term structure remains intact.
Gold is not in a bubble. It’s in rotation.
In a world full of uncertainty, inflation volatility, and central bank crossfire — gold remains the most trusted asset for capital protection. And this rally? It’s not the end of something.
It’s just the beginning of a new monetary cycle.
— AD | Money Market Flow
📢 Join our community of serious traders.
Let’s grow, learn, and win together inside the MMFlow Trading Channel.
Tap in and be part of the flow.

GOLD Weakly - Technical GOLD has been trending higher in recent weeks, which indicating it surpassed $3,100 for the first time ever on March 28, 2025, driven by factors like Trump tariff uncertainty and a weaker US dollar. As of today, it’s likely consolidating or extending gains near this record high. Next Target for gold $3150 To $3200
#chart_sab_kuch_bolta_hai for your reference

How Gold Reacts During Economic Uncertainty!Hello Traders!
In times of fear, inflation, or recession — one asset often shines brighter than the rest: Gold .
Whether it’s due to geopolitical tensions, banking crises, or inflation spikes, gold has historically acted as a safe haven that protects capital when the broader markets get shaky.
If you look at the long-term chart of gold, you’ll notice a pattern — whenever the world panics, gold rallies hard. Let’s read the chart along with the logic
Why Gold Rallies During Uncertainty
1979–80: Oil Shock + High Inflation → Gold Spikes
Back then, inflation hit double digits, oil prices surged, and investors ran toward gold.
2008–2011: Global Financial Crisis
Bank collapses and money printing triggered a multi-year bull run in gold.
2020: COVID Pandemic Panic
Fear + liquidity = another sharp gold rally as investors looked for protection.
2023–25: Inflation, War Tensions, Banking Cracks
The most recent rally is no different. Sticky inflation, geopolitical tensions, and bank instability have once again pushed gold to new highs!
These major phases are clearly marked on the chart. Each rally followed a crisis — gold doesn’t rise randomly, it rises for a reason.
When Gold May Struggle
Strong Dollar Environment:
Since gold is priced in USD, a rising dollar often limits gold’s upside.
Rising Real Interest Rates:
When central banks hike rates aggressively and inflation cools, investors shift to bonds or savings for better returns.
Risk-On Sentiment:
During tech booms or bull markets, traders prefer equities over gold — causing consolidation or correction.
Rahul’s Tip
Gold is not always about profits — it's about protection.
When the world is calm, gold may rest. But when uncertainty hits, it roars.
Use it like an umbrella — not every day, but definitely when clouds appear.
Conclusion
Gold remains one of the smartest assets to watch during uncertain times.
From 1980 to 2025, the chart has told us one thing again and again — when fear enters the market, gold doesn’t just protect wealth — it creates wealth.
How do you use gold in your trading or investing? Drop your thoughts below!
Let’s discuss and learn together!

Gold Rallies Ahead of Critical PCE Report – Is a Reversal ComingAs expected, Gold reached a new all-time high (ATH) following the bullish momentum we anticipated yesterday.
However, this upside move seems to have arrived earlier than projected — potentially a pre-positioning move before a major correction triggered by tonight’s PCE inflation data and profit-taking ahead of the weekend.
With current momentum, Gold could easily target $3100 as global stock markets — from the US to Asia — are sharply declining.
This reflects rising concerns over a global economic slowdown, and highlights the growing demand for safe haven assets like Gold.
📰 Tonight’s PCE data will offer key insights into inflation in the current macro context.
If PCE inflation decreases, Gold is likely to continue its rally.
However, if PCE shows higher inflation, we could see heavy sell pressure enter the market — leading to a sharp drop in XAUUSD.
That said, recent CPI and PPI data suggest that inflation may already be easing, supporting the bullish case — or at least explaining the early price surge.
🟡 Strategy for Today:
Look for early BUY entries during Asia & London sessions at key lower supports.
Avoid SELL positions for now — wait for price to reach major psychological resistance levels like $3100 before considering a short setup.
🧭 Key Levels:
🔻 Support: 3064 – 3055 – 3048 – 3040 – 3032
🔺 Psychological Resistance: 3090 – 3100 – 3106 – 3110
🎯 Trade Zones – 29/03:
BUY ZONE: 3056 – 3054
SL: 3050
TP: 3060 – 3064 – 3068 – 3072 – 3076 – 3080 – ???
🔴 SELL ZONE: 3100 – 3102
SL: 3107
TP: 3096 – 3090 – 3086 – 3082 – 3078 – 3074 – 3070
🧠 Final Reminder:
It’s Friday — and PCE inflation data tonight is crucial.
If you feel unsure or your trading psychology is shaky, stay out and wait for clarity post-news.
As always, respect your SL/TP levels and protect your capital at all costs.
Good luck, homies! Let’s trade smart.
— AD | Money Market Flow

Gold (XAU/USD) Bullish Outlook: Key Levels & Trade Setup📊 Gold (XAU/USD) 1H Chart Analysis 📈
🔹 Current Price & Trend:
📍 Price: 3,077.46 USD
📈 Uptrend in play (Higher Highs & Higher Lows)
📊 9-period DEMA: 3,078.47 USD (showing bullish momentum)
🔹 Key Levels:
📍 Demand Zone (Support) 📥: 🟦 3,030 - 3,040 USD (Potential Buy Area)
📍 Fair Value Gap (FVG) ⚡: 🟦 Price may retrace here before continuing up
📍 Resistance Zone (Short-term) 🚧: 🟦 3,085.15 USD
🎯 Target Price: 🔵 3,110.09 USD
🔹 📉 Possible Scenario:
1️⃣ Price retraces to the FVG zone 🟦 (Healthy pullback)
2️⃣ 📈 Bullish continuation toward the 3,110 target 🎯

As quoted on 30th Jan 2025 3100 $ has finally being approched.As quoted on 30th Jan 2025 3100 $ has finally being approached.
The daily chart shows that Gold price has almost tested the ascending triangle target, measured at $3,080.
Therefore, a minor pullback cannot be ruled out in the near term. Additionally, the 14-day Relative Strength Index (RSI) has entered the overbought region, currently at 72.50, lending credence to the retracement outlook.
If a correction unfolds, the immediate support for Gold buyers is at the $3,050 psychological barrier, below which the March 26 low of $3,012 could be tested.
Further down, the $3,000 round level will emerge as a significant support level.
On the other hand, if buyers manage to hold ground, the next topside target is seen at the $3,100 threshold.
Fresh buying opportunities would emerge above that level, opening doors for an advance toward the $3,150 level.
XAUUSD analysisA clear divergence is visible on the chart while XAUUSD is making higher highs.
RSI is approaching the resistance line which means Gold prices have the space upside to stretch another high while breaking the recent higher high @3057.590
RSI rejecting the level of divergence will pull back the price.

Gold (XAU/USD) Bullish Breakout – Trade Setup & Key Levels🔍 Key Observations:
🔹 Trend Line Breakout:
📉⬇️ A downward trend line was broken, signaling a potential bullish reversal.
📈✅ The price has moved above the trend line, confirming the breakout.
🔹 Support & Resistance Zones:
🟦 Support Area: $3,000 - $3,010 (Buy Zone)
🟥 Resistance Area: $3,030 - $3,040 (Sell Pressure)
📊 Trade Setup:
✅ Buy Plan:
🔄 Wait for a pullback to the support zone (🟦 light blue area) before entering.
🎯 Target: $3,056.97 📈🏁
🛑 Stop Loss: $2,999.02 ❌🚨
📈 Indicators & Confirmation:
📊 DEMA (9-period) = $3,026.48 (near the current price, suggesting a neutral-to-bullish trend).
🔥 Conclusion:
🔵 Bullish Setup Active 🚀
⚠️ Wait for price reaction at support before entering.
❌ If price drops below $2,999, the setup is invalidated.
📌 Final Tip: Watch for a bullish candlestick pattern 📊 at support before executing the trade! 🎯

Gold short-term analysisGold has slightly risen and fallen back during the day, and the overall trend remains in a volatile trend. Gold is currently maintaining a narrow range of fluctuations on the daily trend, but the short-term moving average has begun to gradually diverge downward, and there are signs of weakening in the short term on the daily line. The 4-hour level trend is temporarily maintained in a volatile state, and the price is temporarily compressed between 3010-3038!
It is necessary to pay attention to the continued downward trend after a small break in the 4-hour level trend. In the small-level cycle trend, after touching the previous support band, there are signs of stabilization. Pay attention to the short-term adjustment.
From the overall situation, gold is definitely in the bull market stage. At present, there is strong buying defense at the 3000 mark, and the "W" double bottom has appeared below. If it successfully breaks through the 3035 watershed, it is expected to test the pressure near 3045 and the historical high of 3057. Now the low point of the callback begins to move up slowly, showing a small upward trend. Note that if 3038 breaks and stabilizes, it may continue to break upward in the short term. Follow the trend after the break!
Key points:
First support: 3016, second support: 3008, third support: 2993
First resistance: 3030, second resistance: 3038, third resistance: 3046
Operation ideas:
3010-3013, SL: 3002, TP: 3025-3035;
3036-3038, SL: 3049, TP: 3018-3010;
