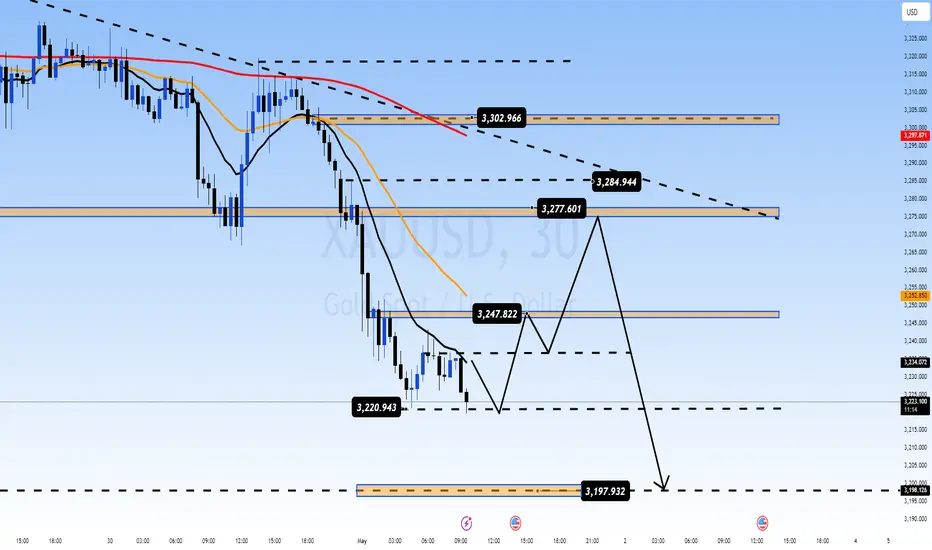
GOLD - Will FOMC and Tariff Talks Decide the Next Big Move?💥 GOLD WEEKLY OUTLOOK – Will FOMC and Tariff Talks Decide the Next Big Move?
As we head into a critical trading week, gold is at a crossroads, navigating through conflicting macro signals and important structural levels. Last week’s developments — ranging from strong US NFP data to China’s unexpected SGX:40B tariff waiver — have significantly reshaped sentiment in the precious metals market.
🌐 Macro Backdrop – Shift in Global Risk Tone
🔹 China’s Tariff Waiver on selected US goods hints at improving trade ties. This eases geopolitical risks and reduces the urgency for safe-haven assets like gold.
🔹 Stronger-than-expected NFP (Nonfarm Payrolls) further solidifies a hawkish bias for the Fed. A robust labor market may push the Fed to maintain higher rates for longer.
🔹 DXY & Bond Yields are holding firm. A stronger USD and rising yields typically weigh on gold — unless major risks re-emerge.
📌 FOMC Meeting This Week – Traders are now watching the Fed’s next move closely. Any dovish tone could fuel gold’s rebound. A surprise hawkish tone? Expect further selloffs.
🔍 Technical Landscape (H4 + Daily Focus)
Gold is currently forming a descending wedge pattern, with lower highs and solid support holding around the 3,224 – 3,204 zone.
Last week’s rejection at the 3,277 resistance aligns with macro-driven selling pressure. However, price continues to respect key Fibonacci levels and internal trendline dynamics, suggesting a potential for large breakout movement after FOMC.
🔺 Key Resistance Levels:
3,240
3,250
3,264
3,277
3,311
🔻 Key Support Levels:
3,224
3,210
3,204
🎯 Trade Plan – Week of May 6th, 2025
🔵 BUY ZONE A: 3,204 – 3,202
SL: 3,198
TP: 3,208 → 3,212 → 3,216 → 3,220 → 3,225 → 3,230
🔴 SELL ZONE: 3,276 – 3,278
SL: 3,282
TP: 3,272 → 3,268 → 3,264 → 3,260 → 3,250 → 3,240
⚠️ Key Risks to Monitor This Week:
🏛 FOMC Statement & Powell’s Press Conference
→ Any hint of rate cuts = Gold bullish
→ Any reaffirmation of higher for longer = More downside
💼 Trade Developments (US–China)
→ Further easing of tariffs = Negative for gold
→ Any new friction = Potential rebound
📉 DXY & Bond Yields
→ Keep an eye on Dollar strength. If DXY breaks above 106.5, gold may face deeper pressure.
🧠 Final Thoughts:
The gold market is no longer driven by one-sided risk-off flows. As macro tensions ease, gold is transitioning into a more range-bound, news-driven phase.
This week is all about reaction, not prediction.
Let the market come to your zone. Wait for confirmation before executing. The best trades come from discipline — not prediction.
📌 Follow this account for real-time updates during FOMC and Friday’s CPI preview.
Xauusdanalysis

NFP & White House Comments to Spark Heavy Volatility?🚨 Gold Pauses at Crossroads – NFP & White House Comments to Spark Heavy Volatility?
Gold is entering the US session with a quiet rebound after an intense selloff phase. Following its historic rally to $3,500/oz, the yellow metal has come under significant pressure — not from fundamentals alone, but from massive profit-taking across Asia, especially from retail investors in China.
Such sharp pullbacks are not abnormal after parabolic runs. Instead, this pullback seems like a healthy technical reset before the market processes two major catalysts later today:
1️⃣ The US Nonfarm Payrolls report (May edition)
2️⃣ Official White House comments on tariffs and trade direction
Together, they’re likely to dictate where Gold is heading next — either a retracement deeper into the demand zones, or a renewed upside attempt toward recent resistance.
📊 DXY & Macro Lens:
The US Dollar Index (DXY) has rebounded strongly from its base near 98.xx, now reclaiming levels near 100.00. Whether it continues higher depends largely on labor data and economic signals from the White House tonight.
For now, traders should remain neutral-biased but responsive — and treat every key level with surgical precision. Use the H1–H2 timeframe for intraday bias and structure-based execution.
🔺 Key Resistance Levels:
3260
3275
3285
3312
🔻 Key Support Levels:
3244
3230
3215
3200
🎯 Trade Plan for Today – May 3rd, 2025:
🔵 BUY ZONE A: 3232 – 3230
SL: 3226
TP: 3236 → 3240 → 3244 → 3248 → 3252 → 3256 → 3260
🔵 BUY ZONE B: 3214 – 3212
SL: 3208
TP: 3218 → 3222 → 3226 → 3230 → 3235 → 3240
🔴 SELL ZONE: 3276 – 3278
SL: 3282
TP: 3272 → 3268 → 3264 → 3260 → 3250
⚠️ Final Notes:
Volatility today could spike sharply during the US session. With nonfarm data + political headlines colliding at once, this is the kind of session where fortunes are made — or lost.
📌 Avoid emotional trades. Let price reach your zones, wait for confirmation, and stick to your TP/SL rules like a professional.
🚀 The real move hasn't happened yet — but it's coming.
Be ready. Be sharp. Trade with discipline.

HEAD & SHOULDERS IN GOLD - WATCH THAT NECKLINESymbol - XAUUSD
CMP - 3288
Gold, after a sharp decline, is now trading and consolidating at important levels. The recent movement follows a strong sell-off as geopolitical and tariff-related issues between the US and China began to ease. This decline pushed gold back from its all-time high of 3500, with the metal currently hovering near key support.
The market remains cautious, with attention shifting toward potential shifts in FED policy and broader macroeconomic cues.
A Head & Shoulders pattern is in formation, with gold currently testing its neckline around the critical support zone of 3300–3287. A breakdown and retest of this level may trigger further downside momentum, potentially opening the path toward 3220 and 3075 on a positional basis.
Key Resistance Levels: 3300, 3317
Key Support Levels: 3288, 3215, 3122, 3075
From a technical perspective, gold remains within a corrective structure, maintaining a bearish outlook. Attention is now on the Head & Shoulders neckline - if it breaks to the downside and retests, short positions can be initiated.

Gold (XAU/USD) Trade Plan – Daily TimeframeGold ( FXOPEN:XAUUSD ) has finally broken below the lower boundary of the rising channel after a strong bullish rally that peaked above $3,450. Today's bearish candle closed below the trendline support, indicating potential short-term weakness.
🔍 Technical Highlights:
Breakdown from Rising Channel
Price has broken below the lower channel, hinting at a short-term reversal or deeper pullback.
Immediate Support Zones
Watch the horizontal zones around $3,194 and $3,168 – these could act as short-term supports.
Further Downside Targets
If these levels break, next major supports lie at $3,055 and $2,972.
💡 Trade Ideas:
Bearish Bias Below $3,220
Look for short entries if price retests and rejects the lower channel boundary.
Target Levels: $3,168 > $3,055 > $2,972
Invalidation: Daily close back above $3,250 would negate the bearish setup.
⚠️ Risk Management:
Always manage risk with stop-loss orders and proper position sizing. Volatility remains high, so wait for confirmation candles or retests.

Gold’s Calm Before the US Data Storm – Are You Ready?Consolidation Continues Amid Global Holidays – Is Gold Gearing Up for Another Leg?
🌐 Fundamental Insight:
After last week’s historic rally toward $3,500/oz, gold has entered a cooling phase as markets digest evolving geopolitical developments and economic signals. The recent de-escalation in US-China trade tensions, triggered by President Trump’s plan to ease tariffs on auto parts and imports, has reduced immediate risk sentiment.
China’s response — lifting retaliatory duties on select US goods — further eased tensions, leading to a safe-haven selloff in precious metals. However, with uncertainty still looming ahead of this week’s US labour data (ADP + NFP), investors remain cautious.
Adding to this, today’s Bank Holidays in parts of Asia and Europe are contributing to reduced trading volumes. A sideways market with erratic moves is likely until the US session opens, where higher volume and stronger direction may emerge.
🔍 Technical Picture (H1 – H4 Outlook):
Gold is currently forming a compression pattern between the 3278 resistance zone and the 3196 demand area. Price is holding above key structure support near 3192, indicating buyer interest remains intact.
The market may continue to oscillate in this tight intraday range before US traders step in. All eyes are now on upcoming ADP employment data — often a lead indicator for Friday’s NFP — which could provide the next directional push.
🔺 Key Resistance Zones:
3248
3260
3278
🔻 Key Support Zones:
3230
3225
3215
3196
🎯 Trade Strategy – April 30
🔵 BUY ZONE: 3198 – 3196
Stop-Loss: 3192
Take-Profits: 3202 → 3206 → 3210 → 3215 → 3220 → 3225 → 3230
🔴 SELL ZONE: 3276 – 3278
Stop-Loss: 3282
Take-Profits: 3272 → 3268 → 3264 → 3260
🧠 Note: Short-term traders may consider scalping within the range, while swing traders can wait for a break and retest of either key zone before committing with volume.
⚠️ Things to Watch Today:
Thin liquidity due to Labour Day holidays across Asia & Europe
ADP report release in the US session (potential volatility spike)
End-of-month candle close — watch out for liquidity grabs and false breakouts
US 10Y bond yields and DXY movements will continue to influence gold sentiment
📌 Final Thoughts:
Gold is in pause mode, but not for long. The market is clearly building energy ahead of high-impact US data. With the broader trend still bullish and structure holding above 3190s, we stay cautiously optimistic — but flexible.
Risk management will be critical today. Expect the unexpected during low-volume sessions and be prepared for sharp moves when the US opens.
📈 Stay disciplined. Respect your zones. And let the data lead the way.
WAITING GAME - GOLD STUCK IN A HOLDING PATTERNSymbol - XAUUSD
CMP - 3307
Gold continues to consolidate within a defined range, with immediate attention on the 3370–3269 zone. With key economic data scheduled for release, the metal is expected to remain within this consolidation band for the next several sessions.
Renewed optimism surrounding US trade negotiations has lifted risk sentiment and strengthened the US dollar. The US Treasury Secretary reported constructive progress in discussions with India, while President Trump’s more measured rhetoric regarding China further supported the dollar. Meanwhile, investors are adopting a cautious, wait-and-see approach ahead of the release of first-quarter US GDP data. Should the data underwhelm, gold may experience a sharp uptick as safe-haven demand intensifies.
Overall, the gold market remains highly reactive to trade headlines and macroeconomic indicators, particularly amid anticipated portfolio adjustments at month-end. In the context of current momentum and corrective movement, a short-term recovery is anticipated from the 0.5–0.7 Fib zone. A possible retest of the 3323–3325 resistance area could precede a continuation of the correction within the prevailing consolidation structure.
Key Resistance Levels: 3323, 3352, 3370
Key Support Levels: 3290, 3270
Traders remain attentive to both the resolution of ongoing tariff disputes and the forthcoming economic releases. While price action remains confined within a consolidation pattern, a rebound from support is the base case scenario. However, if price action continues to compress toward either boundary - particularly toward support, the probability of a breakout from the consolidation base may increase accordingly.

XAU/USD Outlook – Will This Tight Range Explode Soon?🔥 XAU/USD Outlook – Will This Tight Range Explode Soon?
📊 Technical Overview:
Gold (XAU/USD) has entered a consolidation phase after last week's sharp swings. The market is currently trapped within a tightening structure between 3,274 and 3,336, forming a potential wedge or triangle pattern. This type of structure often precedes a breakout.
Price is still hovering below the 200 EMA on the H1 timeframe, while key support zones are starting to show signs of buying interest. A hold above 3,301 could lead to a potential rally toward the upper resistance levels at 3,352 – 3,366.
🔺 Key Resistance Levels:
3,336.767
3,352.159
3,357.689
3,366.067
🔻 Key Support Levels:
3,301.370
3,291.885
3,274.779
🎯 Trade Setups:
🔵 BUY ZONE:
Entry: 3,274 – 3,276
SL: 3,270
TP: 3,284 – 3,291 – 3,301 – 3,336
🔴 SELL ZONE:
Entry: 3,357 – 3,366
SL: 3,370
TP: 3,336 – 3,301 – 3,291
📰 Today’s Market Focus:
No major economic data is expected today. However, markets may begin pricing in expectations ahead of this week’s key releases — ADP Employment Change and Nonfarm Payrolls (NFP).
Geopolitical tensions in South Asia and statements from FED officials may act as surprise catalysts for gold volatility.
🧭 Conclusion:
Gold remains stuck in a tight sideways channel. Traders should continue range trading while waiting for a confirmed breakout. A strong breakout above 3,366 or breakdown below 3,274 will set the tone for the next directional move.
👉 Trade smart and manage your risk. All eyes on U.S. data and geopolitical headlines!

XAU/USD Elliott Wave Count: Preparing for Final ImpulseXAU/USD appears to be in a textbook 5-wave impulsive structure on the 4H chart, with the market now completing Wave 4 as a classic ABC corrective flat/pennant.
The impulsive move from the Wave 2 low has formed clear internal substructures, with Wave 3 exhibiting extended price action, consistent with Elliott Wave guidelines.
Currently, price is consolidating in a contracting pattern labeled Wave 4 (A-B-C), which looks to be near completion. Based on wave symmetry and Fibonacci projections, a strong upside move is anticipated once Wave 4 concludes, leading into the final Wave 5 rally.
Entry Zone: 3286.875
Target: 3367.440– 3410.210
Stop Loss: Below 3260.190.

> "Gold (XAU/USD) - Demand Zone Bounce Targeting 3500 "Current Price: $3,319.59
Indicator: 70 EMA at $3,324.95 ➡️ 📈 (still slightly above price = bearish pressure)
---
Main Observations:
🔵 Demand Zone (📦 Buyers' Area):
Between $3,253 - $3,280
Every time price dips here ➡️ buyers react!
✏️ Descending Trendline:
⬇️ Short-term trend is bearish
Price is trying to break above it now (watch closely!)
🎯 Target Point:
$3,500 🏹 (Big upside if breakout succeeds!)
🛡️ Stop-Loss:
$3,253 🔥 (just below the demand zone = good protection)
Trade Idea:
✅ Buy near demand zone 🔵 after breakout confirmation 📈
✅ Target: $3,500 🎯
✅ Stop-Loss: $3,253 🛡️
Quick Dots Summary:
🔵 Demand zone is strong (buyers defending)
🔻 Still under 70 EMA (bearish until breakout)
✏️ Watching for breakout of trendline = key signal
🎯 Massive Risk:Reward ratio if it works
⚡ If no breakout and price falls, stop-loss saves capital.

Gold Retreats as Trump’s Trade Talk Flip Sparks CautionGold Retreats as Trump’s Trade Talk Flip Sparks Caution – Friday Volatility Expected 💥📉
🟡 Market Recap & Sentiment
Gold prices jumped over 1% this week, reaching around $3,500/oz, as investors sought safe-haven assets amid a weakening USD and global uncertainty. However, analysts believe this Price surge is driven by greed and needs a healthy correction.
“Gold might consolidate in the near term, but we’re still in a bull market. Dips will be bought,” said analyst Wong.
Meanwhile, the US Dollar and equities are losing their appeal as investors digest contradictory signals from President Trump. He confirmed that US-China trade negotiations are ongoing, while China denied any talks – sending shockwaves across markets and triggering a sharp pullback in gold during the Asian session.
This political flip-flop is adding confusion, and traders are advised to stay cautious before jumping into any positions.
📉 Fundamental Triggers Today
Core Retail Sales (US) – releasing later today during the US session.
It’s also Friday – which means potential for weekly candle closure volatility and liquidity grabs.
Coupled with the ongoing tariff headlines and geopolitical drama, today could be extremely unpredictable.
📍 Key Levels to Watch
Resistance: 3366 – 3384 – 3406 – 3428 – 3445
Support: 3308 – 3288 – 3270
🔹 Trade Setup Suggestion
🔸 BUY ZONE: 3288 – 3286
SL: 3282
TP: 3292 – 3296 – 3300 – 3304 – 3310
🔸 BUY ZONE: 3270 – 3268
SL: 3264
TP: 3274 – 3278 – 3282 – 3286 – 3290
🔻 SELL ZONE: 3384 – 3386
SL: 3390
TP: 3380 – 3376 – 3372 – 3368 – 3364 – 3360 – ???
🔻 SELL ZONE: 3406 – 3408
SL: 3412
TP: 3400 – 3396 – 3392 – 3388 – 3384 – 3380 – 3370 – 3360
⚠️ Risk Management Reminder
Be cautious today – it’s a Friday with major data and geopolitical uncertainty.
✅ Always respect TP/SL levels.
✅ Let the market show confirmation before entering positions.
Sit tight and let the market come to your zone – don’t rush in with FOMO during uncertain sentiment.

XAUUSDOANDA:XAUUSD
As you can see that gold has created head and shoulder if the the drawn support was broken down side then we can go for sell side. plan your trade accordingly

Gold Surge: 80 Price Bounce from Key Support Gold Surge: 80 Price Bounce from Key Support – What’s Next for the Market? 💰📈
Market Overview:
Gold has surged by 80 pips today, bouncing from the support level at the end of the U.S. session yesterday after liquidity was swept at the 3260 zone. Investors are now looking to buy the dip after the 250+ pip drop in gold over the past few days. Currently, after the strong 80 pip rally, gold is consolidating at the 0.382 Fibonacci retracement zone, with selling pressure mounting.
Key Price Levels to Watch:
Resistance: 3343, 3358, 3376, 3410, 3446
Support: 3210, 3286, 3275, 3230
Market Sentiment:
There’s a strong sell reaction at current levels, which suggests that the price could continue to push lower in both the Asian and European sessions to fill liquidity in the Fair Value Gap (FVG). After the 80 pip rally and 40 pip reaction, the market seems to be consolidating between 3328 and 3320. We expect a price movement range of 80-100 pips today, so caution is advised, especially around key levels at 3376-3378, where a potential sell can be placed.
Next Potential Movements:
If gold fails to break through the 3376-3378 resistance zone, we could see a continuation of the downward move. If the 3376-3378 zone holds strong, this could be a good opportunity to sell.
Should the price break through this zone, we’ll observe the next key resistance around 3410. A break above 3410 could signal a reversal to the upside, turning the trend into a BUY instead of SELL.
Today's Strategy:
For today, the focus will be more on SELL opportunities as gold pushes back to fill the FVG liquidity around 3288. Once we see how the price reacts at these levels, we can start planning for BUY entries.
Watch out for Unemployment Claims data from the U.S. later in the session, as this could trigger volatility. Be cautious when trading around news events, especially in a sensitive market.
Trade Setup:
BUY ZONE: 3230 - 3228
SL: 3224
TP: 3234 - 3238 - 3242 - 3246 - 3250 - 3254 - 3260
SELL ZONE: 3376 - 3378
SL: 3382
TP: 3372 - 3368 - 3364 - 3360 - 3355 - 3350
SELL ZONE: 3408 - 3410
SL: 3414
TP: 3402 - 3398 - 3394 - 3390 - 3386 - 3382 - 3375 - 3370
Risk Management:
It’s important to manage your risk appropriately given the current market conditions. Ensure you’re following your TP/SL levels strictly to protect your capital from market volatility.

Gold Faces 200 Pips Drop – Will It Recover or Continue Falling?Gold Faces 200 Pips Drop – Will It Recover or Continue Falling? 🔥📉
Market Overview:
Gold (XAU/USD) saw a sharp drop of nearly 200 pips yesterday, falling from the historic high of around $3500 to $3318. This marks the strongest correction in the recent bullish trend. The market is currently volatile, and the question is whether gold will find support at lower levels or continue its downward movement.
What’s Causing the Drop?:
Fed Rate News: The latest news from the Federal Reserve triggered strong profit-taking, which resulted in the sharp decline.
USD Technical Rebound: The USD has rebounded after significant losses, putting pressure on gold.
Market Sentiment Shift: Investor sentiment changed rapidly, leading to mass sell-offs.
Key Levels to Watch:
Support: 3300-3320 (Critical level for a potential bounce)
Resistance: 3378-3380 (Key resistance area)
Next Steps for Gold:
Support at 3300-3320: If gold holds above this range, a strong recovery could follow.
Break below 3300: A breakdown below 3300 may lead to further declines, potentially towards the next support at 3250.
Trading Strategy:
SELL ZONE:
3378 - 3380
SL: 3384
TP: 3374 - 3370 - 3366 - 3362 - 3358 - 3350
SELL ZONE:
3408 - 3410
SL: 3414
TP: 3404 - 3400 - 3396 - 3392 - 3386 - 3380
BUY ZONE:
3292 - 3290
SL: 3286
TP: 3296 - 3300 - 3304 - 3308 - 3312 - 3316 - 3320
Important Notes:
Risk Management: Due to high volatility, make sure to use appropriate stop losses (SL) and take profits (TP).
Watch for Key Levels: Pay close attention to the 3300-3320 zone for signs of a potential bounce or further breakdown.
Adapt to Market Movement: Given the uncertainty, stay flexible and adjust your strategy accordingly.
Conclusion:
Gold’s market is in a highly volatile phase. Key support and resistance levels will determine the next move. Keep a close eye on market reactions and act accordingly.

GOLD PEAKS, BEARS PEEK IN - CORRECTION KICKS INSymbol - XAUUSD
Gold, having recently reached the psychologically significant level of 3500, has entered a corrective phase. This movement was partially driven by a slight de-escalation in the trade tensions between the United States and China.
Following a decline that did not reach the key support zone at 3288, gold prices began to rebound in early European trading hours, as market participants await the release of US PMI data. The precious metal had previously recorded an all-time high of 3500 but subsequently retreated, influenced by optimism surrounding potential easing in the US - China trade dispute.
The US dollar has also shown signs of recovery amid this correction. However, investor confidence remains cautious due to concerns over the unpredictability of President Trump. During this period of uncertainty, gold continues to consolidate in a corrective pattern.
Attention is now focused on the upcoming S&P Global PMI release, which may shape expectations for future adjustments in the US FED’s interest rate policy and influence the broader market direction.
Key Resistance Levels: 3340, 3360, 3366
Key Support Levels: 3317, 3288
From a technical perspective, gold remains within a corrective structure, maintaining a bearish outlook. Nonetheless, any unexpected statements from Trump could trigger renewed speculative buying. At this stage, a potential pullback from the 3340-3366 resistance range is plausible. Long positions may be considered either on a confirmed retest of support levels or upon a decisive breakout and close above 3370

(XAU/USD) 1H Chart – Bullish Reversal Setup from RBS + RBR Zone1. Current Price:
$3,317.27
● Price is currently in a downtrend after a recent high.
● EMA (9) is at $3,333.80 — acting as dynamic resistance.
⚠️ Watch for potential reversal!
2. Support Zone:
📦 Blue box marked as "RBS + RBR zone!"
● This is a key support area where price might bounce.
● RBS = Resistance Becomes Support
● RBR = Rally-Base-Rally
● Expecting buyers to step in here.
3. Trade Idea:
● Buy near $3,280 - $3,270 (inside the support box)
● Stop Loss: ❌ Below $3,258.00
● Target: 🎯 $3,500.13
4. Risk-Reward Ratio:
● Target: 🟦 +205.62 points (6.25%)
● Stop: 🔻 Small risk below support
● Good R:R setup if price respects the zone!
Scenario Summary
📉 Price is retracing
⬇️ Approaching strong support zone
📈 Possible bounce to $3,500
✅ High-probability reversal area
❗ Manage risk with tight stop below zone

"(XAU/USD) Bullish Setup: Demand Zone Bounce with 5.89% tgr ptnl🔵 Current Price: $3,451.03
🟡 EMA (9): $3,457.20
🔻 Price is just below EMA — short-term pressure.
Zones & Key Levels:
🟦 Demand Zone:
🔽 Price bounced here before — strong buyer interest!
📍 Zone Range:
* Top: $3,442.38
* Bottom (Stop Loss): $3,395.87
* 🔴 Stop Loss set here to limit risk.
🟨 Entry Point:
* Entry suggested at $3,457.20
* Just above the current price and EMA — needs confirmation
* ⚠️ Wait for bullish candle or price action signal above EMA
🟩 Target Point:
🎯 Target: $3,645
* 📈 Potential gain: +202.78 pts (5.89% upside)
* 🚀 Aiming to break previous ATH (All-Time High)
Visual Trade Plan Summary:
* ✅ Buy Entry: $3,457.20
* ❌ Stop Loss: $3,395.87
* 🎯 Target: $3,645.00
* ⚖️ Risk-to-Reward: Solid, over 3:1
Sentiment:
* If price respects demand zone and reclaims EMA — bullish setup
* 🕵️♂️ Watch for volume or confirmation candle near entry

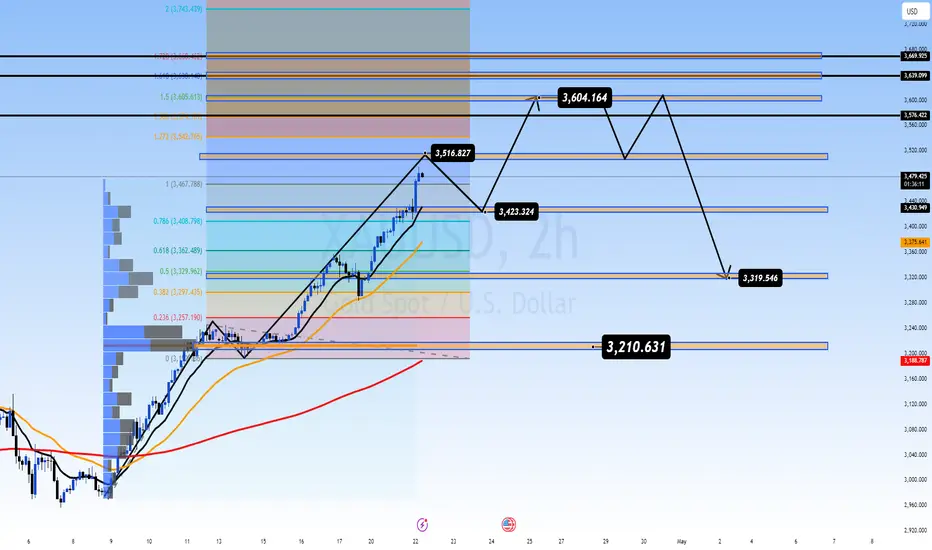
GOLD SMASHES $3,450 – THE FINANCIAL RESET IS HERE! GOLD SMASHES $3,450 – THE FINANCIAL RESET IS HERE!
🔥 The Unstoppable Surge 🔥
Gold explodes past $3,450 as Chinese markets open – a $100/day spike!
In just 2 weeks, gold has soared $500 – this isn’t a rally, it’s a SUPERCHARGE!
Chinese capital is flooding into gold – they’re the Big Boy driving this wave.
💵 USD in Freefall – The Great Escape 💵
DXY crashes hard – the USD is bleeding value.
Money is fleeing the U.S. – investors are ditching the old system.
Gold isn’t just rising – it’s a signal of retreat from the USD and the legacy financial order.
📈 Technical Breakdown 📈
Gold is testing $3,519.546 – a critical resistance (see chart).
Next support at $3,210.631 if we see a pullback.
Fibonacci levels highlight key zones – $3,416.132 as a potential retest.
Momentum is insane – this could be the start of a global market reset.
🌍 What’s Next? 🌍
If gold holds above $3,450, we’re looking at $3,600+ soon.
A financial game reset is looming – are you ready?
Chart Analysis: Gold’s 2H chart shows a parabolic move with heavy volume from Chinese buyers. The trend is clear – this is a structural shift, not a blip.
⚠️ Key Levels to Watch
Resistance: $3,519, $3,601
Support: $3,416, $3,210
Breakout Target: $3,600+
BUY ZONE 3424 - 3422
SL: 3418
TP: 3428 - 3432 - 3436 - 3440 - 3450
SELL ZONE: 3604 - 3606
SL: 3610
TP: 3600 - 3596 - 3592 - 3588 - 3584 - 3580
Buying Opportunities Based on Key Support and Resistance LevelsGold Strategy for Today: Buying and Selling Opportunities Based on Key Support and Resistance Levels 📈💰
Market Overview:
Gold (XAU/USD) is currently trading in a narrow range, with slight pullbacks but maintaining its upward trend. Below are the key levels that traders should pay attention to today:
Key Support Levels:
3,353.708: A strong support level, potentially a good buy entry if gold pulls back to this level.
3,334.067: Another support zone to keep an eye on for potential bounce if buying pressure remains strong.
Key Resistance Levels:
3,412.327: The primary resistance level; if gold breaks above this, it could continue pushing upwards.
3,419.386: The next significant resistance zone; watch for price action around this level.
Trading Strategy:
BUY ZONE:
3,353 - 3,334
SL: 3,328 (Stop loss to ensure protection)
TP: 3,368 - 3,380 - 3,390 - 3,400 - 3,420
SELL ZONE:
3,412 - 3,420
SL: 3,430 (Stop loss to ensure protection)
TP: 3,400 - 3,390 - 3,380 - 3,370 - 3,360
Outlook:
Gold is still in a strong uptrend, with key support levels at 3,353 and 3,334 providing good buying opportunities. However, as the price approaches resistance levels at 3,412 and 3,419, caution is advised when selling if the price fails to break through and continues higher.
Short-Term Strategy:
During the Asian and European sessions, traders can look for buy opportunities at the nearest support levels if the price pulls back while maintaining its upward momentum.
If the price reaches key resistance zones, consider selling with clear reversal signals.
Important Reminder:
Always stick to your TP/SL levels to ensure risk management and avoid large losses during volatile market conditions.

GOLD’S IN OVERDRIVE - MISSED THE TRAIN? WAIT FOR THE NEXT STOP!Symbol - XAUUSD
CMP - 3330
Gold remains in a strong upward trend, consistently reaching new all-time highs. Entering a rapidly advancing market without sufficient opportunity to assess risk is inadvisable. Therefore, engaging in the current momentum without a confirmed technical setup is not recommended. A potential price correction ahead of upcoming US retail sales data and a speech by Federal Reserve Chair Jerome Powell may provide a more favorable environment to identify trading opportunities.
The rally is being driven by several fundamental factors, including robust economic data from China, increased demand for safe-haven assets amid escalating geopolitical tensions, and trade uncertainties between the US and China. Further upward momentum is being supported by ANZ’s revised forecast, which projects gold prices could reach $3,600 by year-end.
From a technical standpoint, the psychological resistance zone between $3330 and $3350 is of particular interest, where a pullback may be expected. The preferred strategy would be to await a correction toward local or intermediate support levels before considering long positions.
Key Resistance Levels: 3330, 3350
Key Support Level: 3275, 3265, 3244
Given the strength of the prevailing bullish trend, breakout strategies above resistance levels may be effective. However, such an approach requires clear price consolidation, which is not currently present. Alternatively, a more prudent strategy would be to wait for a retracement, a confirmation of support, and then consider initiating long positions.

"Gold Demand Zone Bounce – High R:R Long Setup!"📈 This is a bullish setup using a demand zone bounce strategy on the 15-minute timeframe.
Key Zones & Levels
🔵 Demand Zone:
The blue box is where price previously bounced strongly.
Buyers are likely to step in again here.
✳️ Entry Point:
3,292.38
Just above the demand zone – a safe place to catch the next bounce.
⛔ Stop Loss:
3,280.93
Below the demand zone to protect against a breakdown.
🎯 Target Point:
3,345.09
Near a previous resistance area.
Potential gain: +51.94 pts / 1.58%
Indicators
🟡 EMA (7):
Current value: 3,303.63
Price hovering around EMA = consolidation or setup for a bounce.
Risk-Reward Calculation
⚠️ Risk: 11.45 points
✅ Reward: 52.71 points
⭐ Risk-Reward Ratio: ~4.6:1
Very favorable!
Price Action Summary
📊 Strong uptrend into demand zone
🔁 Minor pullback = potential setup
✅ Ideal entry after bullish confirmation (e.g., bullish candle pattern)
Conclusion
This setup looks solid:
✅ Clear demand zone support
✅ High R:R ratio
✅ Clean target above
Just wait for a bullish signal inside the zone and ride it up!

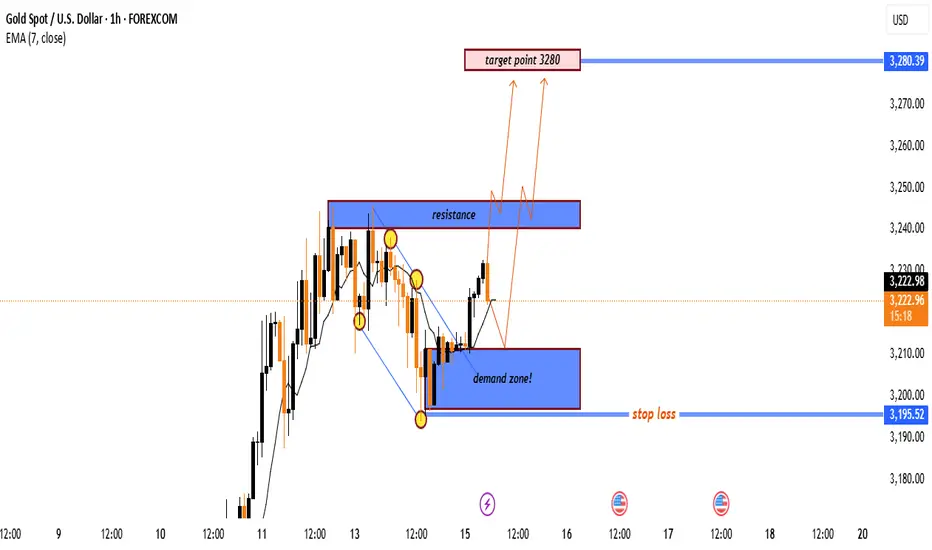
"Gold Bullish Setup: From Demand Zone to 3280 Target!"🟦 Key Zones
🔵 Demand Zone (Support):
📍 Around 3,210 – 3,200
🟢 Buyers stepped in here previously, forming a base for a potential upmove.
🔴 Resistance Zone:
📍 Around 3,240 – 3,250
🚫 Sellers have rejected price from this level several times.
🎯 Target Point:
📍 3280
🚀 If price breaks resistance, this is the expected move.
❌ Stop Loss:
📍 3,195.52
🛡️ Placed just below the demand zone to minimize downside risk.
📊 Price Action & Indicators
* 🟠 Current Price: 3,225.32
* 📉 EMA (7): 3,223.57 – providing dynamic support
* 🔼 Trend: Short-term uptrend with higher lows
🧠 Trade Idea
* ✅ Entry: Around 3,220–3,225
* ❌ Stop Loss: 3,195.52
* 🎯 Take Profit: 3,280
* 📌 Risk-Reward: Favorable if resistance breaks
📈 Possible Scenarios
🔸 Scenario 1:
✨ Immediate breakout through resistance → target 3,280
🔸 Scenario 2:
🔁 Pullback to demand zone → bounce → then move toward 3,280
Gold Hits New ATH Amid Escalating US-China Tensions Gold Hits New ATH Amid Escalating US-China Tensions 💰📈
The market has become more sensitive than ever as investors are deeply influenced by decisions from the world’s most powerful leaders. The ongoing tensions between Trump and Xi Jinping are causing uncertainty, making gold the natural safe-haven asset for investors seeking refuge.
At this point, the question is no longer whether gold will rise or fall, but rather how far it can go with geopolitical tensions still high and escalating daily. A retaliatory decision could cause gold to spike by dozens of points, while a temporary halt in tariffs could lead to a sharp drop. The market is incredibly sensitive to economic policy decisions and political developments right now.
Currently, candle confirmations are less reliable, as bullish confirmations are often followed by sudden reversals. This makes it crucial to focus on key levels and avoid rushing into trades. Scalping should be done with caution, and identifying clear entry points is vital.
Key Support Levels:
3280, 3268, 3258, 3240, 3230
Key Resistance Levels:
3292, 3302, 3310
Trade Strategy:
SELL ZONE: 3302 - 3304
SL: 3308
TP: 3298 - 3294 - 3290 - 3286 - 3280
BUY ZONE: 3270 - 3268
SL: 3264
TP: 3274 - 3278 - 3282 - 3286 - 3290 - 3300
BUY ZONE: 3240 - 3238
SL: 3234
TP: 3245 - 3250 - 3255 - 3260 - 3264 - 3268 - 3274 - 3280 - OPEN
Risk Management: As mentioned above, the market is extremely sensitive and unpredictable right now. Please remain cautious, and always adhere to your TP/SL levels to protect your account. 🛡️

Strong Breakout and Continuation Within Sideways RangeGold Analysis: Strong Breakout and Continuation Within Sideways Range 💰📈
Gold (XAU/USD) made a strong move within its sideways range after breaking down below the 3215 level. At the start of the Asian session, gold bounced back and is now maintaining an upward movement within the range from 3245 to 3215, forming a small upward channel on the M15 timeframe. This is a clear continuation of the bullish trend.
Key Support Levels:
3215, 3204, 3195, 3188, 3178, 3168
Key Resistance Levels:
3235, 3245, 3257, 3272
The buying pressure remains strong, especially at the recent support level of 3196, where we saw a quick response of 30 pips back up. There is still significant buying interest below these levels, just waiting for the right opportunity for another entry.
Today's Strategy:
With no major U.S. news expected today, the price range is likely to be similar to yesterday, with a move of about 30-40 pips. We are waiting for a pullback to buy again, and will avoid sell signals in the current market environment. Even if we anticipate a drop, the focus should be on buying at good support levels rather than selling too early.
Trade Setup:
BUY ZONE: 3196 - 3194
SL: 3190
TP: 3200 - 3204 - 3208 - 3212 - 3216 - 3220 - 3225 - 3230
SELL ZONE: 3244 - 3246
SL: 3250
TP: 3240 - 3236 - 3232 - 3228 - 3224 - 3220
Important Reminder:
If gold fails to break the 3135 level, consider selling back to the 311x zone. If the price reaches 3135 and continues to show strong buying pressure, wait for a potential push towards 3145 and consider selling if the previous resistance holds. Always stick to your TP/SL levels to ensure risk management.
Final Thoughts:
AD expects a pullback or correction during the end of the Asian session or at the beginning of the European session, providing an opportunity to buy at better levels. Avoid buying at uncertain levels and wait for the ideal pullback.
Trade Safely and manage your positions with clear TP/SL targets. Always prioritize risk management to protect your account.
