BTCUSD 45m – Pennant Breakout Setup Toward 100k Target1. Pattern Formation: Bullish Pennant
The chart shows a pennant, formed after a sharp downward move followed by price compression.
The upper trendline is descending, the lower trendline ascending, converging into a tightening triangle.
This is typically a continuation pattern, but because the preceding move was downward, traders will often wait for confirmation from the breakout direction.
2. Breakout Attempt
The price is breaking slightly above the upper trendline, marked as ENTRY.
This suggests a potential bullish breakout, but:
The breakout candle is still small.
Ideally, you’d want volume confirmation (not shown in the image).
3. Stop-Loss Placement
The STOP LOSS is placed safely under:
The lower pennant trendline
Recent consolidation lows
This gives a logical invalidation level—if price drops below this, the breakout has failed.
4. Target Projection
The target of $100,006 is consistent with a measured move calculation:
Height of the initial impulse (the pole)
Added to the breakout point
On your chart, the projected move equals about +10%, also labeled on the right.
5. Risk–Reward
The setup shows good R:R, since:
Stop-loss is close
Target is distant
However, pennants can generate fakeouts, so caution is warranted.
6. Market Context (from the chart only)
Current price around $95,984.
The overall trend in the 45-minute view appears mixed:
Strong drop earlier
Stabilization
Compression
The breakout direction will determine the next phase.
Xauusdidea

Elliott Wave Analysis – XAUUSD | 14/11/2025
1. Momentum
D1 Timeframe:
Daily momentum is showing clearer signs of reversal. We need to wait for today’s close for confirmation. If D1 momentum truly reverses, I expect a strong bearish move next week.
H4 Timeframe:
H4 momentum is preparing to turn upward, so a short-term bullish move may appear on this timeframe.
H1 Timeframe:
H1 momentum is getting ready to reverse downward, so I expect a decline from the current H1 structure.
________________________________________
2. Wave Structure
D1 Wave Structure
Price is still forming wave X. Yesterday’s D1 candle was bearish but not very strong. Today, we want to see another strong bearish candle to further confirm the possibility of a new decline on the daily timeframe. For now, we continue to observe today’s market reaction.
________________________________________
H4 Wave Structure
On the H4 chart, we’re seeing two strong bullish candles, which is not what we want to see if the market is forming a top. A proper top should show strong downward momentum, while the pullback should appear as short-bodied candles.
We now wait for the upward reversal of H4 momentum:
• If price breaks above the high, it suggests the current high is not the real top but only a temporary corrective move, and the market may form a new higher high.
• If price does not break the high, then once H4 momentum reverses downward, we can expect a stronger and deeper decline.
(This section keeps your original meaning exactly, with smoother wording.)
________________________________________
H1 Wave Structure
The recent decline resembles a clear 3-wave structure, creating three possible scenarios:
3 Possible Scenarios
Scenario 1 – Correction Completed
If the recent decline is a completed 3-wave structure, the correction may already be over. Combined with H4 momentum preparing to rise, price may form a new high once H4 enters overbought territory.
________________________________________
Scenario 2 – Wave A of a Flat or Triangle
If the decline is only wave A, then a larger Flat or Triangle correction may be forming.
• Price may revisit 4248 when H4 momentum reaches overbought.
• After that, price may decline again but not deeply:
o Flat: drop toward 4145 (wave A low).
o Triangle: a shallower drop.
• After completing this correction, price will begin a new upward swing.
________________________________________
Scenario 3 – Beginning of a 5-Wave Decline
If the previous drop was wave 1 of a 5-wave bearish sequence:
• The current rise is wave 2, meaning price must not break 4248.
• When H4 reaches overbought and consolidates below the peak, price may drop sharply into wave 3.
• Another possibility: H4 and H1 momentum “stick together”; once H1 reverses downward, price may fall aggressively — a typical wave 3 characteristic.
________________________________________
4. Overall Bias
While multiple scenarios are listed for monitoring,
our primary expectation remains bearish, based on signals observed over the past several days.
________________________________________
🎯 5. Trading Plan
Sell Zone: 4211 – 4213
SL: 4231
TP1: 4145
TP2: 4096
TP3: 4046

Gold Faces Rejection at Resistance Zone – Potential Bearish CorrAnalysis:
The gold price (XAU/USD) is currently testing a strong resistance zone near $4,235–$4,240, where previous bullish momentum appears to be slowing down. Sellers are showing interest in this area, suggesting a potential bearish reversal or correction phase.
A clear support zone lies around $4,140–$4,150, which serves as the target for the expected downward move. If price breaks below this support, further declines could extend toward the next demand zone.
However, if gold breaks and closes above the resistance zone with strong volume, it could invalidate this bearish setup and open the path to new highs.
Key Points:
Resistance Zone: $4,235 – $4,240
Support Zone: $4,140 – $4,150
Short-term Bias: Bearish correction expected
Target: Support zone near $4,145

Will gold continue to rise? XAUUSD forecast 14/10/251. Fundamental Analysis
Yesterday, gold dropped ~100 points from 4248 → 4145 due to information that after the US Government reopened, some important economic data (CPI, employment) might not be released on schedule.
This has lowered the expectation of a December rate cut to <50%, causing a technical adjustment.
➡ The major trend is still upward – today, prioritise BUY.
Key level: 4208–4213
Above 421x: adjustment ends → prioritise BUY.
Below 421x: the price may retest the lower BUY zone.
2. BUY Zone (priority) – SL 10 points, TP 10–20 points (RR 1:1 → 1:2)
zone 1 : 4140–4143
Zone 2: 4134–4130
zone 3: 4120–4112
3. SELL Reaction Zone – SL 10 points, TP 10 points (RR 1:1)
zone 1: 4245–4248
zone 2: 4280–4285
zone 3: 4300–4305
4. Notes
Today is Friday → trade safely, quick TP.
Do not chase orders, only enter when the price hits the zone.

Elliott Wave Analysis – XAUUSD | 13/11/2025🔸 1. Momentum
D1 Timeframe
• D1 momentum continues to close inside the overbought zone, signaling weakening buying pressure.
• A bearish reversal may occur at any moment.
H4 Timeframe
• H4 momentum is also in the overbought zone and starting to contract → a potential signal that H4 may soon turn downward.
H1 Timeframe
• H1 momentum is currently oversold, so a short-term bounce is likely to push momentum back toward the overbought area.
________________________________________
🔸 2. Wave Structure
D1 Structure
• No significant change compared to yesterday; price is still heading toward the completion zone of wave X.
H4 Structure
• Price is inside wave X and currently reaching the 0.618 Fibonacci retracement of wave W (purple).
• This area aligns with both D1 and H4 momentum, creating a strong reversal confluence.
• We wait for an H4 bearish close to confirm the potential top of wave X.
• Note: The current H4 candle is compressing tightly, so one more upward spike is still possible before reversal.
H1 Structure
• Within the red 5-wave sequence, a smaller 5-wave black structure is developing.
• RSI showed a bearish divergence at the top of wave 3 (black) → early signal of a wave 5 top forming.
• Based on wave projections, wave 5 black (which also completes wave 5 red and wave X) may extend into:
o 4223 (0.382 Fibo of wave 1–3)
o 4248 (0.618 Fibo of wave 1–3)
Confluence for wave-top formation:
• RSI divergence between wave 3 and wave 5
• H1 momentum rising into overbought then reversing
→ This supports the expectation of wave X topping around these zones.
________________________________________
🔸 3. Trading Plan
You have three entry options, depending on your trading style:
✅ 1. Sell Limit: 4223 – 4225
• SL: 4233
• TP1: 4181
• TP2: 4145
• TP3: 4046
✅ 2. Sell Limit: 4248 – 4250
• SL: 4260
• TP1: 4181
• TP2: 4145
• TP3: 4046
✅ 3. Sell Stop at 4181
• Trigger only when the candle closes below 4181 (wave 4 black low).
• This method offers stronger confirmation, since structure breaks down before entry.
________________________________________
📌 Summary
• Wave X is approaching its final target area and multiple signals support a potential top.
• H1 may still push higher toward 4223–4248 before reversing.
• These two zones are strong sell areas with momentum and divergence confluence.
• All three entry methods (limit – limit – breakout) provide strategic options depending on risk preference.

Gold Bullish Continuation Setup from Ascending Channel Support✅ Analysis – XAUUSD (Gold)
1. Market Structure
Price is moving inside a clean ascending channel, showing a sustained uptrend.
The lower boundary (rejection line) is acting as strong support, where buyers have entered repeatedly.
The current price action is showing a pullback toward this support area, which is typical before a continuation move higher.
2. Current Price Action
Price has retraced back into the buy zone near the channel support.
Candlesticks show slowing bearish momentum, suggesting buyers may soon take control.
Your chart projection indicates a possible bullish bounce.
3. Trade Setup
✅ Buy Zone: Near the rejection line / lower channel
✅ SL (Stop-Loss): Below the support line — smart placement to protect against channel breakdown
✅ Target: Upper resistance of the channel (around 4230 – 4260 zone)
This gives a good risk-to-reward ratio, based on trend continuation.
4. Bullish Expectation
As long as price stays above the rejection line, the uptrend remains valid.
A bounce from this zone is likely to push price toward the target box.

Gold (XAU/USD) Testing Key Resistance – Potential Pullback BeforAnalysis:
Gold (XAU/USD) is currently trading around 4145, approaching a significant resistance zone between 4100 and 4120, marked as the first target region. This level previously acted as strong resistance, and price may experience a temporary pullback before resuming upward momentum.
The strong psychological support zone near 3890–3920 served as a solid foundation for the recent bullish reversal, confirmed by double-bottom formations and consistent higher highs.
If gold maintains momentum above 4120, the next upside target lies around 4210, aligning with previous structural highs and a major supply zone. However, rejection from the current resistance could trigger a short-term retracement toward 4100 before another push upward.
Summary:
Immediate Resistance: 4100–4120
Next Target: 4210
Key Support: 3890–3920
Bias: Bullish above 4100, potential retracement before continuation

Elliott Wave Analysis – XAUUSD | 12 November 2025🔹 Momentum
• D1: The daily momentum has completed its upward phase, indicating that we may expect a bearish wave to bring the D1 momentum back to the oversold zone.
• H4: The H4 momentum is currently preparing to turn upward, suggesting a potential bullish move lasting 4–5 H4 candles before the next larger decline.
• H1: The H1 momentum is also about to turn upward, implying that a short-term rally could begin from the current levels.
🔹 Wave Structure
• D1: On the daily chart, price remains within wave (4) yellow. We expect a downward move aligned with D1 momentum, lasting 4–5 daily candles, to complete this corrective wave.
• H4: On the H4 chart, price is currently inside wave X (purple). As H4 momentum approaches the oversold zone while price continues to move sideways, it suggests that one more upward leg may occur to complete wave X.
• H1: On the H1 chart, price has already formed a 3-wave correction, which I mentioned in yesterday’s update. Currently, wave 4 (red) is forming, and once price breaks above the top of wave 3 (red), wave 5 (red) will be confirmed.
🎯 Wave 5 (red) is expected to target the 4200 zone, which is our primary Sell Zone.
If price breaks above 4145 and RSI forms a lower high compared to RSI at wave 3, this will create a bearish RSI divergence, confirming that wave 5 is forming — a good opportunity to look for Sell setups.
However, if price breaks below the bottom of wave 4 (red), it may indicate a truncated wave 5, which would trigger strong selling pressure and lead to a sharp, steep decline.
📈 Trading Plan
• Sell Zone: 4199 – 4201
• Stop Loss: 4215
• Take Profit 1: 4145
• Take Profit 2: 4046
• Take Profit 3: 3932

Elliott Wave Analysis – XAUUSD | November 11, 2025🔹 Momentum
• D1 timeframe:
Daily momentum has closed, showing that bullish strength is fading. We’ll wait for today’s daily candle to confirm whether a reversal is forming.
• H4 timeframe:
The two momentum lines are sticking together — this indicates that while upward pressure remains, it is weakening, suggesting a possible formation of wave X top.
• H1 timeframe:
H1 momentum is turning down from the overbought zone. With all three timeframes (D1, H4, H1) aligned, the current price area is likely marking a wave top.
________________________________________
🔹 Wave Structure
• D1 timeframe:
The corrective wave (4) is still developing. Once D1 momentum fully reverses and moves into the oversold zone, it may mark the final stage of the correction phase.
• H4 timeframe:
Price has reached the wave X target area around 4145.
With both D1 and H4 momentum in the overbought zone and starting to turn down, this level is likely the completion of wave X.
After that, price may begin a decline to complete wave Y.
The duration of wave Y is expected to correspond to the time it takes for D1 momentum to move from overbought to oversold.
• H1 timeframe:
The red 5-wave structure has completed, with price currently in wave (5).
The target area for wave (5) lies between 4145 and 4050, overlapping with the wave X target zone.
Therefore, the sell entry from yesterday around 4145 remains valid.
________________________________________
🔹 Trading Plan
• Sell Zone: 4145 – 4147
• Stop Loss: 4165
• Take Profit 1: 4075
• Take Profit 2: 4046
• Take Profit 3: 3932
⚠️ Note: If price closes below 4046, it will confirm that purple wave Y is in progress.
In that case, the target of wave Y could extend below 3855.

Gold – Bullish Trendline Retest Points Toward Move to 4,120 USDAnalysis (English):
Gold (XAU/USD) is maintaining a clear bullish uptrend, supported by a strong ascending trendline. After a sharp push upward, the price is now pulling back, moving toward a key demand zone aligned with the trendline.
The chart projection indicates a likely scenario:
✅ Bullish Scenario (Most Probable)
Price corrects down into the demand zone and touches the trendline.
Buyers step in and defend the level.
A bullish continuation move develops, pushing price toward the upper resistance zones at:
4,100 USD
4,115 – 4,120 USD
As long as the price remains above the trendline, the bullish structure stays intact.
⚠️ Bearish Risk
If the price breaks below the trendline (around 4,050 USD), momentum could slow and shift into a deeper correction.

XAUUSD/GOLD 1H SELL PROJECTION 11.11.25XAUUSD/GOLD 1H Sell Projection (11.11.25) chart.
Here’s a quick technical breakdown of what this chart represents:
🟣 Setup Overview
Pair: XAUUSD (Gold)
Timeframe: 1 Hour (H1)
Bias: Bearish (Sell Setup)
🧩 Key Levels
Resistance / High: 4148.82
Stoploss: ~4141.63
Entry Zone: ~4129.45–4128.32
Target 1 (TP1): Around 4110 (S1 + FVG zone)
Target 2 (TP2): Around 4081 (S2 zone)
📉 Projection Logic
Price rejected from major resistance at 4148.
A short-term pullback / retracement is expected into the entry zone.
After possible retest, price is expected to drop towards TP1 and TP2.
The setup suggests a Risk-Reward Ratio (RRR) of roughly 1:2.5 to 1:3, favoring the sell side.
⚙️ Trading Idea Summary
Parameter Value
Bias Sell
Entry Range 4128–4130
Stop Loss 4141
Take Profit 1 (TP1) 4110
Take Profit 2 (TP2) 4081
R:R Ratio ≈ 1:3
Confirmation Bearish engulfing or rejection from resistance zone

Elliott Wave Analysis – XAUUSD (Week 2, November 2025) Momentum
W1 timeframe:
Weekly momentum is approaching the oversold zone, suggesting a high probability of a bullish reversal within the next 1–2 weeks. Once confirmed, this could mark the beginning of a new medium- to long-term uptrend.
D1 timeframe:
Daily momentum is moving toward the overbought area. During the first 1–2 trading days of the week (starting Monday), there is a strong likelihood of a downward reversal. If that occurs, the price may enter a short corrective phase to bring D1 momentum back to the oversold zone.
When both D1 and W1 momentums turn upward together from oversold levels, it would signal the potential start of a new bullish trend.
H4 timeframe:
H4 momentum is currently declining, suggesting a possible short-term drop during the Asian session. However, since price is being compressed within the major liquidity zone (POC) highlighted on the chart, the next direction remains unclear. It’s best to wait for a clear breakout beyond this liquidity area before confirming the next move.
________________________________________
🔹 Wave Structure
W1 timeframe:
The larger structure remains within wave (4) in yellow. With weekly momentum nearing oversold territory, wave (4) is likely to complete within the next 1–2 weeks, paving the way for the development of wave (5).
D1 timeframe:
The market is currently deep within the corrective phase of wave (4) in yellow, forming a W–X–Y pattern in purple.
• Wave W (purple) has been completed.
• Price is now likely forming wave X. Once wave X finishes, a downward move to complete wave Y is expected.
Wave W has already reached the 0.382 Fibonacci retracement of wave (3), meaning the minimum price objective for wave (4) has been met. When price achieves its target quickly, Elliott theory suggests the structure often extends sideways to complete in terms of time rather than depth.
A notable possibility:
• Wave W is complete.
• Wave X may have finished as a three-wave a-b-c correction (black).
• Wave Y may now be evolving as a contracting triangle (a-b-c-d-e).
This scenario will be reinforced if D1 momentum moves into the oversold zone simultaneously with a bullish reversal on W1, while price holds above 3897.
H4 timeframe:
Since D1 momentum is likely to turn downward soon, the primary short-term bias remains toward the W–X–Y structure shown on the chart.
Price is currently oscillating around the POC (Point of Control – green line), the highest liquidity area.
Price is approaching this POC from below while both D1 and H4 momentums are near reversal points — signaling potential for another short-term decline to complete wave y.
The 4038 and 4145 zones act as strong resistances and could serve as potential completion points for wave X (purple).
At present, wave X is consolidating within a triangle pattern. Since triangles typically form through contracting, overlapping waves, it’s essential to wait for a clear breakout candle above or below the triangle to determine the next trend direction.
________________________________________
🔹 Trading Plan
In the short term, avoid opening new positions while the price remains within the compression zone.
It’s recommended to observe Monday’s market open for a confirmed breakout direction — once clarity appears, a more precise and safer trading plan can be established.

Elliott Wave Analysis – XAUUSD (Gold) | November 7, 2025 Momentum
D1 timeframe:
Daily momentum is turning upward, but just one more bullish candle will push it into the overbought zone. This suggests that the current upward move may not be sustainable, and a short-term correction could occur soon.
H4 timeframe:
H4 momentum is about to turn bullish from the oversold area. If this signal is confirmed, we can expect a short-term upward move. However, as the market is currently in a balanced state, even a small push from either buyers or sellers could shift momentum direction. Therefore, it’s better to observe carefully rather than act too early.
90M timeframe:
Momentum on the 90-minute chart is turning downward, indicating a possible short-term pullback before any further advance.
________________________________________
Wave Structure
D1 timeframe:
The ongoing rise in momentum indicates that wave X is still unfolding, meaning the corrective phase is not yet complete.
H4 timeframe:
Wave X is currently forming. The liquidity zone at 4028 remains a key level to watch.
If the price breaks above this zone, the next target will likely be the upper liquidity zone at 4070.
On the H4 chart, the green level around 4007 represents the highest-volume area, currently acting as a strong resistance.
Combined with the H4 bullish momentum reversal, it shows buying pressure exists, but the resistance remains heavy, making the 4007–4028 region a key battleground.
We should wait for a clear breakout before confirming the next direction.
90M timeframe:
• A triangle-like structure seems to be forming, but it’s not yet complete, so confirmation is needed.
• Waves a and b appear finished; the market may now be forming wave c (black) or wave d (black).
• Since H4 momentum is turning bullish, if the price breaks above 4012, it will likely confirm wave c continuation.
• Conversely, if the price drops toward 3950, completing a three-wave WXY (blue) structure, we can consider it wave d instead.
Currently, wave c (black) is temporarily labeled since the structure already shows three subwaves completed.
Therefore, I expect a decline toward 3950, where we can look for a short-term buy setup.
________________________________________
Trade Plan
• Buy Zone: 3952 – 3950
• Stoploss: 3935
• TP1: 3980
• TP2: 4000

Gold Rejection at Resistance – Bearish Channel Targeting 3930📉 Analysis:
The chart shows a clear shift from an uptrend into a bearish correctional channel:
1. Uptrend Broken
Price previously followed a clean uptrend channel, making BOS (Break of Structure) swings upward.
A ChoCH (Change of Character) occurred, confirming momentum weakening.
2. Strong Resistance Zone
Price entered the 4018–4030 resistance level, marked as a weak high.
This zone acted as a reaction area, causing multiple rejections.
3. Bearish Channel Formation
After hitting resistance, price began forming lower highs and lower lows inside a falling channel.
The rejection line confirms sellers defending the zone.
4. Expected Bearish Leg
The projected path shows consolidation inside the channel followed by a sharp downward impulsive move.
Clean liquidity below supports the bearish scenario.
5. Targets
Major target: 3930
(Highlighted as the trader's target and matches channel support + demand zone.)
📌 Summary
Gold is rejecting the 4020–4030 resistance and forming a bearish channel. A continuation downward toward 3930 remains likely unless price breaks above the resistance with strong momentum.

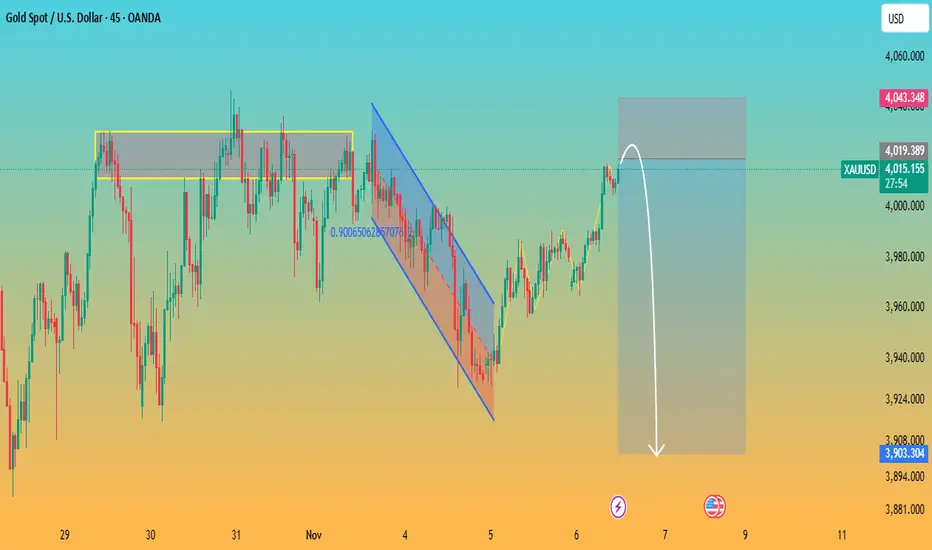
Gold Rejection at Resistance with Potential Bearish PullbackAnalysis:
The chart shows XAUUSD approaching a strong horizontal resistance zone around 4015–4020, a level where price has previously been rejected multiple times (highlighted in yellow). The market recently broke out of a falling channel, showing short-term bullish momentum, but now price is stalling again at this key resistance.
The grey zone above suggests a supply area, and the white arrow indicates a projected bearish move. As long as gold stays below this resistance, the probability of a downward correction increases.
A potential bearish target appears around 3900–3920 (previous support zone), where buyers may re-enter.
Key Points:
Strong multi-touch resistance at 4015–4020
Price showing early rejection signs
Bearish correction likely if price fails to break above resistance
Downside targets: 3920, possibly 3900
Elliott Wave Analysis XAUUSD – November 6, 2025🔹 Momentum
D1 timeframe:
The D1 momentum is now closing in, signaling a possible transition phase with two potential outcomes:
• If today’s D1 candle closes bullish (green): momentum is likely to reverse upward, suggesting a short-term bullish correction.
• If today’s candle closes bearish (red): the downtrend may continue.
The current momentum behavior is unusual, reflecting market indecision between buyers and sellers after a strong decline. As a result, even a small impulse from either side could cause a quick momentum shift.
H4 timeframe:
Momentum on H4 is still in a downward phase but already showing early signs of closing and potential bullish reversal.
• If the current H4 candle closes bearish, the downtrend may extend.
• If it closes bullish and momentum turns upward, price could retest the 4028 zone.
H1 timeframe:
Momentum on H1 is now entering the oversold area, indicating that a reversal could occur within 1–2 more H1 candles.
If momentum turns down again from resistance, this could offer an opportunity for a short-term sell (scalp) around the nearest liquidity zone.
________________________________________
🔹 Wave Structure
D1 timeframe:
As discussed in previous plans, the current structure still forms a W–X–Y correction in yellow, representing wave (4) of the larger cycle.
• The W wave has already reached the 0.382 retracement of wave (3) yellow — which often marks the typical end zone of wave 4.
• Therefore, the following X and Y waves may take longer to complete to maintain time balance within wave (4).
Meanwhile, the X wave (purple) remains relatively shallow, having retraced only about 0.236 of wave W (purple). Combined with the still-uncertain momentum discussed above, a potential rise toward the 4149 zone remains a realistic scenario.
However, if today’s D1 candle closes bearish, price could continue lower to complete wave Y (purple).
Given the current structure favors time balance rather than depth, this Y wave may unfold sideways rather than deeply downward.
At this stage, price is compressed within a narrow range, reflecting market hesitation. It’s best to wait for major catalysts such as the Nonfarm Payrolls report, which could trigger the next decisive move.
________________________________________
H4 timeframe:
The current X wave is developing within a narrow range under the form of a contracting triangle (a–b–c–d–e).
A triangle can only be confirmed once all five internal legs are completed.
Once that happens, a breakout above or below the triangle boundaries will define the next direction.
👉 For now, observation should be prioritized over action.
________________________________________
H1 timeframe:
Wave labeling on H1 is somewhat noisy due to overlapping three-wave structures within a tightening range.
Tentatively, the labeling shows a W–X–Y correction in green, where wave X appears to be a triangle formation.
A final small drop forming wave e could complete this triangle (wave X in green). Once it’s done, a new Y wave in green may start unfolding upward.
________________________________________
🔹 Summary
At present, the market remains noisy and compressed, making it unsuitable for swing entries.
• Avoid swing positions until the structure and momentum become clearer.
• Focus only on short-term scalp setups around key liquidity zones identified earlier.
• Wait for confirmation of direction and structure before committing to larger trades.

Elliott Wave Analysis – XAUUSD (Nov 05, 2025)
🔹 Momentum
D1 timeframe:
Daily momentum has reversed to the downside, suggesting that the dominant trend for the next 4–5 days is likely to be bearish.
H4 timeframe:
H4 momentum is currently turning upward, indicating a potential short-term bullish correction lasting 4–5 H4 candles.
However, since price action is within a corrective wave, short-term momentum signals can be noisy. Still, this minor rally can provide valuable observation opportunities.
H1 timeframe:
H1 momentum is now in the overbought zone and about to turn down.
I usually take entries when H1 and H4 momentum align, but right now they are out of phase, so the best move is to wait and observe.
The 3891 level will be a key area to monitor in the short term.
________________________________________
🔹 Wave Structure
D1 timeframe:
The corrective wave X (purple) within wave (4) (yellow) appears to be forming or nearing completion.
The downside reversal on D1 suggests that wave X might have already ended, and price could now be starting wave Y downward.
A break below 3892 would confirm that wave X is complete.
However, note that this X-wave retracement is quite shallow (around 0.283 of the previous W-wave), which reduces the reliability of the momentum signal — meaning we must stay cautious and monitor closely.
________________________________________
H4 timeframe:
On H4, the structure of wave X (purple) shows signs of a contracting triangle, anchored around the 4028 resistance zone with higher lows.
In this scenario, an a–b–c correction is expected, where wave b forms the triangle, and wave c could rise toward 4050–4149 to complete the X-wave.
However, the strong drop yesterday is weakening this scenario, though not invalidated yet.
→ The bullish scenario would be fully invalidated if price breaks below 3892.
Thus, we must monitor two possible cases:
1. Case 1:
Wave X is still in progress – supported by the current H4 momentum upswing.
If price breaks above 4028 when H4 momentum reaches overbought, it will strengthen this view.
2. Case 2:
Wave X has already completed as a triangle (abcde) shown on H1.
In this case, the ongoing H4 rally is just a corrective bounce, and once H4 momentum enters overbought and price fails to close above 4028, a new bearish leg is likely to start.
________________________________________
H1 timeframe:
The corrective X-wave (purple) seems to have completed as a triangle (abcde, black).
That means the market is now likely in wave Y (purple) on D1, where the main trend is bearish, and any upmove is only corrective.
Hence, the 3981 liquidity zone above is considered a high-probability sell area.
________________________________________
🔹 Trading Plan
• Sell Zone: 3981 – 3983
• Stop Loss: 4002
• Take Profit 1: 3892
• Take Profit 2: 3814
⚠️ Note:
Current volatility is extremely high — each H1 candle covers more than 200 pips.
Therefore, the stop loss range is wide.
👉 To manage risk effectively:
• Either avoid trading during this phase, or
• Reduce position size to keep account safety intact.

technical analysis of the chart you shared (U.S. Dollar IndexCurrent Price: 100.112
Bias: Bullish short-term
Timeframe: 15-min
The chart shows a clear bullish structure with higher highs and higher lows forming. The price recently bounced from a minor support zone around the 100.00 level and is showing momentum to the upside.
📊 Key Levels
Support Level: 99.750 – 99.850 (major zone from previous lows)
Buy Zone: 100.000 – 100.050 (minor support/entry zone)
Target Point: 100.460
⚙️ Analysis Summary
Price has broken above short-term resistance and is now retesting the buy zone, suggesting a possible continuation higher.
The ascending trendline (dotted white line) supports this bullish bias.
The yellow zigzag projection indicates expected consolidation before a push upward.
🎯 Trading Plan (Based on Chart Setup)
Entry Zone: Around 100.000 – 100.050
Stop Loss: Below 99.900 (below structure support) EURONEXT:AEX TVC:AEX INDEX:AMX EURONEXT:A12LE EURONEXT:AAX EURONEXT:AAXG EURONEXT:AE10S EURONEXT:AE12S EURONEXT:AESGG EURONEXT:AESGN EURONEXT:AESGP EURONEXT:AEX4S EURONEXT:AEX6L EURONEXT:AMXGR EURONEXT:AEXGR TVC:AEX
Take Profit: 100.460 (target zone)
Risk/Reward Ratio: Approximately 1:3
🔍 Conclusion
The chart suggests a short-term bullish scenario for DXY (U.S. Dollar Index). A successful bounce from the 100.00 zone could lead to a move toward the 100.46 target point. However, a break below 99.90 would invalidate the setup and shift bias to neutral or bearish.

Gold Faces Strong Rejection at Supply Zone – Bearish ContinuatioThe chart shows Gold testing a strong supply zone around 4000–4025. Price attempted to push higher but failed, forming a clear rejection wick followed by consolidation.
Key observations:
Supply Zone (Resistance): 4000–4025 area has repeatedly rejected price, showing strong seller presence.
Structure: Market is forming lower highs, indicating weakening bullish momentum.
Break & Retest: Price pulled back to the broken structure level and is now reacting bearishly.
Projected Move: The arrow suggests a potential drop toward the 3900–3910 demand zone.
Momentum: Candlestick rhythm supports a bearish continuation scenario as long as price stays below 4000.
✅ Bearish Bias
If the rejection holds:
Downside target: 3900–3910
Invalidate bearish idea: A 4H close above 4025

Gold Range Compression — Breakout Imminent🟥 Resistance Zone (Key Supply Zone): 4028 – 4045
Price has tested this zone multiple times but failed to break through.
A clean break above this red zone will signal strong bullish continuation.
🟦 Support Zone (Key Demand Zone): 3995 – 4005
This is the immediate support keeping price from falling lower.
A break below this blue zone will confirm bearish momentum.
✅ Bullish Scenario
If price breaks and retests the red zone (4028–4045):
Expect upward continuation
Target 1: 4060
Target 2: 4095 – 4105
This matches the upward blue arrows on your chart.
✅ Bearish Scenario
If price breaks below 3995 and retests the blue zone as resistance:
Expect strong downward momentum
Target 1: 3960
Target 2: 3925
This matches the downward blue arrows shown.
✅ Current Bias
Market is neutral right now — sitting between support and resistance.
A breakout from either zone will decide the next direction.

Elliott Wave Analysis – XAUUSD | November 04, 2025
🔹 Momentum
D1 timeframe:
D1 momentum has entered the overbought zone — this signals that the bullish momentum is weakening and a potential reversal could occur today or tomorrow.
H4 timeframe:
H4 momentum is currently in the oversold zone and preparing for a bullish reversal. This suggests that the market may produce 4–5 consecutive bullish H4 candles to lift momentum back toward the overbought region.
H1 timeframe:
H1 momentum is also turning upward, indicating that a short-term bullish phase may be forming.
________________________________________
🔹 Wave Structure
D1 timeframe:
A WXY corrective structure is forming. Wave W appears to be completed, and the current move is part of wave X.
However, this X wave seems relatively shallow, and with D1 momentum already in the overbought zone, there’s likely only one final upward push left to complete wave X before a possible reversal.
H4 timeframe:
Given that D1 is already overbought, the yellow wave (4) scenario remains the primary outlook.
Still, since H4 momentum is about to turn upward, there’s a high probability of one last upward movement to finish wave X before resuming a downward move.
H1 timeframe:
On H1, price action is forming a red WXY structure for wave X.
Wave W has already completed, and price is currently developing within wave X (red).
Inside this X wave, a black abcde triangle is taking shape, with price currently hovering near the lower boundary (ac line) of the triangle.
• If wave e (black) ends near the ac line, the triangle pattern will be complete → price is expected to break above the upper boundary, triggering an upward continuation as wave Y.
→ This aligns with the bullish reversal signals seen in H4 and H1 momentum.
• Conversely, if price breaks below the ac line and drops under 3927, it would suggest that the purple X wave on D1 has already completed, and the market may resume a downtrend following D1 momentum.
________________________________________
🔹 Trading Plan
• Buy Stop: 4000
• Stop Loss: 3973
• Take Profit 1: 4050
⚠️ Note: The current candle range is quite wide → stop loss is relatively large, so it’s advisable to reduce position size and manage trades carefully.

Elliott Wave Analysis – XAUUSD | November 3, 2025
🔹 Momentum
D1 Timeframe:
Daily momentum is currently rising and approaching the overbought zone.
At the current pace, it is expected that within 2–3 more D1 candles, momentum will reach the overbought area — increasing the risk of a potential reversal.
However, in the short term, the bullish trend still dominates.
H4 Timeframe:
H4 momentum is reversing upward, and if a strong bullish candle breaks above the 4028 resistance level, it will confirm a bullish reversal, potentially leading to a 5-candle H4 uptrend within today’s session.
H1 Timeframe:
H1 momentum is preparing to turn downward, suggesting a short-term pullback may occur before the next upside continuation aligned with the broader H4 trend.
________________________________________
🔹 Wave Structure
D1 Timeframe:
Current data still supports the scenario that the market is forming Wave (4) in yellow.
However, more time is needed for a clear confirmation.
If D1 momentum enters the overbought zone without price creating a new high, that would give us additional confirmation of this wave count.
In the short term, price may continue rising for another 2 days.
H4 Timeframe:
The scenario of Wave (4) in purple within Wave (3) in yellow remains valid and has not been invalidated.
If price breaks above the 4379 high, it would confirm the formation of Wave (5) in purple, signaling the start of a strong bullish move.
At present, price movement remains choppy and overlapping, showing no clear trend direction — hence, we need to monitor price action closely.
With H4 momentum turning upward and resistance around 4028 forming a symmetrical triangle pattern, I expect a bullish move of 4–5 H4 candles today.
A decisive breakout above 4028 would further reinforce this bullish scenario.
H1 Timeframe:
The current H1 structure may be forming either:
• Wave X within the larger D1 structure, or
• Wave (5) in purple within the H4 structure.
In either case, we can expect a short-term upward move in line with H4 momentum.
Currently, price is hovering around the 4017 resistance zone, while H1 momentum is preparing to turn downward — therefore, a short-term correction toward the 3953 liquidity zone is expected.
This area will serve as a potential buy zone.
________________________________________
🎯 Trading Plan
• Buy Zone: 3954 – 3952
• Stop Loss: 3944
• Take Profit 1: 4050

technical analysis for your chart on Gold (XAU/USDCurrent Price: $4,002
Trend Structure: The pair is showing a potential reversal setup after a completed downward channel.
Recent Pattern: Price has broken slightly above the descending channel and is now retesting the breakout zone around the support level ($3,950–$3,980).
🔹 Key Technical Levels
Support Zone: $3,940 – $3,980
→ Strong accumulation area shown by multiple rejections and previous demand.
Immediate Resistance: $4,080 – $4,120
→ Minor resistance expected as the first hurdle after breakout.
Major Resistance (Target): $4,385
→ Marked as the final bullish target on the chart.
📈 Bullish Scenario
If price sustains above $4,000, we can expect:
A short-term retest of $4,080–$4,120.
Once momentum confirms above $4,120, bullish continuation toward $4,200 → $4,385 (main target).
✅ Buy Confirmation:
Break and close above $4,050 with volume.
Retest of $4,000 zone followed by bullish rejection candle.
🎯 Bullish Targets:
TP1: $4,080
TP2: $4,200
TP3: $4,385
📉 Bearish Scenario
If price rejects $4,000 and closes below the support zone ($3,950):
Downside may resume toward $3,880 – $3,820 range.
That would invalidate the bullish breakout and confirm channel continuation.
🚫 Sell Trigger:
3H close below $3,940.
🎯 Bearish Targets:
TP1: $3,880
TP2: $3,820
📊 Conclusion
Structure is shifting from bearish to bullish after a channel breakout.
The $3,950–$4,000 area is key — a stronghold for bulls.
Expect a bullish rally if support holds, targeting $4,385 in the medium term. NSE:NIFTY1! NSEIX:NIFTY1! MCX:GOLD1! MCX:CRUDEOIL1! MCX:NATURALGAS1! MCX:SILVER1! NSE:BANKNIFTY1! CME_MINI:NQ1! MCX:GOLDM1! COMEX:GC1! MCX:SILVERM1! MCX:GOLDPETAL1!
