XAU/USD — Rejection Expected from Resistance Zone for Bearish CoCurrent Price: $4,005
Resistance Zone: $4,020 – $4,040
Gold is approaching a strong resistance area that previously triggered a pullback.
Trend Structure:
The market is moving inside a short-term ascending channel, but momentum shows signs of exhaustion near the upper boundary.
Key Observation:
A false breakout or rejection at the resistance could initiate a downward correction.
Bearish Signal Setup:
Entry Zone (Sell): $4,015 – $4,035 (look for rejection candles or bearish engulfing near resistance)
Target 1: $3,960
Target 2 (Main Target): $3,913
Stop Loss: $4,045 above resistance zone EUREX:FDAX1! ICEEUR:RC1! ICEEUR:BRN1! ICEEUR:WBS1! EUREX:FESX1! EUREX:FGBL1! EUREX:FDXM1!
Risk/Reward Ratio: Approx. 1:2.5
Confirmation:
Wait for bearish confirmation candle on 15M or 30M timeframe.
Break below $3,980 will strengthen bearish momentum toward target.
Signal Summary (📉 Sell Setup):
Direction Entry TP1 TP2 SL ICEEUR:Z1! ICEEUR:W1! EUREX:FGBM1! EUREX:FGBS1! EUREX:FGBS1! ICEEUR:GWM1! EUREX:FXXP1! EUREX:DOWF1! ICEEUR:XZ1!
🔻 SELL 4,015 – 4,035 3,960 3,913 4,045
Xauusdidea

Elliott Wave Analysis – XAUUSD | October 30, 2025
1️⃣ Momentum
• D1 Timeframe:
D1 momentum remains entangled. Yesterday’s daily candle closed at its lowest point, rejecting all intraday bullish attempts. However, it has not yet broken the previous candle’s low — this suggests that the bearish trend is still intact, though weakening, and a potential reversal could occur within the next 1–2 days.
• H4 Timeframe:
H4 momentum is approaching the oversold zone, indicating a possible short-term recovery lasting around 4–5 H4 candles.
• H1 Timeframe:
The price is currently either consolidating or continuing its short-term decline.
If it continues to cling to the 3927 liquidity zone, a further breakdown is likely.
________________________________________
2️⃣ Wave Structure
• D1 Timeframe:
Price is now sitting near the 0.382 Fibonacci retracement of wave (3) in yellow — a typical correction level for wave (4).
Therefore, if the decline continues or the correction extends, it’s highly probable that we are in wave (4) of the yellow count, and the current drop is only the first sub-wave of this corrective phase.
• H4 Timeframe:
Currently, price is around the 0.872 extension of wave (3) in purple, which is not ideal for a completed wave (4).
When combining the D1 and H4 structures, both indicate that the market is likely forming a corrective wave (4) in yellow, and a recovery move may soon appear as D1 momentum begins to turn upward.
👉 If this scenario is confirmed:
o If price breaks above the previous wave (3) high (around 4400), it would confirm the start of a new impulsive wave upward.
o If price rises slowly and the highest target only reaches around 4400 before turning down again → this move is likely part of the corrective wave (4) before another bearish leg resumes.
• H1 Timeframe:
The current formation suggests a potential double zigzag structure.
To confirm this setup, price needs to break below 3892. This is a strong liquidity zone, so if price reaches it, a temporary bounce could occur.
Key liquidity zones above to watch: 3927 – 3953 – 3995.
If price fails to break above the previous red wave X, these zones may act as strong resistance levels, pushing the market lower again.
Target areas for the red wave Y are:
o 3814
o 3786
________________________________________
3️⃣ Trade Plan
Scenario 1:
• Buy Zone: 3815 – 3813
• SL: 3804
• TP1: 3892
Scenario 2:
• Buy Zone: 3787 – 3785
• SL: 3776
• TP1: 3892
________________________________________
📌 Summary:
D1 momentum is weakening and nearing the oversold zone → a potential bullish rebound could develop in the coming sessions.
The 3815 – 3785 area remains a key buy zone, while 3927 – 3995 should be closely monitored as resistance levels to confirm the next directional move.

technical analysis for your XAU/USD (Gold vs USD) chart:XAU/USD (Gold) 15-Min Chart Analysis – 29 Oct 2025
Market Structure
The previous descending channel has been broken to the upside, indicating a potential trend reversal from bearish to bullish.
Price retraced back to a support level zone (≈ $3,920 – $3,940), where buyers are likely to defend.
Key Levels
Support Zone: 3,920 – 3,940
→ Price already tested this area with strong rejection wicks, showing buyer interest.
Resistance Zone: 3,980 – 4,020
→ Short-term resistance; a breakout above 4,020 confirms bullish momentum.
Target Level: 4,142
→ As marked on your chart, this is the projected bullish target after confirmation of upward continuation.
Price Action
After a downward correction, gold found support and formed a double-bottom-type pattern near the 3,940 level.
Price is currently consolidating above support, signaling potential accumulation before an upward push.
Momentum Outlook
If price holds above 3,940, expect a move towards 4,000 → 4,020, followed by a breakout to 4,142 (target).
However, if 3,920 support breaks, the price may retest 3,880–3,860, resuming short-term bearish momentum.
📈 Trading Bias
Bullish bias above 3,940 (target 4,142).
Bearish only below 3,920 (target 3,860). EURONEXT:NH7X2025 EURONEXT:PE6X2025 EURONEXT:PE7X2025 EURONEXT:A57X2025 EURONEXT:AJ7X2025 EURONEXT:AJ7X2025 EURONEXT:B16X2025 EURONEXT:B17X2025 EURONEXT:BC6X2025 EURONEXT:BC7X2025 EURONEXT:BC8Z2025 EURONEXT:FE6X2025 EURONEXT:MH7X2025

Gold (XAU/USD) 4H Chart Analysis – Short-Term Reversal from ?Technical Overview:
Gold has recently rebounded from a High Demand Zone around the $3,900–$3,910 region, showing clear signs of buyer re-entry after a prolonged bearish correction. The candle structure suggests strong bullish intent, with higher lows forming and a potential continuation toward the next liquidity area.
Key Observations:
🔹 High Demand Zone: Price reacted strongly here, indicating institutional buying pressure.
🔹 High Prop POI (Point of Interest): Served as a key accumulation level before the breakout.
🔹 SMC Trap: Indicates a prior liquidity grab, trapping late sellers before the move up.
🔹 Bullish Momentum Building: Consecutive bullish candles after rejection from the demand zone strengthen the reversal bias.
Target Projection:
🎯 Immediate Target: $4,080 – $4,100 (aligned with local resistance and liquidity grab zone).
🛑 Support: $3,905 (must hold to maintain bullish structure).
💎 Extended Target (if momentum continues): $4,160 – $4,180 (previous major swing high zone).
Summary:
Gold is showing a short-term recovery phase within a broader bullish structure. A confirmed 4H close above $4,030 would likely propel price toward the $4,100 region, while a drop below $3,900 would invalidate the bullish setup.
📊 Suggested Title:
"Gold Rebounds from Key Demand Zone, Eyes $4,100 Resistance 🔥"

Elliott Wave Analysis – XAUUSD (October 29, 2025)
Momentum
• D1: Momentum remains compressed, but yesterday’s candle closed with a long lower wick — a clear sign of weakening downside pressure. A bullish daily close today would confirm a potential D1 reversal.
• H4: Momentum is preparing to turn down from the overbought zone, yet the current upward move is still weak. We need to monitor whether price can hold above the previous low once H4 momentum drops toward oversold.
• H1: Momentum is falling, but price is supported around 3953 and capped near 3994.
As long as price holds above 3927 and avoids breaking 3892, the next H4 oversold phase could confirm a stronger upside structure.
________________________________________
Wave Structure
• D1: The current decline equals 0.382 retracement of wave (3) yellow, a key Fibonacci level.
• H4: Wave (4) purple has already retraced 0.782 of wave (3) — unusually deep for a normal 4th wave (which typically stops around 0.382–0.5).
This suggests the ongoing correction may represent wave (4) yellow on the D1 timeframe.
If true, the market could now be forming wave W of a larger W–X–Y structure, meaning the upcoming recovery might only be a slow, overlapping X wave before another decline.
• H1: The 5-wave black structure seems completed.
A break above 3995, followed by a test of 4050, would confirm the end of wave (5) black and the start of a corrective move upward.
________________________________________
Summary
Price volatility is still high — avoid limit orders for now and watch how price reacts at key zones.
• 🔹 Support: 3953 – 3927 – 3892
• 🔹 Resistance: 3994 – 4050

“Gold Rebounds from Demand Zone — Short-Term Recovery Ahead”Analysis:
Gold (XAU/USD) on the 4-hour chart shows a strong corrective decline after forming an SMC trap near the 4,250–4,300 zone, where liquidity was swept before a sharp selloff. Price has now reached the High Probability POI (Point of Interest) around the 3,850–3,880 region, showing early signs of a bullish reaction.
The recent candle structure indicates buyers are stepping in from this demand zone, confirming a potential short-term reversal. If momentum sustains, the first target zone lies around 3,950–3,980, aligning with minor resistance and previous imbalance fill.
Outlook:
📈 Bias: Bullish correction (short-term)
🧭 Key Support: 3,850 – 3,880
🎯 Target: 3,950 – 3,980
⚠️ Invalidation: Break below 3,840 may reopen bearish continuation toward 3,780

XAUUSD/GOLD 1H SELL LIMIT PROJECTION 28.10.251H Sell Limit Projection Chart for XAU/USD (Gold):
📝 Chart Summary (28.10.25)
Timeframe: 1 Hour
Setup Type: Sell Limit Projection
Market Structure: Bearish
📈 Key Levels:
Sell Limit Zone (Entry Area): Around $3,958 (Resistance R1)
Stop Loss: Around $3,982 (Top of FVG + Trendline)
Target 1 (TP1): Support S1 – around $3,920
Target 2 (TP2): Support S2 – around $3,883
📉 Technical Confluences:
🔹 1H Downtrend Line acting as dynamic resistance
🔹 FVG (Fair Value Gap) aligning with entry zone
🔹 Fibonacci retracement zone overlap
🔹 Resistance R1 matches previous supply zone
🧭 Trading Plan Idea:
Wait for price to retrace back to $3,958 zone.
Place Sell Limit order in the zone.
Stop loss: Above $3,982 zone to protect from fakeouts.
Take Profit: First target at $3,920 (partial booking), second target at $3,883 (runner).
⚠️ Risk Notes:
Watch for liquidity grabs above R1 before rejection.
Avoid market entry — wait for price confirmation near the zone.
Adjust SL if price structure shifts on lower timeframes.

Gold Breaks Key Support Zone — Bearish Momentum Builds Below $4,Analysis:
The XAU/USD (Gold vs. USD) 45-minute chart shows a clear breakdown below the established support zone, indicating a shift in market sentiment from consolidation to bearish momentum.
The support zone around $4,050 – $4,000 had previously held multiple times, acting as a strong demand area.
The recent breakout below this zone confirms a potential trend continuation to the downside.
Price action suggests a bearish pattern with lower highs and lower lows forming before the breakout.
A retest of the broken support (now resistance) may occur before the next leg lower.
The next major target lies near $3,900 – $3,850, aligning with the projected measured move.
Technical Outlook:
If gold fails to reclaim the $4,050 level, further downside pressure remains likely. However, a close back above this level could invalidate the bearish breakout and signal a possible false break.

Elliott Wave Analysis – XAUUSD (October 28, 2025)
🔹 Momentum
D1 Timeframe:
The momentum lines on D1 remain intertwined. When this happens, the trend often continues with candle counts that follow Fibonacci numbers (3, 5, 8…).
Currently, there are around 3 candles, indicating a high probability of a reversal forming soon, possibly today.
H4 Timeframe:
Momentum is rising, suggesting a potential short-term upward or sideways move to push momentum into the overbought zone.
If the market consolidates at this level, once momentum reaches the overbought region, another bearish leg on H4 could still occur.
H1 Timeframe:
Momentum is currently decreasing. Price is closing lower around the liquidity zone at 3994, showing signs of a liquidity sweep.
We expect price to continue moving lower toward the next liquidity zone, in alignment with the short-term bearish structure on H1.
________________________________________
🔹 Wave Structure
D1 Timeframe:
The overall wave structure remains largely unchanged. Yesterday’s strong bearish candle fits within our prior analysis, confirming that the corrective wave is still in progress.
However, since the D1 momentum lines have already stuck together for about three candles, a potential bullish reversal candle today could mark the completion of this correction.
H4 Timeframe:
The structure has broken the previous low, suggesting that this could be the final leg of wave Y (blue).
Observing the completed 5-wave structure (1–2–3–4–5 in blue), this corrective leg has now returned to the base of the previous wave 4, achieving both price and time symmetry.
→ A short-term bullish reversal is expected from the current area.
H1 Timeframe:
The prior correction formed a triangle pattern (abcde in red), which has now broken to the downside, developing into a 5-wave sequence (black).
Wave 4 (black) appears completed, and price is likely within the final wave 5 down.
🎯 Target zones for completion of wave 5 (black):
• Target 1️⃣: 3953
• Target 2️⃣: 3927
________________________________________
🔹 Trading Plan
Scenario 1:
• Buy Zone: 3955 – 3952
• Stop Loss: 3932
• TP1: 4050
Scenario 2:
• Buy Zone: 3939 – 3927
• Stop Loss: 3907
• TP1: 3994

#xauusd gold dumping is going to 3600 this is my gold analysis#xauusd gold dumping is going to 3600 this is my gold analysis #xauusd gold dumping is going to 3600 this is my gold analysis
v
#xauusd gold dumping is going to 3600 this is my gold analysis#xauusd gold dumping is going to 3600 this is my gold analysis#xauusd gold dumping is going to 3600 this is my gold analysis#xauusd gold dumping is going to 3600 this is my gold analysis
#xauusd gold dumping is going to 3600 this is my gold analysis
why the reason you can sea on my previous public post of #gold
#xauusd

Elliott Wave Analysis – XAUUSD (October 27, 2025)
🔹 Momentum
• D1 Timeframe:
D1 momentum remains clustered, suggesting that a bullish reversal could occur at any time. However, since momentum has not yet separated clearly, short-term downside pressure still exists.
• H4 Timeframe:
H4 momentum is currently declining, meaning that the downtrend could continue. We need to wait for H4 momentum to reach the oversold area and observe the market’s reaction there to determine whether the current drop is complete.
• H1 Timeframe:
H1 momentum is rising slightly, indicating the potential for a short-term rebound. However, since H4 is still in a down phase, any upward movement could face resistance near the 4098 level.
________________________________________
🔹 Wave Structure
• D1 Timeframe:
Price is currently moving sideways while D1 momentum remains stuck together, signaling a possible upcoming 5-day rally once D1 momentum turns upward into the overbought zone.
o If price fails to break above wave (3) yellow, this move is likely a wave (4) yellow correction.
o Conversely, if price breaks above wave (3) yellow, the current correction may only be a minor wave within wave (3) yellow.
________________________________________
🔹 Two Main Scenarios
1️⃣ Bullish Scenario (WXY blue completed):
If the WXY blue corrective structure has finished, the market may start a new wave (5) purple uptrend.
In this case:
• As H4 momentum moves into the oversold area, price should not fall deeply toward 4004.
• A sharp and decisive rebound from that zone would confirm this bullish scenario.
2️⃣ Bearish Scenario (Correction still in progress):
If the correction is not yet complete, the H4 decline could continue:
• Price might break below 4004, or at least retest it.
• If that happens, the downtrend could extend toward 3953 or 3927.
________________________________________
🔹 H1 Structure – Triangle Formation
On the H1 chart, price is consolidating within a contracting triangle, suggesting sideways accumulation with two possible interpretations:
• Scenario 1:
The triangle represents wave X of the WXY black structure.
When H4 momentum reaches the oversold zone and price holds above 4004, we may see an impulsive breakout toward the previous high at 4381, completing a flat correction of wave (4) yellow (D1).
• Scenario 2:
The triangle is wave (4) of wave Y blue, meaning that once completed, price could decline further toward 3953 or 3927 to finish wave Y. After that, a more stable upward wave is expected.
________________________________________
🔹 Trading Plan
Currently, price remains inside the triangle pattern:
• For experienced traders:
Wait for a breakout of either side of the triangle for direct entry.
• For more conservative traders:
Wait for Buy opportunities near strong support below.
🎯 Buy Zone: 3930 – 3927
🛑 Stop Loss: 3917
🎯 TP1: 4004
👉 If price breaks above 4149, we can look for Buy entries upon breakout, expecting an extended upward move toward 4268 or higher.

XAUUSD/GOLD WEEKLY SELL PROJECTION 26.10.25Here’s a clear explanation of the 4H SELL SETUP shown in your chart 📊👇
📌 Chart Breakdown (XAU/USD — Gold 4H)
Pattern: Rising wedge / structure breakdown
Trendline: “4H Uptrend Line – Broken” ✅
Candle signal: Bearish Engulfing at ATH (strong reversal confirmation)
🧭 Key Levels
🟥 Stop Loss: Around 4,225.640 (above structure high)
🟡 Entry Zone: ~4,192 (below trendline break)
🟢 Targets:
TP1: 4,125
TP2: 4,075
TP3: 4,031
🧠 Trading Logic
Market formed a Bearish Engulfing at the top.
The main trendline was broken, indicating possible trend reversal.
After a retest of the broken structure, price is expected to continue downward.
Multiple TPs (TP1, TP2, TP3) help scale out profits gradually.
SL is placed above the previous high to protect against a fake breakout.

XAUUSD/GOLD WEEKLY OVERVIEW PROJECTION 25.10.25“XAUUSD/GOLD WEEKLY OVERVIEW 25.10.25”:
🟡 Pair: XAUUSD (Gold vs USD)
📅 Timeframe: Weekly
📊 Chart Type: Price action with liquidity zone and retest entry plan
📌 Key Levels:
Resistance / Upper Target Zone: ~4,360 – 4,400
Entry Zone / Supply-Demand Range: ~4,057 – 4,145
Support / Lower Target Zone: ~3,868
🧭 Market Structure Analysis:
The price is currently consolidating inside a mid-range zone (4,057–4,145) after a strong previous down move.
Liquidity zones are marked both above and below, suggesting potential breakout and retest setups.
The market is showing accumulation or indecision before a big move.
🛒 Buy Scenario (Bullish Plan):
Price may retest the lower boundary of the entry zone (~4,057–4,145).
If a bullish retest/confirmation candle forms → Long Entry.
Target: ~4,360 area (major resistance).
Stop-loss likely placed slightly below 4,057.
🟢 This aligns with a potential reversal or continuation of higher timeframe bullish structure.
🐻 Sell Scenario (Bearish Plan):
Price may break below the entry zone, retest it from the bottom, and reject.
If a bearish retest/confirmation candle forms → Short Entry.
Target: ~3,868 support level.
Stop-loss likely placed slightly above 4,145.
🔴 This aligns with a continuation of the recent bearish momentum.
⚠️ Additional Notes:
Watch for fake breakouts near the entry zone.
Weekly candles can give strong direction but might take 1–2 weeks to fully play out.
High impact news related to gold or USD can accelerate the move.
✅ Summary Plan:
Buy entry: After bullish retest of 4,057–4,145 → TP 4,360
Sell entry: After bearish retest of 4,057–4,145 → TP 3,868
SL: Just outside the opposite edge of the entry zone.

Elliott Wave Analysis – XAUUSD (October 24, 2025)
1️⃣ Momentum
D1 Timeframe:
• D1 momentum is closing within the oversold zone → bearish strength has clearly weakened.
• The probability of a bullish reversal is now very high.
• A strong bullish D1 candle close is needed to confirm the reversal.
• Once confirmed, price may enter a 5-day bullish rally.
H4 Timeframe:
• H4 momentum is still declining.
• If the current H4 candle closes as it is now, we may see a main bearish move today (around 5 H4 candles).
• Since today is Friday, a deeper decline remains possible.
→ Therefore, careful observation and analysis are required before entering any trades.
H1 Timeframe:
• H1 momentum continues to decline.
• Price may drop toward the 4098 liquidity zone.
• If this level breaks, the next potential target is 4050.
________________________________________
2️⃣ Wave Structure
D1 Structure:
• Price has been moving sideways for several days.
• In Elliott Wave theory, when price reaches its target, it often needs time symmetry before the wave completes.
• Therefore, this prolonged sideways phase helps maintain time balance.
• It’s still too early to confirm whether this is yellow Wave 4 or just Wave 4 within yellow Wave 3.
H4 Structure:
• There are two possible scenarios:
1. The blue Y wave is still unfolding.
2. The purple Wave 5 has already started forming.
• To determine which scenario is valid, we monitor the current
H4 bearish phase:
o If price does not break the previous low, and H4 momentum enters the oversold zone, it likely indicates purple Wave 5 has begun, with an upside target near 4476.
o If price breaks the previous low, the blue Y corrective wave is still in progress, or a larger corrective structure is unfolding.
o In that case, we’ll watch the lower liquidity zones, with the ideal completion target for Wave Y around 3927.
H1 Structure:
• On the H1 chart, Wave C appears to have completed in the form of an Ending Triangle.
• According to Elliott theory, after an ending triangle, price should drop sharply and quickly.
• However, such a strong drop hasn’t appeared yet, so we continue to observe the price action carefully.
There are two main scenarios to consider:
1. If price declines slowly toward the 4050 liquidity zone, showing overlapping waves while H4 momentum moves into the oversold region, it’s likely that Wave 5 has already started.
→ In this case, we’ll look for buying opportunities.
2. If price falls rapidly and steeply, it suggests that the blue Y wave is still unfolding, or that the market is inside a larger corrective phase.
→ In this case, price may break below 4004, and we will patiently wait for buy setups around 3953 or 3927.
________________________________________
3️⃣ Trading Plan
• Sell Setup:
o Yesterday’s sell zone at 4149 has already reached about +400 pips.
o No new ideal sell zone for now → wait for liquidity breaks to look for the next sell setup.
• Buy Setup:
o Monitor potential buy reactions at:
4050
3953
3927
⚠️ Note:
Price is currently at a sensitive zone, with each candle showing a range over 200 pips.
→ Therefore, limit orders are highly risky at the moment and could easily get stopped out.

Elliott Wave Analysis – XAUUSD (October 23, 2025)
1️⃣ Momentum
D1 Timeframe:
• The D1 momentum is now in the oversold zone, suggesting a potential bullish reversal at any moment.
• Once we see a D1 candle close with a bullish confirmation, it could trigger 3–5 consecutive bullish days ahead.
H4 Timeframe:
• The H4 momentum is currently overbought, indicating a possible downward correction during today’s session.
H1 Timeframe:
• The H1 momentum is now turning upward, meaning price may rise slightly or move sideways in the short term.
• Watch two key liquidity zones: 4098 and 4143.
If H1 momentum reaches the overbought zone around these levels, it will align with the H4 bearish momentum, creating a strong resistance area.
________________________________________
2️⃣ Wave Structure
D1 Structure:
• The D1 momentum is preparing to reverse, showing that the current decline is weakening.
• A short-term recovery wave is likely to appear soon.
• As discussed in yesterday’s plan, we must observe the upcoming bullish move to confirm whether the recent downtrend has completed.
H4 Structure:
• The H4 momentum is overbought, meaning a bearish reversal may happen soon.
• Price movement is slow and overlapping, suggesting that the next decline could be either:
o Wave 4 of Wave Y (blue), or
o A larger corrective phase if momentum fully shifts downward.
H1 Structure:
• The current formation may be developing as a Flat or a Triangle correction.
o If it’s a Flat, the 4143 level is a potential completion zone for Wave C (black), after which price could resume its decline.
o If it’s a Triangle, the pattern is not yet complete — confirmation will come when price breaks below the lower boundary, offering a Sell opportunity.
🎯 Target zone if the decline unfolds:
• Based on the H4 momentum cycle (typically lasting 4–5 candles),
• And according to Fibonacci projection, Wave 5 of Wave Y (blue) targets around 3927.
________________________________________
3️⃣ Trading Plan
• The current H1 candle range is very wide (300–400 pips), while my typical stop-loss size is 100–150 pips.
• This makes limit orders risky in the current environment.
• Therefore, it’s better to wait for clear confirmation before entering trades, rather than placing early limit orders.
🔹 Sell Zones:
• 4143 and 4190 – expected top areas of this correction.
• Additionally, if price breaks above liquidity zones and then retests, these can serve as Sell entries aligned with the H4 downward momentum.

Gold (XAU/USD) Technical AnalysisAnalysis:
Gold is currently trading around 4,120, showing a minor bullish correction within a descending channel. The price has bounced from the support buy zone (4,040–4,060), indicating buyer activity at this level. However, the structure remains bearish in the short term as long as the price stays below the descending trade line.
A possible scenario is a short-term pullback toward the upper trade line before another retest of the support zone. If the support holds again, a bullish reversal could target the 4,383 level, aligning with the upper boundary of the previous high.
Key Levels:
Support Zone: 4,040 – 4,060
Resistance (Trade Line): 4,180 – 4,200
Target (Bullish): 4,383
Outlook:
Neutral-to-bullish in the medium term if the support zone remains intact. A break below 4,040 would invalidate the bullish setup and signal further downside continuation. KSE:GFH KSE:AGLTY KSE:SENERGY KSE:KFH KSE:CLEANING KSE:NCCI KSE:EKTTITAB KSE:EQUIPMENT KSE:NIH KSE:THURAYA KSE:FUTUREKID KSE:ALEID KSE:URC KSE:URC KSE:ARKAN

Gold Rebounds from Extreme POI – Bullish Move Building UpAnalysis:
Gold (XAU/USD) has shown a strong recovery after tapping into the Extreme Point of Interest (POI) zone, signaling the potential start of a bullish reversal.
The chart indicates an SMC Trap (Smart Money Concept Trap), where liquidity was swept below previous lows to trigger sell stops before reversing upward — a classic smart money accumulation pattern.
Price reacted sharply from the Extreme POI, forming higher lows, which confirms renewed buyer interest.
The immediate target area lies around $4,180 – $4,200, aligning with the projected bullish arrow.
Below, the High Probability POI remains as a deeper demand zone — a strong confluence area if price retests.
📊 Conclusion:
Gold is showing signs of bullish structure recovery after liquidity sweep. Holding above the Extreme POI zone strengthens the case for continued upside movement toward $4,200 and possibly higher.

Gold Breakout Potential: Descending Wedge Signals Bullish ReversAnalysis:
The XAU/USD (Gold vs. USD) chart on the 45-minute timeframe shows price action forming a descending wedge pattern, a typically bullish reversal formation. The price has been compressing between lower highs and lower lows but is now testing the upper trendline resistance, indicating a possible breakout.
Key observations:
Trendline Breakout Zone: The narrowing wedge suggests weakening bearish momentum. A confirmed breakout above the trendline could trigger strong upward momentum.
Targets: The projected upside targets are around 4,300, 4,400, and 4,500, aligning with previous resistance zones.
Support Zone: Immediate support remains near 4,050–4,000, where the lower wedge boundary provides buying interest.
Momentum Indicator: Gradual bullish recovery and decreasing downside pressure indicate renewed buyer strength.
Elliott Wave Analysis – XAUUSD (October 22, 2025)
🔹 1. Momentum
D1:
The D1 momentum is preparing to turn bullish, signaling the start of a new upward trend.
→ We can expect at least 3–5 consecutive bullish days ahead.
H4:
We need to wait for the H4 candle to close to confirm the reversal signal.
If confirmed, there’s a strong possibility that today will form an intraday uptrend.
H1:
H1 momentum has already turned upward, but it’s now in the overbought zone.
Therefore, the current rise won’t be strong, and a minor pullback is needed to bring momentum back to the oversold area — creating a foundation for a more stable bullish move.
________________________________________
🔹 2. Wave Structure
D1 Timeframe:
Yesterday saw a sharp decline, but D1 momentum is now preparing to reverse upward.
Counting the correction candles, we already have five candles, suggesting that the market may soon enter a new bullish phase lasting 3–5 days or more.
During this recovery phase, we need to monitor two key scenarios:
• If wave movements overlap and lack strength, and when D1 momentum returns to the overbought zone but price fails to break the previous high, then the Wave 4 (yellow) scenario is still in play.
• If price rises sharply and decisively, the recent correction might only be part of Wave 3 (yellow), meaning the bullish trend is continuing.
H4 Timeframe:
Yesterday’s structure was identified as a Flat correction, and it remains valid.
Price has retraced into the Wave 4 zone of the smaller degree structure, reaching the 2.0 Fibonacci extension of Wave A.
If Wave 5 (purple) is now developing, the ideal target would be around 4476.
However, if price rises with overlapping waves, this could instead represent a corrective move within Wave 4 (yellow), targeting the previous high zone between 4381 and 4476.
H1 Timeframe:
Within Wave W, there is a small Flat correction, where Wave C extended to twice the length of Wave A.
Now, Wave Y (blue) has also declined to 2× Wave W, suggesting weakening buying power.
Even so, in the short term, we still expect an intraday bullish move today.
→ The trading bias remains buy-side until H4 momentum reaches the overbought area and reverses.
________________________________________
🔹 3. Trading Plan
Buy Zone: 4101 – 4098
Stop Loss (SL): 4088
Take Profit 1 (TP1): 4190
________________________________________
🔹 4. Notes
Liquidity and resistance zones are already marked on the chart.
→ Wait for price to break and retest those areas to confirm a valid Buy setup.

technical analysis for XAU/USD (Gold) based on your chart:Chart Summary
Current Price: Around $4,140
Trend Lines: A descending trade line shows the overall short-term bearish trend.
Support Zone: Clearly marked between $4,080 – $4,120 (“SUPPORT BUY ZONE”).
Target: The upside target is labeled near $4,383.
Technical Outlook
🔹 Support Zone Reaction
Price recently dipped into the support buy zone, forming a potential bullish reversal wick.
This area is acting as a strong demand zone, attracting buyers around $4,100.
🔹 Downtrend Channel
The pair remains under a downward-sloping trade line, suggesting the short-term market bias is still bearish.
However, a breakout above this trendline could trigger bullish continuation toward the $4,383 target.
🔹 Short-Term Scenario
Bullish Case (Primary Plan):
If gold holds above the support zone ($4,080–$4,120) and breaks the trendline resistance (~$4,200),
→ next target area: $4,300–$4,383.
Confirmation comes with a clear candle close above $4,200.
Bearish Case (Alternative Plan):
If price fails to break the descending trade line and drops below $4,080,
→ possible continuation toward $4,040 – $4,000.
Key Levels
Type Level (USD) Description
🎯 Target 4,383 Major resistance / profit zone
⚔️ Resistance 4,200 Descending trendline zone
🛒 Support Zone 4,080–4,120 Demand / Buy zone
❌ Invalid Below 4,080 Break below = bearish continuation
Summary
📈 Gold (XAU/USD) is currently retesting its support zone, showing early signs of a bullish rebound.
A confirmed breakout above the trendline could lead to a rally toward $4,380.
However, losing support below $4,080 would invalidate the bullish setup and reintroduce downside risk. EUREX:FDAX1! ICEEUR:BRN1! ICEEUR:WBS1! EUREX:FESX1! EUREX:FGBL1! EUREX:FDXM1! ICEEUR:GWM1! ICEEUR:Z1! EUREX:FDXS1! EUREX:FGBM1! ICEEUR:W1! ICEEUR:RC1!

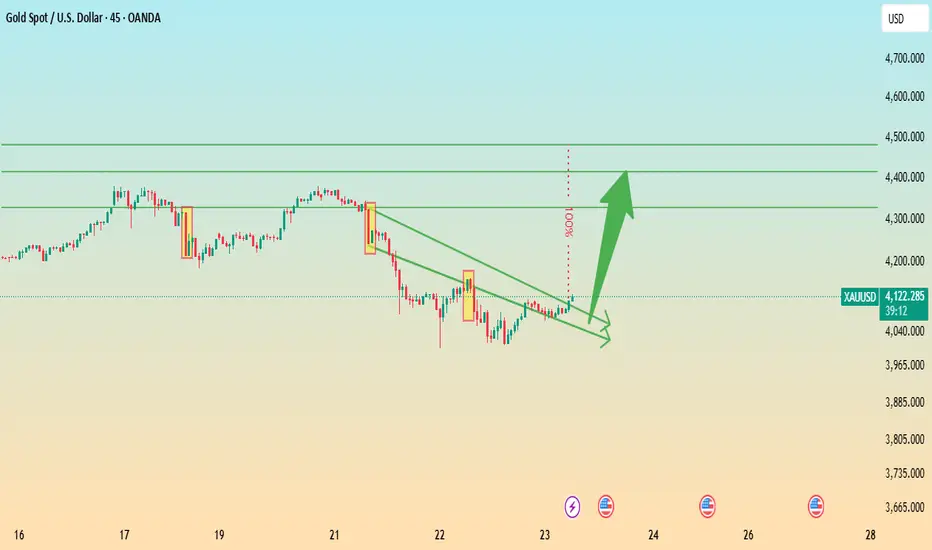
Gold (XAU/USD) Potential Bullish Reversal Setup – Entry Zone For**Analysis:**
The chart illustrates a possible bullish reversal scenario after a recent downward move in Gold (XAU/USD). The marked *Change of Character (ChoCH)* indicates an early sign of a trend shift from bearish to bullish momentum.
Price has entered a **consolidation zone** near the support area, where the **entry level** is highlighted. This zone suggests accumulation and potential preparation for an upward move.
The setup shows:
* **ENTRY:** Around current support, within the highlighted range.
* **STOP:** Below the recent low, providing risk control if the reversal fails.
* **TARGET:** The projection points to a **100% measured move**, aligning with a strong bullish continuation potential toward 4,700 levels.
If price maintains structure and confirms a breakout above the short-term resistance, it may initiate a new **bullish impulse phase**.

Elliott Wave Analysis – XAUUSD (October 21, 2025)
🔹 1. Momentum
H4:
H4 momentum is currently turning bearish, indicating that the main trend for today is downward.
H1:
H1 momentum is stuck in the oversold zone, suggesting that price could continue to fall, but at the same time, there’s a risk of a short-term bullish reversal — this should be monitored carefully.
M15:
M15 momentum is also turning bearish, confirming the potential for short-term downside continuation.
🔹 2. Wave Structure
H4 timeframe:
The current price structure likely forms a Flat correction (W–X–Y in blue) as part of wave 4 (in purple).
The X wave appears completed, and price is now in the declining phase of wave Y.
Wave Y may develop in three possible forms:
Zigzag
5-wave impulsive
Triangle
👉 In Zigzag or 5-wave formations, the target is usually equal to wave A.
👉 In a triangle, price may build higher lows, respecting the upper boundary connecting wave 3 and wave X.
H1 timeframe:
The H1 structure mirrors H4, but note that H1 momentum remains in the oversold zone, meaning an upward reversal could occur anytime.
M15 timeframe:
Used mainly for entry timing.
Since H4 momentum trend is bearish, we will prioritize Sell setups, especially after liquidity retests or breakdowns on the M15 chart.
🔹 3. Trading Plan
Main bias: Bearish (following H4 momentum)
Strategy:
Focus on Sell setups when price retests or breaks below liquidity zones.
Consider Buy setups only if price reaches the 4190 support area, signaling a potential end of wave 4 (purple) and the start of wave 5 (bullish).
Buy setup (if wave 4 completes):
Buy zone: 4193 – 4190
Stop loss: 4180
Take Profit: 4236
🔹 4. Alternative Scenarios
If price breaks sharply above 4381, the current wave count will be invalidated, and price could head toward 4451.
If price forms a triangle, with 4381 as the upper boundary and higher-low supports forming the lower edge, a breakout above 4381 would signal a Buy opportunity.

Elliott Wave Analysis XAUUSD – October 19, 2025
1️⃣ Momentum
D1 Timeframe:
Daily momentum is showing early signs of bearish reversal.
As mentioned in the previous plan, a daily reversal could occur on Friday or Monday.
The strong bearish D1 candle on Friday reinforces this signal.
If another bearish D1 candle appears on Monday, it will confirm that the main trend for the coming week is likely to turn bearish, pushing D1 momentum toward the oversold zone.
H4 Timeframe:
H4 momentum is preparing to turn upward, suggesting that the initial downside movement on Monday may not be too strong.
A short-term recovery bounce is likely.
However, if this bounce fails to break the previous high and momentum reverses downward again, it will confirm the start of a more stable downtrend.
H1 Timeframe:
H1 momentum is currently in the overbought zone, which indicates a short-term pullback may occur early in Monday’s session.
2️⃣ Wave Structure
D1 Structure:
We can see a strong bearish candle — the largest since the beginning of the uptrend, signaling the first warning of exhaustion.
Together with the D1 momentum reversal, this suggests the yellow wave 3 is likely coming to an end, and yellow wave 4 is starting to form.
In terms of time, wave 4 could take more than a week to complete.
H4 Structure:
A sharp decline has pushed the price back inside the ascending channel, indicating that the extended wave 5 may have already ended.
If confirmed, the market could continue down toward at least the previous blue wave 4 area.
However, because H4 momentum is preparing to rise, a short-term upward correction may occur early Monday.
If this upward move is slow and overlapping, fails to break the previous high, and H4 momentum turns down again, that will confirm the completion of blue wave 5.
H1 Structure:
On the H1 chart, the blue wave 5 from H4 is detailed into five smaller red waves.
The recent steep and fast decline suggests a five-wave bearish pattern, possibly wave 1 of a new downtrend or wave A of a corrective move.
There is also a possibility of a Flat correction, where wave C extends to 1.618 × wave A (as discussed in the October 17 plan).
Overall, the market may present a short-term recovery bounce, providing a buy opportunity early in the week.
3️⃣ Trading Plan
Buy Zone: 4153 – 4151
Stop Loss: 4141
Take Profit: 4193
Alternative Scenario:
If price fails to break below 4193, monitor H1 momentum as it enters the oversold zone and turns upward — that will be a potential buy signal.
In that case, key support areas to watch include: 4243 – 4226 – 4207 – 4194.
