Target hit on XAU/USD
On 13/08/2025, the XAU/USD trade successfully reached its target, delivering a strong and profitable outcome. The trade was planned using a combination of technical analysis and market fundamentals, focusing on key support-resistance levels and price action signals. Once the entry was triggered, gold prices moved consistently toward the target, showing clear momentum in the anticipated direction. A weaker U.S. dollar and ongoing global economic uncertainty further supported bullish movement in gold. The trade never came close to the stop loss, which reflects the accuracy of the setup and the effectiveness of the strategy. Achieving the target reinforced the importance of disciplined risk management and sticking to the trading plan without emotional interference. This win on 13/08/2025 not only provided a solid return but also strengthened confidence in the overall trading approach, proving that patience and precise execution can consistently lead to profitable results in XAU/USD trading.
Xauusdlong

xau/usd
This XAU/USD trade setup is a buy trade, designed for a very short-term move in gold prices. The entry price is 3346, the stop-loss is set at 3342, and the exit price is 3348. The trade aims for a small 2-point profit while risking 4 points, meaning the risk-to-reward ratio is lower than 1:1, which makes it suitable only for quick scalp trading strategies.
Buying at 3346 suggests the trader expects a slight upward movement, possibly triggered by short-term momentum, minor support holding, or quick price fluctuations during active market hours. The target at 3348 is very close to the entry, meaning this trade relies on precise timing and fast execution to capture small gains.
The stop-loss at 3342 is set just below the entry to limit losses if the market moves against the position. Given the tight range, any sudden volatility could hit the stop-loss quickly.
This type of trade requires constant monitoring, rapid decision-making, and disciplined risk control. While the profit target is small, consistent scalp trades like this can add up over time if executed with accuracy and strict trading discipline.

XAU/USD Bullish Bounce from Demand Zone !Gold (XAU/USD) on the 4H chart is showing a potential bullish reversal setup. Price has pulled back into a Fair Value Gap (FVG) and high supply/demand zone near 3,329–3,315, aligning with the 0.382–0.5 Fibonacci retracement.
Key Points:
Support Zone: 3,329–3,315 (demand + FVG).
Bullish Rejection Expected: Price may bounce from this zone, targeting upper resistance levels.
Upside Targets:
TP1: 3,356
TP2: 3,375
TP3: 3,440–3,459 (major resistance)
Invalidation: A daily close below 3,315 could open room for deeper downside toward 3,278–3,245.
Indicators: EMA(9) and Ichimoku showing potential for trend resumption if price closes above 3,362.
Overall, the chart suggests a buy setup on bullish confirmation, aiming for the 3,375–3,459 zone.

Gold LongEntry- 3355-3352
SL- 3349
Target- 3368, 3370, 3375
Reason- Gold has broken out of a falling trendline in 1hr TF with a strong candle. News is also there that trump is not going to put tariff on gold bars.
Disclaimer- This is just for educational purposes please take advice before making any decision.
Jai Shree Ram.

XAU/USDThis XAU/USD trade setup is a buy trade, reflecting a bullish outlook on gold prices. The entry price is 3388, with a stop-loss at 3380 and a target exit price at 3454. The trade aims to capture a 13-point gain while limiting the risk to 6 points, offering a solid risk-to-reward ratio of over 1:2.
Buying at 3388 suggests that the trader expects gold to rise, potentially driven by a weaker US dollar, lower bond yields, or increased global economic uncertainty, which boosts demand for gold as a safe-haven asset. The exit price at 3406 is likely set just below a resistance level where the trader anticipates price action may slow or reverse.
The stop-loss at 3380 is placed closely below the entry to protect against sudden downside moves. Given the tight stop, the trade requires good timing—ideally after bullish confirmation or during strong upward momentum.
This setup is ideal for short-term intraday trading, combining limited risk with decent reward potential. Sticking to the plan with disciplined execution and proper risk management increases the chances of a successful outcome in this XAU/USD trade.

XAU/USDThis XAU/USD trade setup is a buy trade, reflecting a bullish outlook on gold prices. The entry price is 3393, with a stop-loss at 3387 and a target exit price at 3406. The trade aims to capture a 13-point gain while limiting the risk to 6 points, offering a solid risk-to-reward ratio of over 1:2.
Buying at 3393 suggests that the trader expects gold to rise, potentially driven by a weaker US dollar, lower bond yields, or increased global economic uncertainty, which boosts demand for gold as a safe-haven asset. The exit price at 3406 is likely set just below a resistance level where the trader anticipates price action may slow or reverse.
The stop-loss at 3387 is placed closely below the entry to protect against sudden downside moves. Given the tight stop, the trade requires good timing—ideally after bullish confirmation or during strong upward momentum.
This setup is ideal for short-term intraday trading, combining limited risk with decent reward potential. Sticking to the plan with disciplined execution and proper risk management increases the chances of a successful outcome in this XAU/USD trade.

maintain uptrend, buy gold 3350Plan XAU day: 04 August 2025
Related Information:!!!
Gold prices (XAU/USD) retain a subdued tone during the first half of the European session on Monday, although the absence of sustained selling pressure keeps the metal within reach of the one-week high recorded earlier in the day. The US Dollar (USD) begins the new week with a modest recovery, partially retracing Friday’s decline triggered by softer-than-expected US employment data, supported in part by a rebound in US Treasury yields. This recovery exerts downward pressure on demand for the precious metal.
Nevertheless, the USD's upside remains limited amid increasing expectations that the Federal Reserve (Fed) will resume interest rate cuts as early as September. This anticipation continues to provide support for the non-yielding yellow metal. In addition, a broadly cautious market mood—driven by persistent trade uncertainties and heightened geopolitical tensions—reinforces the appeal of Gold as a safe-haven asset and advises restraint among bearish market participants
personal opinion:!!!
Accumulated price zone around 3350 - 3364, buying power maintained. Gold buying point following the uptrend line today
Important price zone to consider : !!!
Support zone point: 3350 zone
Sustainable trading to beat the market

Gold (XAU/USD) in Symmetrical Triangle – Short‑Term Squeeze,Price Structure & Technical Setup
Gold is consolidating within a symmetrical triangle, showing lower highs and higher lows—a classic precursor to breakout in either direction
Fxglory Ltd
+5
TradingView
+5
Babypips.com
+5
TradingView
+2
Babypips.com
+2
TradingView
+2
.
Trendlines converge tightly around $3,326–$3,334, hinting at imminent directional acceleration
Investopedia
+4
TradingView
+4
TradingView
+4
.
🎯 Key Levels & Targets
Scenario Trigger Confirm Area Targets Stop Loss
Bullish Breakout above $3,344–$3,350 $3,369 → $3,396 → $3,422–$3,550 ~$3,340
Bearish Breakdown below ~$3,326–$3,320 $3,320 → $3,300 → $3,297 → $3,255 ~$3,335–$3,340
A breakout above $3,344–$3,350 validated with volume may drive prices toward $3,400+, with extended targets up to $3,550 or higher in bullish conditions
Traders Union
Time Price Research
.
A drop below $3,326–$3,320 risks further decline, targeting $3,300, $3,297, and eventually $3,255 if breakdown momentum builds .
📉 Market Context & Drivers
U.S. dollar strength, easing safe-haven demand, and optimistic trade sentiment are constraining gold’s upside unless breakout forces emerge .
Key upcoming catalysts: FOMC guidance, U.S. macro data (GDP, inflation), and geopolitical developments—their tone could tip the bias direction .
⚙️ Trade Rules & Risk Management
Wait for a confirmed breakout or breakdown—do not trade mid-range.
Confirm break with at least one close outside the triangle and rising volume .
Position sizing: Risk 1–2% per trade, adjust stop-loss to price structure ($8–$15 depending on volatility).
Take profits in stages: scale out at minor milestones (first targets), trail stop for extended targets.
Avoid chasing price within the middle of the triangle—risk/reward is unfavorable.
🧠 Why This Plan?
Follows textbook symmetrical triangle trading methodology: entry on breakout, stop beyond pattern opposite side, projection based on triangle height .
Aligns with broader outlook: bearish unless convincing upside breakout appears, consistent with analyst consensus hedging current bull exhaustion and wait‑and‑see on policy signals .
✅ Summary
Gold is coiling inside a tight triangle range near $3,326–$3,334, with breakout potential identified to either side:
Bullish breakout over $3,344–$3,350 targets up to $3,550 or beyond.
Bearish breakdown under $3,326–$3,320 risks slide towards $3,300–$3,255.
Wait for confirmation, apply disciplined risk controls, and let volume validate the move.

XAU/USDThis XAU/USD trade setup is a buy trade, showing a bullish view on gold. The entry price is 3288, the stop-loss is 3278, and the exit price is 3327. This setup aims for a 39-point gain while limiting the risk to 10 points, which gives a strong risk-to-reward ratio of nearly 1:4.
Buying at 3288 suggests that the trader expects gold prices to rise due to favorable market conditions, such as a weaker US dollar, lower bond yields, or increased demand for gold as a safe-haven asset during economic uncertainty. The target at 3327 is likely set near a resistance level where profit can be booked once the price moves upward.
The stop-loss at 3278 protects the trader from excessive losses if the market reverses and moves downward. Since the stop-loss is tight, the trade requires close monitoring, and it is best executed during periods of strong bullish momentum in gold.
With disciplined risk management and strict adherence to the plan, this trade offers a good opportunity to profit from short-term price movement. Sticking to the entry, stop-loss, and target levels without emotional trading increases the chances of consistent success.

Breaking 3322, gold price continues to recoverPlan XAU day: 29 July 2025
Related Information:!!!
Gold prices (XAU/USD) advance to a new intraday high during the first half of the European session on Tuesday, recovering from the nearly three-week low around the $3,300 level reached the previous day. As market participants absorb the latest wave of trade-related optimism, lingering uncertainty ahead of this week’s key central bank events and high-impact US macroeconomic releases continues to lend support to the safe-haven precious metal.
At the same time, the US Dollar (USD) has eased slightly from its highest level since June 23, providing an additional tailwind for gold. Nonetheless, the increasingly widespread expectation that the Federal Reserve (Fed) will maintain elevated interest rates for an extended period is likely to limit any significant USD correction. Consequently, this may act as a headwind for the XAU/USD pair as attention turns to the highly anticipated FOMC meeting set to commence later today.
personal opinion:!!!
Gold price recovered, broke 3322. Good buying power, continued to recover and accumulate above 3300
Important price zone to consider : !!!
Support zone point: 3322, 3302 zone
Sustainable trading to beat the market

XAU/USDThis XAU/USD trade setup is a buy trade, indicating an expectation that gold prices will rise. The entry price is 3318, the stop-loss is set at 3307, and the exit price is 3346. This setup shows a bullish outlook on gold, with the trader aiming to capture an upward move of 28 points from entry to exit. The stop-loss at 3307 limits the downside risk to 11 points, providing a reasonable risk-to-reward ratio of more than 1:2.
Buying at 3318 suggests that the trader expects gold to gain strength due to factors such as a weaker US dollar, lower Treasury yields, or increased demand for gold as a safe-haven asset. The target of 3346 is set at a key resistance level, where the trader expects to book profits.
Proper risk management is essential because gold can be volatile, especially during major economic news releases or geopolitical events. The trade should be monitored closely, ensuring that market conditions support a bullish move.
Overall, this setup provides a structured plan to enter long at 3318, place a tight stop-loss at 3307, and exit at 3346, aiming for disciplined and profitable trading in XAU/USD.

XAU/USDTrading XAU/USD, which represents gold priced in US dollars, requires a well-planned strategy that includes a defined entry price, stop-loss, and exit price. In this trade setup, the entry price is set at 3332, the stop-loss is placed at 3311, and the exit price or target is 3376. This setup suggests a bullish outlook on gold, meaning the trader expects the price to rise after entering the trade.
Entering at 3332 indicates that the trader is confident in buying gold at this level, expecting upward momentum. The target price of 3376 is approximately 44 points higher than the entry, offering a good potential profit. By setting the stop-loss at 3311, which is 21 points below the entry, the trader is managing risk in case the market moves against the position. The risk-to-reward ratio in this trade is favorable, as the potential reward is about twice the risk.
Gold prices are often influenced by factors such as inflation, interest rates, US dollar strength, and global economic uncertainty. A bullish position might be supported by weaker US economic data, lower Treasury yields, or geopolitical tensions that increase demand for gold as a safe-haven asset.
This trade setup is best executed with proper risk management, ensuring that only a calculated portion of the trading capital is risked. It is important to monitor market conditions closely, as gold prices can be volatile due to sudden news events or changes in investor sentiment.
Overall, the trade aims to capitalize on upward momentum from 3332 to 3376, while limiting potential losses with a well-placed stop-loss at 3311. Following the plan with discipline and avoiding emotional trading is key to achieving consistent results in XAU/USD trading.

POSITIVE Vision!IF Prices stands over 3406! We can expect a bullish months ahead.
Else in a big TF we are in super over bought conditions. We can see a big free fall at any times. Happy Monday folks!

Gold (XAU/USD): Supply Zone Rejection & Bearish Breakdown Chart Breakdown:
Supply zone rejection: Gold revisited the “supply zone” (light green/grey area) and failed to break above — a classic signal of seller dominance.
Uptrend invalidated: A sharp rise (steep black trendline) ended with a peak marked by the green arrow, followed by a decisive breakdown.
Ichimoku Cloud test: Prices slipped through the Ichimoku components, reinforcing the shift to bearish sentiment.
Potential targets: The red/green risk‑reward box highlights a short position, targeting ~3,347 then ~3,318 levels (blue labels) as initial support zones.
Strong supply base: The extensive grey zone below marks a "stronger supply zone" — this could cap any modest bounce and keep the downtrend intact.
🔍 Interpretation:
Bias: Bearish — sellers have taken control after a failed breakout.
Strategy: Short on rallies toward the mid‑green/red box (~3,373–3,380), targeting ~3,347 first and then ~3,319. Watch for support at the strong supply region (~3,292) for potential reversal or consolidation.
Risk management: Keep stop above the red zone—above recent highs (~3,380+) to limit risk.
🚀 In a nutshell: After failing to break supply and losing its short‑term uptrend, gold appears poised for a pullback. The next key levels to watch are ~3,347 and ~3,319—where buyers might step back in, or the downtrend continues toward the deeper supply base.

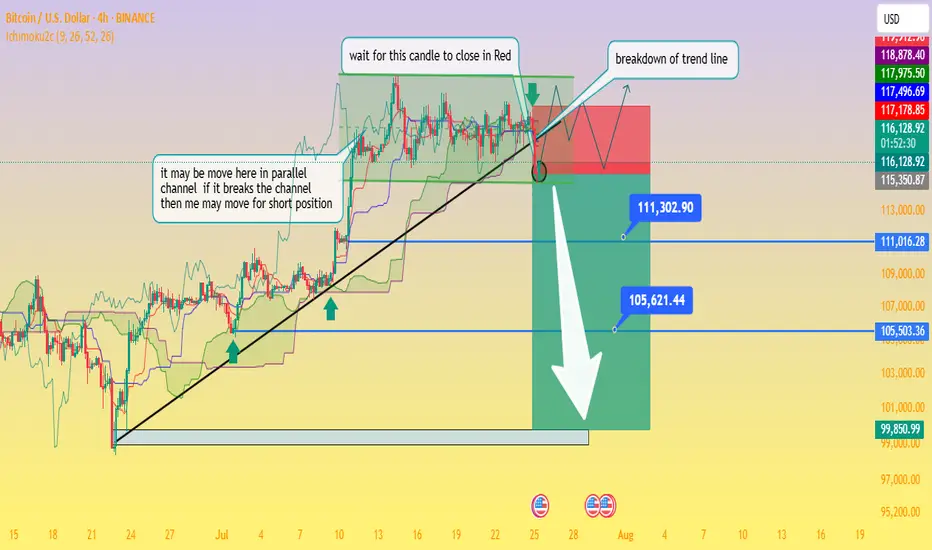
Critical Breakdown: BTC/USD Poised to Fall — Waiting on H4 CloseAnalysis of the BTC/USD 4‑Hour Chart
From the chart you provided, here's how the technical situation looks:
Ascending trendline support has been tested multiple times and was recently breached this afternoon, signaling a possible shift from the bullish setup to a bearish continuation.
The price is now trapped within a descending triangle formation beneath a well‑defined swing high resistance zone. This reflects indecision in the market, with neither buyers nor sellers in clear control
Business Insider
+15
Fxglory Ltd
+15
Bitcoin News
+15
.
Key levels to monitor:
Support zone: ~$115,500, extending down to ~$111,300 and ~$105,600 as deeper targets if bearish momentum strengthens.
Resistance zone: ~$119,000–120,000 area, forming strong overhead supply
Economies.com
DailyForex
Bitcoin News
.
The chart’s annotations align with a classic breakout strategy—with the caveat: wait for a confirmed close below the trendline before considering short positions (as noted in your “wait for this candle to close in red” comment).
Breakout confirmation would likely pave the way toward your indicated profit zones near ~$111k and ~$105k, with a larger potential down to ~$99.8k if further downside pressure builds.
🔍 What the Broader Market Signals
Technical sentiment from sources covering today’s analysis shows BTC/USD hovering just under $120,000, stuck within the defined range of $115.5k support to $120k resistance
Economies.com
.
While there’s still neutral momentum in indicators like RSI and MACD, the short-term direction leans bearish if the breakdown is confirmed on the H4 timeframe
Fxglory Ltd
.
Analysts emphasize that sustained movement above $116.5k could retarget resistance near $119–120k. A failure there and a move below $115.5k may thrust price deeper toward your downside zones
DailyForex
.
✅ Trading Strategy Overview
Scenario Trigger Target Levels
Bearish Breakdown H4 candle closes below trendline ~$115.5k $111.3k → $105.6k → possible $99.8k zone
Bullish Rejection Bounce back above ~$116.5k and trending above resistance $119k–120k retest, potential breakout if sustained
Neutral / Wait-and-see No decisive candle close yet Hold for confirmation
⛳ Final Thoughts
chart highlights a critical point: don’t act prematurely. Wait for a decisive H4 candle close below the trendline before committing to shorts. Confirmed bearish action around the breakout could open the path to the lower targets you identified. However, if price rebounds above support and climbs above $116.5k, a short-term retest of $119k–120k is still in range.
Traders should maintain prudent risk management—watching the unfolding price action around these pivot points without overreaching. Let me know if you'd like help crafting entry/exit zones or risk profiles for this setup!
XAU/USD
On July 25, a strategic trade setup was identified in the XAU/USD pair with an entry price at 3371, a stop-loss at 3364, and a target exit at 3385. The trade capitalized on bullish momentum following a minor pullback, offering a favorable risk-to-reward ratio of approximately 1:2. The price action showed strong support near the 3365 level, where buyers had previously stepped in, indicating a solid base for a potential upward move.
Entering at 3371 allowed the trade to ride the bullish wave as price moved above a short-term resistance. The stop-loss at 3364 was placed strategically just below the recent swing low, protecting capital in case of a reversal. The target at 3385 was aligned with a key resistance zone from earlier sessions, offering a realistic and achievable exit.
This setup was ideal for intraday or short-term traders looking to take advantage of price volatility in gold. Technical indicators, such as RSI and MACD, supported the bullish bias, and volume showed a surge during entry time. The trade closed in profit at 3385, reflecting a successful execution based on disciplined entry and exit criteria. Such trades highlight the importance of planning, analysis, and timely action in gold trading.

Gold price increased, broke 3360Plan XAU day: 21 July 2025
Related Information:!!!
Gold prices (XAU/USD) are extending their upward momentum for the second consecutive session on Monday, as buyers remain cautiously optimistic and await a decisive breakout above a multi-week trading range before committing to further gains. The US Dollar (USD) begins the new week on a softer footing amid mixed signals regarding the Federal Reserve’s (Fed) interest rate outlook—an important factor currently supporting the precious metal.
Additionally, persistent concerns over the potential economic consequences of former President Donald Trump’s unpredictable trade policies are bolstering gold’s appeal as a safe-haven asset.
personal opinion:!!!
Short term H1 frame, gold price breaks 3360 forming bullish structure. Uptrend continues to maintain
Important price zone to consider : !!!
resistance zone point: 3377 zone
Sustainable trading to beat the market

Gold-XAU Bullish movement from Golden zone.Gold showing a bullish structure by breaking last swing high in one hour and price making a pull back to the golden zone. Possibly reacting from golden zone. buy side entry if ltf conformations are met .Target 3375. sl below zone

XAUUSD ANALYSIS 14 JULY 2025 9.45 AMhere is analysis for Gold/XAUUSD hin Hindi and According to Indian Standar Time

price increase, gold price towards 3385Plan XAU day: 14 July 2025
Related Information:!!!
An already fragile global risk sentiment has deteriorated further in response to renewed tariff threats from US President Donald Trump targeting two of the country’s major trade partners—Mexico and the European Union. In separate letters sent on Saturday to European Commission President Ursula von der Leyen and Mexican President Claudia Sheinbaum, President Trump announced the potential for new tariffs, adding to more than 20 similar notices issued since last Monday.
This latest development has dampened investor appetite for riskier assets, as reflected in the broadly weaker tone across global equity markets, and may continue to provide support for safe-haven assets such as gold. However, mixed signals regarding the Federal Reserve’s near-term interest rate trajectory are preventing XAU/USD bulls from making aggressive moves or extending the recent rally to multi-week highs
personal opinion:!!!
Trade tensions between two major regions: the US and the EU, have made gold prices positive again, and market concerns that DXY and EURO will restrain each other's value.
Important price zone to consider : !!!
resistance zone point: 3385 zone
Sustainable trading to beat the market

Gold price stabilizes above 3300Plan XAU day: 10 July 2025
Related Information:!!!
Gold prices (XAU/USD) have pared a portion of their modest intraday gains but continue to maintain a positive bias for the second consecutive day, trading around the $3,320 level during the early European session on Thursday. Ongoing uncertainties surrounding US President Donald Trump’s trade policies and their potential implications for the global economy are keeping investors cautious. In addition, expectations that the Federal Reserve (Fed) will lower interest rates later this year continue to lend support to the non-yielding precious metal.
Meanwhile, the minutes from the Federal Open Market Committee (FOMC) meeting released on Wednesday indicated limited support for a potential rate cut as early as this month. This has provided a boost to the US Dollar (USD), which—alongside a broadly positive tone in equity markets—is capping the upside potential for gold as a safe-haven asset. As such, it would be prudent to await confirmation through sustained buying interest before anticipating further gains, as market participants turn their attention to upcoming US Weekly Jobless Claims data and speeches from Federal Reserve officials for near-term trading cues
personal opinion:!!!
Market accumulates, sideways above 3300 waiting for US unemployment news today
Important price zone to consider : !!!
support zone point: 3307 zone
Sustainable trading to beat the market

Gold Price Setup: Bullish Continuation or Rejection? 🧠 Chart Analysis (XAU/USD – 1H):
Key Structure Highlights:
CHoCH (Change of Character) zones marked both up and down indicate a battle between bulls and bears.
Recent bullish CHoCH followed by a fair value gap (FVG) retest suggests potential continuation to the upside.
Price recently bounced strongly from demand zone, shown by the green arrows and strong candle reaction.
Ichimoku Cloud:
Price is trying to break back above the Kumo (cloud), a sign of bullish momentum building.
However, resistance is still present with the Kijun and Tenkan lines converging.
FVG (Fair Value Gap):
The current price is attempting to fill and break above the FVG zone.
A successful breakout above this area confirms bullish intention.
Fibonacci Levels:
Price is hovering around the 0.5 - 0.618 retracement zone, often a strong reversal or continuation point.
Upside targets lie near the 0.786 retracement (3352) and ultimate target at 3391, a major resistance level.
Risk Management:
Trade setup shows an excellent Risk:Reward ratio.
Stop-loss placed just below the last structure low.
Potential downside to 3290–3258 if breakout fails.
🟢 Possible Next Move:
Bullish Scenario: If price clears the FVG and breaks above 3353, expect continuation to 3391.
Bearish Rejection: If rejected at FVG/0.618 level, watch for a drop back to 3290 or even 3259.

Gold/USD Bullish Breakout Toward Target Zone Gold/USD Bullish Breakout Analysis 🚀🟢
The chart illustrates a strong bullish breakout from a consolidation zone, signaling upward momentum:
🔍 Key Technical Observations:
Support Zone: The price respected the support area around 3,325 – 3,330 USD, forming a solid base for reversal.
Bullish Structure: Series of higher lows and higher highs indicate a bullish trend formation.
Breakout Confirmation: Price broke above short-term resistance with a strong bullish candle, indicating buying pressure.
Trendline Support: The ascending trendline has held well, confirming trend continuation.
Target Point 🎯: Projected target is near 3,365 USD, which aligns with a previous resistance and Fibonacci confluence zone.
✅ Conclusion:
The breakout above resistance, supported by a bullish structure and momentum, suggests further upside potential toward the 3,365 USD target zone. As long as price holds above the breakout level, bullish bias remains valid.
🛑 Watch for invalidation if price falls back below 3,330 USD zone.
