#XAU/USD Sell Trade Scenario.Here’s an up-to-date XAU/USD Sell trade outlook (technical + fundamental) to help you assess whether positioning for a Downside makes sense right now.
Thank You......
Xauusdshort

#XAU/USD Sell Trade Scenario.Here’s an up-to-date XAU/USD Sell trade outlook (technical + fundamental) to help you assess whether positioning for a Downside makes sense right now.
Thank You......

Trump Davos Warning Keeps Gold in Strong UptrendMarket Context (News → Flow)
Comments from Trump at Davos, including renewed threats and pressure around Greenland, have escalated geopolitical uncertainty during the Asian session.
Markets reacted in classic risk-off mode:
USD weakens amid political uncertainty
Equities hesitate, risk appetite fades
Safe-haven flows rotate into Gold, driving momentum higher
Gold is not moving on speculation — it is reacting to capital seeking protection.
Technical Structure (H1 – SMC)
Overall structure remains bullish, confirmed by multiple BOS
Price is trending inside a well-defined ascending channel
Recent pullback respected the bullish FVG, showing strong demand
No bearish acceptance below structure at this stage
➡️ FVG respected → continuation remains in play
Key Decision Zones
Upper FVG: 4,765.425
Mid support: 4,727.188
Current impulse high: 4,883.900
These are reaction zones, not chase levels.
Scenarios (If – Then)
Primary Scenario – Trend Continuation
If price holds above 4,765.425
Bullish structure remains intact
Gold can continue advancing toward higher channel resistance
Alternative Scenario – Technical Pullback
If price loses 4,765.425
A pullback toward 4,727.188 is possible for rebalancing
Only a clear H1 close below 4,727.188 would weaken the bullish bias
Summary
Geopolitical rhetoric is accelerating volatility, but structure still leads the narrative.
Gold is not reacting emotionally —
it is pricing risk.

Gold (XAUUSD) Restistance @ 4710 - 4720 | Will it fall?Gold (XAUUSD) has shown a strong rally due to geopolitical situation between US and Europe but it's approaching resistance zone 4710 - 4720 and also overbought. We are looking for sell on rise opportunity as this area is strong supply zone, and fall is likely to happen.
📉 Trade Idea:
Look for sell opportunities in the 4710 – 4720 zone.
Targets and risk levels are clearly outlined on the chart.
⚠️ This is a counter-trend / pullback trade, best suited for intraday or short-term traders. Manage risk accordingly.
📌 Disclaimer:
This analysis is for educational purposes only and is not financial advice. Always manage risk and follow your trading plan.
Your feedback drives our content and keeps everyone trading smarter. Let’s make those pips together! 🚀
Happy Trading,
– The InvestPro Team

XAUUSD Consolidation Below Resistance!Chart Analysis (XAUUSD – 1H)
Market Structure:
Price is ranging just below a major resistance / supply zone (~4,630–4,640). Multiple rejections here show distribution rather than clean breakout strength.
Higher Time Frame Context:
A bullish higher-timeframe trendline is rising from below.
There is a higher-timeframe FVG (Fair Value Gap) resting beneath current price (~4,520–4,560 area).
This suggests bullish bias overall, but short-term pullback is likely before continuation.
Liquidity & POI:
Equal highs / resting liquidity above the range.
A marked POI (Point of Interest) sits just below current price inside the supply zone.
Red dotted path suggests a fake breakout or liquidity grab, followed by a drop into demand
Sell Scenario (Short-Term / Intraday)
Bias: Short-term bearish (pullback)
Sell Entry Options:
Rejection sell from supply zone
Entry: 4,625 – 4,640
Confirmation: bearish candle / long upper wick / momentum lo
Liquidity sweep sell
Price spikes above range highs → fails to hold → sell on breakdown back below 4,620
Stop Loss:
Above recent high: 4,660 – 4,680
Targets:
TP1: 4,590
TP2: 4,560
TP3: 4,520 (HTF FVG + trendline confluence)
Buy Scenario (High-Probability Swing Setup)
Bias: Medium- to higher-timeframe bullish
Buy Entry Zone:
4,520 – 4,560
HTF FVG
Rising trendline
Prior demand zone
Confirmation (Preferred):
Bullish engulfing / strong impulsive candle
Liquidity sweep of lows then reclaim
Stop Loss:
Below FVG & trendline: 4,480
Targets:
TP1: 4,600
TP2: 4,640
TP3: 4,680 – 4,700 (range highs / breakout extension)
Summary
Short-term: Expect rejection or fake breakout → sell opportunity.
Mid-term: Look for deep pullback into HTF FVG → strong buy setup.
Key Idea: Sell the premium, buy the discount in an overall bullish structure.

XAUUSD/GOLD 1H SELL LIMIT PROJECTION 19.01.26✅ XAUUSD / GOLD (1H) – SELL LIMIT PROJECTION (19.01.26)
Gold is currently respecting the 1H downtrend line, and price is moving in a bearish structure. Even though we saw a bullish engulfing reaction from demand, this move is likely a pullback before bearish continuation.
📌 Key Levels
🔴 Supply / Resistance Zone: 4615.608
This level is acting as a premium zone + resistance area.
⚫ Key Mid Support/Resistance: 4585.679
Important reaction level. Price must reclaim & hold above this for further upside push.
🔵 Demand / Support Zone: 4576 – 4578
Strong demand region where buyers previously entered and formed engulfing.
📍 Current Market Price: 4596.320
📉 Trade Idea (Sell Limit Setup)
✅ Sell Limit Entry: 4610 – 4615 (inside supply + trendline confluence)
🛑 Stoploss: 4628 – 4630 (above supply highs)
🎯 Targets:
TP1: 4585.679
TP2: 4576 – 4578 (Demand zone)
📊 Risk-Reward: 1:2
🧠 Setup Logic
✔ 1H trendline still bearish
✔ Entry at premium / supply zone (4615.608)
✔ Target into support/demand zone (4576 – 4578)
✔ High probability continuation after pullback
⚠️ Confirmation: Watch for bearish rejection / wick near 4615 zone

XAUUSD No breakout today, only liquidity and structure🟡 XAUUSD – Intraday Smart Money Plan
📈 Market Context
Gold remains structurally bullish on the higher timeframe (HTF), but intraday price action is currently transitioning into a controlled corrective phase after buy-side liquidity has already been delivered.
With ongoing USD volatility, U.S. yield fluctuations, and Fed rate-cut speculation, Smart Money is not pushing aggressive continuation today. Instead, price is being engineered around premium and discount liquidity zones.
Ahead of U.S. macro events, Gold is behaving typically near extremes:
inducement → liquidity sweep → mean reversion, rather than impulsive trend extension.
🔎 Technical Framework – Smart Money Structure (H1–M15)
Current Phase:
HTF bullish bias remains intact, while intraday structure shows rotation and consolidation following the completion of buy-side liquidity grabs.
Key Idea:
• Look for short opportunities from premium supply
• Or long re-entries from discount demand aligned with the higher-timeframe trend
Structural Notes:
• HTF BOS confirms bullish dominance
• Buy-side liquidity already taken
• Price is rotating, not expanding impulsively
• Internal FVG acting as a downside magnet
• Discount demand aligns with prior order block (OB) support
💧 Liquidity Zones & Trade Ideas
🔴 SELL GOLD 4618 – 4620 | SL 4628
🟢 BUY GOLD 4578 – 4576 | SL 4568
🧠 Institutional Flow Expectation
Liquidity sweep → MSS / CHoCH → BOS → displacement → OB/FVG retest → expansion
🎯 Execution Rules
🔴 SELL GOLD 4618 – 4620 | SL 4628
Entry Conditions:
✔ Price taps premium supply
✔ Buy-side liquidity taken above recent highs
✔ Bearish MSS / CHoCH on M5–M15
✔ Clear downside BOS
✔ Entry via bearish FVG or supply OB
Targets:
• 4595 — internal reaction
• 4578 — liquidity pool
• Trail aggressively (distribution setup)
🟢 BUY GOLD 4578 – 4576 | SL 4568
Entry Conditions:
✔ Liquidity sweep into discount demand
✔ Confluence with OB + FVG
✔ Bullish MSS / CHoCH on M5–M15
✔ Strong upside BOS with displacement
✔ Entry via refined bullish order block
Targets:
• 4618 – 4620 — first reaction
• 4670 — internal liquidity
• 4700+ — continuation if expansion resumes
⚠️ Risk Notes
• Premium zones are liquidity traps
• Expect fake breaks during news volatility
• No entry without MSS + BOS confirmation
• Reduce position size near extremes
📍 Summary
Gold remains bullish by structure, but today is about execution, not prediction:
• 4618 – 4620 may offer a Smart Money distribution short
• 4578 – 4576 is the key discount zone for long reloads

Gold isn’t trending today — it’s rotating to engineer liquidity.🟡 XAUUSD – Intraday Smart Money Trading Plan
📈 Market Context
Gold remains structurally bullish on the higher timeframes, following a strong expansion into previous highs. However, today’s price action is not impulsive. Momentum has slowed, and the market is transitioning into a rotation and rebalancing phase.
With USD volatility, shifting Treasury yields, and ongoing rate-cut speculation, Smart Money is no longer chasing price. Instead, liquidity is being manufactured between premium and discount zones through inducement, stop hunts, and controlled pullbacks.
Today is about execution, not prediction.
🔎 Technical Framework – Smart Money Structure (H1–M15)
Market Phase:
HTF bias: Bullish (BOS confirmed)
Intraday: Corrective rotation after buy-side liquidity delivery
Key Observations:
Buy-side liquidity has already been taken
Price is rotating, not expanding impulsively
Internal FVG acts as a downside magnet
Discount demand aligns with HTF EMA + order blocks
💧 Liquidity Zones & Trade Scenarios
🔴 SELL XAUUSD 4643 | SL 4648
Narrative: Premium Distribution
Price may retrace into a premium zone where Smart Money looks to distribute positions after inducing late buyers.
Entry Conditions:
✔ Price taps the 4643 premium zone
✔ Liquidity sweep above recent highs
✔ Bearish MSS / CHoCH on M5–M15
✔ Clear downside BOS
✔ Entry via bearish FVG or supply OB
Targets:
4610 — internal reaction
4585 — main liquidity pool
Trail aggressively (distribution setup)
🟢 BUY XAUUSD 4580 | SL 4574
Narrative: Discount Accumulation
A deeper pullback into discount may be used to reload long positions before the next expansion phase.
Entry Conditions:
✔ Sell-side liquidity sweep into 4580
✔ Confluence with discount zone + OB + FVG
✔ Bullish MSS / CHoCH on M5–M15
✔ Strong upside BOS with displacement
✔ Entry via refined bullish order block
Targets:
4620 — first reaction
4680 — internal liquidity
4720+ — ATH continuation if expansion resumes
🧠 Expected Institutional Flow
Liquidity sweep → MSS / CHoCH → BOS → Displacement → OB/FVG retest → Expansion
No sweep → no trade
No structure → no entry
⚠️ Risk Management Notes
Highs are liquidity traps, not breakout zones
Expect false breaks during news volatility
No entry without confirmation (MSS + BOS)
Reduce size near premium extremes
📍 Summary
Gold is bullish by structure, but today’s movement is rotational:
4643 may deliver a Smart Money sell
4580 may reload longs for the next push higher
Let liquidity move first.
Let structure confirm second.
Smart Money controls the game. ⚡️

Technical Analysis on goldGold has recently experienced a strong upside move, primarily driven by heightened geopolitical tensions, which fueled safe-haven demand. This aggressive move resulted in a gap-up opening, leaving an unfilled gap around the 4508 level, which remains an important technical magnet.
From a technical perspective, price is currently trading within an ascending structure but is showing signs of compression near the upper boundary, suggesting potential exhaustion. A short-term triangle / consolidation structure is forming, indicating that a decisive move may be imminent.
The key level to watch is 4565.
A sustained break and acceptance below 4565 would confirm a shift in momentum and strengthen the bearish case.
If the rising trendline is broken, it would signal bearish continuation, with increased downside momentum likely to follow. In such a scenario, price could retrace further to fill the unfilled gap near 4508, which aligns with prior demand and liquidity.
From a fundamental standpoint, while gold initially rallied on geopolitical stress, recent developments suggest some easing in risk sentiment. Reduced escalation and a softer geopolitical tone have slightly cooled safe-haven flows, supporting a short-term bearish bias unless new risk catalysts emerge.
That said, the bullish scenario remains valid if geopolitical tensions escalate again. In such a case, renewed safe-haven demand could push gold higher, with a potential breakout above the previous ATH and extension toward the 4670 zone.
Summary
Bullish above trendline & resistance break → potential ATH continuation toward 4670
Bearish below 4565 & trendline break → downside continuation toward 4508 gap fill
Market currently at a decision point, awaiting confirmation
⚠️ As always, wait for confirmation and manage risk accordingly.

Gold (XAUUSD) 1D Chart Analysis – Buy/Sell Levels with TargetsGold is showing strong momentum after breaking important levels. Here’s a simple analysis with clear buy and sell points, target, and stop-loss guidance for traders. Perfect for intraday and positional trading.

XAUUSD/GOLD 1H BULLISH ENGULFING BUY PROJECTION 07.01.26Falling Wedge pattern (Bullish Reversal) on XAUUSD – 1H timeframe.
Why this is a Falling Wedge 👇
Price is making lower highs and lower lows
Both trendlines are converging
Selling pressure is reducing
Pattern forms after an uptrend → healthy pullback
What it indicates 📈
Bullish reversal / continuation
High probability of upside breakout
Best used for BUY setups
Your chart logic is correct because:
Entry is near wedge support
Stop-loss placed below structure support
Target toward previous resistance / ATH
Risk–Reward ≈ 1:2 (good trade management)
Trade idea summary:
Pattern: Falling Wedge
Bias: Bullish
Action: Buy on breakout / confirmation
Target: Resistance / ATH zone
SL: Below wedge + support

“Gold Base Holds — Ready for Breakout?”📊 Technical Chart Analysis (XAU/USD)
📌 Key Levels
Strong Support Zone (Red Box) – Price has been respecting this area and has bounced multiple times — signaling accumulation/support.
Mitigated FVG & CHoCH Area (Green Zone) – This area shows prior imbalance and a possible change of character, now acting as resistance.
Higher Resistance Region (Dark Grey) – A key supply zone the price may target if bullish momentum continues.
Important Horizontal Levels:
• Around ~4300—support (green line)
• Around ~4258—deeper support (red horizontal)
📈 Bullish Scenario (Preferred)
✔ Price is holding above support.
✔ A potential CHoCH (Change of Character) indicates buyers may be stepping in.
✔ The mitigated FVG zone above ~4375/4400 is a logical target if bullish momentum resumes.
✔ The black dashed path on your chart suggests a retest of the support before continuation.
Bullish Path:
Retest support
Bounce and clear local resistance
Rally up toward the grey supply zone above ~4400–4500
📉 Bearish Alternative
If support breaks decisively:
Price could revisit the deeper support ~4258 (red horizontal)
Then possibly resume higher momentum from that level (red dashed path)
🧠 Fundamental Reasons Supporting Bullish Gold (2026)
Here are core macro drivers that could push gold prices higher:
✔ 1. Central Bank Buying & Safe-Haven Demand
Major central banks have been accumulating gold reserves aggressively, reinforcing structural demand and reducing available supply.
The Times of India
✔ 2. Anticipated Monetary Easing
Markets increasingly expect interest rate cuts or easier policy from major central banks in 2026. Lower rates reduce the opportunity cost of holding gold (which doesn’t yield interest).
State Street Global Advisors
✔ 3. Weakening U.S. Dollar
Gold is priced in USD — a weaker dollar typically boosts gold due to increased purchasing power for foreign buyers.
State Street Global Advisors
✔ 4. Geopolitical & Economic Uncertainty
Inflation risk, geopolitical tensions, and global macro instability have historically driven capital into gold as a hedge and safe-haven asset.
Financial Times
✔ 5. Portfolio Diversification & ETF Inflows
Record flows into gold ETFs and strategic institutional allocations have supported price strength.
Morgan Stanley
🟢 Bullish Fundamental Summary
Gold’s fundamentals point to a continued structural bull cycle — even if price consolidates in the short term. Central bank demand, possible rate cuts, USD weakness, and geopolitical uncertainty all provide strong backing for a continued uptrend into 2026.
State Street Global Advisors
+1
📌 Technical + Fundamental Confluence
Bullish Scenario is stronger if:
• Support holds above ~4300–4258
• Price breaks above mitigation zone around ~4400
• Volume increases on upward moves

XAUUSD (Gold) TECHNICAL OUTLOOK | 6th Jan'2026Gold is trading near 4,450, consolidating after a strong bullish rally. Price remains well above key moving averages, keeping the overall trend firmly bullish across intraday to higher timeframes.
Bullish View:
As long as gold holds above 4,445–4,450, upside momentum remains intact. A move above 4,470 can push prices toward 4,490 and 4,505–4,515, with 4,550 as a major resistance zone.
Bearish View:
A break below 4,445 may trigger a short-term pullback toward 4,430 and 4,410–4,395. Unless these levels break decisively, dips are likely corrective.
Intraday Focus:
Prefer buy-on-dips near support, while watching 4,500–4,515 for possible rejection.
Conclusion:
Trend remains strongly bullish. Expect volatility, but bias favors buyers unless key supports fail.

XAUUSD ANALYSISI have market the possible wave count as per my analysis we can see new high in upcoming months before new high we can see 10 percent correction in gold in upcoming days this is simple correction all metals are bullish as per my analysis. i am attaching last analysis of gold also.
Thanks
Ishu Prajapati

XAUUSD!The chart is in negative divergence with selling volumes on spike.
Jan month XAUUSD FUTURES can be shorted from here with $4150 as targets with $4660 as Stoploss.

XAUUSD H1 Main Trend for the Weekend
Gold failed to confirm a sustainable upward momentum after yesterday's price reaction, prioritizing a short-term adjustment scenario before reassessing the trend
PRIORITY SCENARIO
Strategy to sell based on reactions at large volume areas, suitable for the current short-term structure
Focus sell area: 4332 – 4342
Technical basis: these are areas concentrated with volume according to the Volume Profile, where price is likely to show distribution reactions after a weak recovery
Expected movement: price recovers to the large volume area for distribution, then continues the adjustment phase
Daily target:
Heading towards the 4275 area, coinciding with the Fibonacci retracement area and underlying support
Position management:
Sell should only be held short-term. If the price surpasses and stabilizes above 4342, risk should be reduced and avoid holding sell orders.
ALTERNATIVE SCENARIO
Monitor price reactions at deeper support areas to reassess trading opportunities
Strong support area: around 4275
Technical context: this is the convergence area between structural support and Fibonacci retracement, likely to show defensive buying force
Expected movement: if the price reacts well at this area, the market may enter a re-accumulation state
MAIN REASON
On H1, the previous upward phase failed to maintain a clear upward structure, indicating weakening buying force
Volume Profile helps identify the 4332 – 4342 areas as advantageous entry points for the sell reaction scenario
The 4275 area serves as a reasonable adjustment target in the context of a typically momentum-lacking weekend market
MACRO CONTEXT AND MEDIUM-TERM OUTLOOK
While short-term fluctuations lean towards adjustment, major institutions still maintain a positive outlook for gold in the medium and long term. Goldman Sachs forecasts gold prices could reach $4,900/oz by the end of 2026, supported by strong buying demand from central banks and positive impacts from the Fed's interest rate cut cycle.
This suggests that short-term declines may be more of a technical adjustment rather than a reversal of the long-term trend.

XAUUSD (H1) – Friday Weekend
Lana prioritizes the adjustment phase towards the POC area, looking to Sell in the liquidity zone 💛
Quick Summary
Context: Friday, the market often tends to take profits and sweep liquidity before the week closes
Monitoring Frame: H1
Main Viewpoint: Prioritize a decrease during the day (adjustment phase)
Key Point to Note: 4308 has reacted multiple times, a sensitive point in the structure
Market Context
The weekend is usually a time when the cash flow is “lighter” and price behavior tends to lean towards profit-taking. Therefore, an adjustment phase to gain more liquidity is the scenario Lana prioritizes today.
From a medium-term perspective, some large institutions still maintain a positive view on gold. However, in intraday trading, Lana still prioritizes following the current price behavior and trading according to the liquidity zone.
Technical View H1
On H1, the price is fluctuating around the accumulation zone, and the POC/VAL area indicates this is a market zone that has been “back and forth” for quite a while. When the price returns to these areas, there is usually a clear reaction.
The 4308 area is noteworthy because the price has reacted multiple times, so this is a point that could determine whether the adjustment phase continues.
Today's Trading Scenario
Main Scenario – Sell at POC/VAL area (large liquidity)
Sell: 4335 – 4340
Lana prioritizes waiting for the price to rebound to this area to sell according to the adjustment phase. This is a large liquidity zone, suitable for finding a downward reaction during the day.
Alternative Scenario – Buy scalping at near support
Buy: 4284 – 4289
This Buy order is only for scalping when the price hits the support area and a bounce reaction appears. If the market continues to be weak, Lana will not hold the Buy for too long.
Session Notes
If the price continues to be rejected around resistance areas and cannot surpass the supply zone, the adjustment scenario will have an advantage.
For Friday, Lana prioritizes light trading, quick closing, avoiding holding positions too long over the weekend.
Lana's Notes 🌿
Each scenario is just a probability. Lana always sets a stop loss first, chooses the appropriate volume, and is ready to skip if the price does not reach the waiting area.

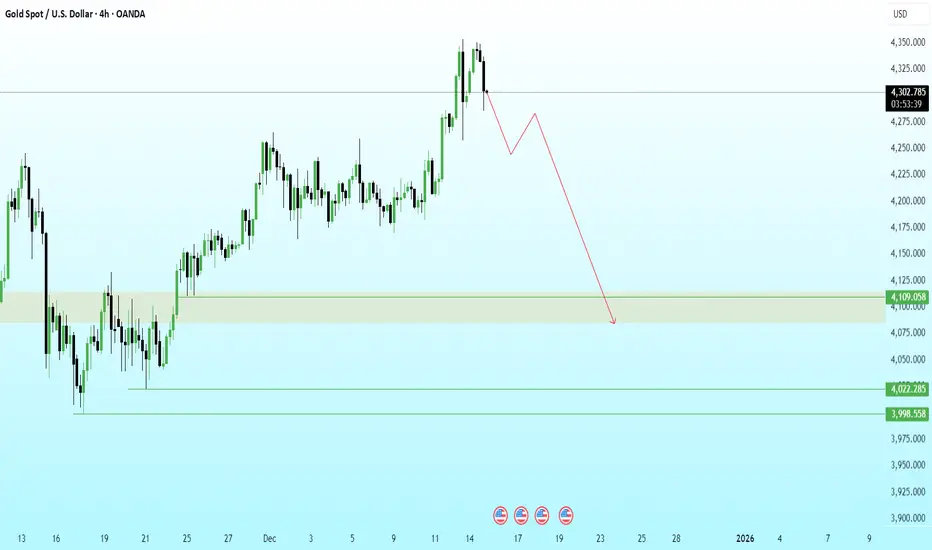
GOLD 4H | Liquidity Harvest Done… Now the Slide BeginsPrice engineered liquidity above the previous swing high and immediately delivered a sharp rejection, confirming a buy-side liquidity grab and the start of distribution.
Structure has now shifted bearish with a clear BOS from the premium zone. I’m expecting a mitigation leg before continuation lower.
The draw on liquidity sits inside the 4100–4080 demand imbalance, which aligns with unmitigated bullish orders from the prior accumulation phase.
If 4100 fails to hold on mitigation, the next liquidity pools rest at:
4022 (clean sell-side pocket)
3998 (final downside liquidity target)
XAUUSD – Brian | Volume Profile before FedXAUUSD – Brian | Volume Profile before Fed: watch for a rebound to sell down
Market snapshot
Ahead of the Fed's interest rate announcement, gold is moving sideways within a fairly wide range, not yet choosing a clear direction.
In the H1 timeframe, the price fluctuates around the value area, making it very suitable for short-term trading according to the Volume Profile instead of trying to predict the meeting outcome.
Volume Profile – Key price areas
Nearest VAL: around 4.197 – the bottom of the current value area, where there was previous buying support.
Above, the FVG area + VAH/POC cluster is around 4.210 – this is an "air pocket" area where selling pressure can easily appear when the price fills the liquidity gap.
Below, the target for a downward wave if the Fed is not too dovish is around 4.13x (area 4.130–4.135) – coinciding with the old buy zone on the chart.
Trading scenario according to Volume Profile
Watch for a light Buy reaction at VAL 4.197
If the price slides to 4.197 and a nice rejection candle appears on H1/M15, a short scalp buy can be considered:
Idea: capture the rebound from VAL back to the middle/top of the value area, do not hold the position long.
Sell when the price fills FVG around 4.210 (priority scenario)
After the rebound from VAL, the FVG area 4.210 will be where Brian prioritizes watching for a Sell:
Reference sell entry: around 4.208–4.212
TP1: 4.185–4.180
TP2: 4.165–4.160
TP3: area 4.13x (4.130–4.135) if a strong sell-off occurs after the Fed
SL should be placed neatly above the FVG/VAH area (e.g., 4.218–4.220), avoid setting it too far.
Fed context – Why trade cautiously?
The focus this week is the FOMC meeting:
The market is waiting to see if Chairman Powell can create enough consensus to continue cutting interest rates with very few members opposing, similar to the previous 25 bps cut.
If the Fed maintains a dovish tone → USD weakens, yields cool down, gold is likely to bounce back after the sweep.
If Powell signals a "hawkish rate cut" (concern about inflation, cut less – talk tough) → yields rise, gold may complete a deep decline to the 4.13x area before stabilizing again.

XAUUSD - Gold Spot US Dollar Technical Analysis🟢 BUY zones + buy confirmation levels
🔴 SELL zones + sell confirmation levels
🚫 NO-TRADE zone
🎯 TP (Take Profit) levels
🛑 SL (Stop Loss) levels
📌 Why buy / why sell (Price-Action logic)
✅ 1. NO-TRADE ZONE (as on chart)
The shaded middle area 4,150 – 4,210 is a NO-TRADE ZONE.
❌ Why no trade here?
Price is compressing sideways.
No fresh demand or supply.
Buyers/sellers both weak → liquidity building.
Best area to wait for breakout above or below.
🟢 2. BUY SETUP (Bullish Scenario)
✔ Buy Trigger
Buy ONLY above: 4,265 → clean breakout from supply
When price breaks and closes above 4,265, it confirms:
Supply removed
Trend continuation
Buyers taking control
🛑 Buy Stop-Loss
Place SL below the breakout candle or safe level:
SL = 4,198 – 4,210 zone (mid-zone)
Because if price falls back inside zone → fake breakout.
🎯 Buy Take Profit Levels
TP1 → 4,320 – 4,350
TP2 → 4,449 (major supply zone)
TP3 → 4,550+ if strong momentum continues
📌 Why Buy?
Break above previous high
Clean imbalance above (room to move)
Price action pattern → Break of Structure (BOS)
Market in bullish expansion when above 4,265
🔴 3. SELL SETUP (Bearish Scenario)
Sell only when price breaks below NO-TRADE ZONE.
✔ Sell Trigger
Sell below: 4,096 (break of demand)
This confirms:
Demand removed
Trend shift to bearish
Sellers active after taking liquidity from the range
🛑 Sell Stop-Loss
SL above failed demand zone:
SL = 4,150 – 4,170
🎯 Sell Take Profit Levels
Use the marked blue lines:
TP1 → 3,991
TP2 → 3,952
TP3 → 3,901
TP4 → 3,762 (extended target)
📌 Why Sell?
Break of key structure level (4,096)
Below range → trend continuation short
Liquidity targets below (equal lows + imbalances)
Price action → Lower Low + Lower High continuation
🔥 PRICE ACTION LOGIC (Simple Explanation)
✔ Buy Logic
Market is accumulating in the NO-TRADE zone
Break above 4,265 = buyers win
Price targets previous supply zones
✔ Sell Logic
If price breaks below 4,096, demand collapses
Market enters markdown phase
Lower supports become liquidity targets

XAUUSD – Ahead of NFP: Buy with Wolfe Wave, Watch for Sell ...XAUUSD – Ahead of NFP: Buy with Wolfe Wave, Watch for Sell Setup at the Extension Zone
Gold continues its upward momentum as the USD weakens sharply, breaking the descending trendline and forming a Wolfe Wave pattern on the H1 chart.
Price is currently rotating around the POC – VAH cluster of the previous distribution zone, making it very likely to react before the NFP release.
At this stage, I prioritise buying with the main trend, but I also prepare a short-term sell setup if the market becomes “overstretched” before the news.
🎯 Scenario 1 – Priority BUY at POC/VAH
Buy: 4,209 – 4,212
SL: 4,205
TP: 4,233 – 4,260 – 4,299
Reason:
Price is retesting the POC – VAH cluster right after breaking above the descending trendline.
The Wolfe Wave structure points toward higher targets, aligning with the continuation of the bullish trend.
The 4,209–4,212 zone offers good liquidity, allowing a tight stop loss while maintaining an attractive R:R.
🔁 Scenario 2 – SELL Reaction at the Upper Extension Zone
Sell (only if a clear reversal signal appears): 4,323 – 4,325
SL: 4,333
TP reference: 4,299 – 4,260 – 4,233
Reason:
The 4,323–4,325 zone is an upper extension area, overlapping with the Wolfe Wave resistance and a previous supply zone.
If price is “pushed” into this region before NFP, and H1 candles show long upper wicks or weakening volume, I will consider it a counter-trend sell opportunity back toward the POC/support areas.
This is a counter-trend trade, so position size should be smaller and execution must be clean and quick.
1️⃣ Fundamental View Before NFP
The USD is attempting to recover from its late-October lows but is restricted by expectations of the Fed turning dovish soon.
Recent data shows a cooling U.S. economy and a slowing labour market—raising the probability of a 25bps rate cut at the upcoming FOMC meeting.
Additional developments:
The Government Accountability Office has launched an investigation involving a “Fed critic.”
Kevin Hassett stated that he believes the Fed may cut rates soon.
These factors strengthen the narrative that the interest rate peak is behind us.
Although Challenger job cuts dropped sharply compared to the previous month, the overall economic picture still suggests slowing growth, which supports gold in the medium term.
Summary:
Fundamentals remain supportive for gold.
NFP will only determine how deep or how fast the next correction will be—not a trend reversal unless the numbers are extremely out of expectations.
2️⃣ Technical Outlook from the Chart
On H1, gold has broken the descending trendline and moved back above the POC area of the previous downmove.
A Wolfe Wave pattern has formed, projecting targets higher than current price.
Price is currently hovering around POC – VAH:
If it holds above 4,209–4,212, the next targets are likely 4.26x–4.29x.
If price gets strongly rejected near 4.32x before or after NFP, this becomes a valid zone to look for sell reactions.
3️⃣ Trading Plan & Risk Management
Priority: BUY at 4,209–4,212, SL 4,205, TP 4,233–4,260–4,299
Sell setup at 4,323–4,325 is activated only when reversal signals appear
If NFP causes excessive volatility, prioritise waiting for price to stabilise around the POC before re-entering new setups.

#XAUUSD Breakout failureXAUUSD after making an attempt to break previous supply, made a #Breakout failure and dropped, currently in distribution.
First line of support, 4181. Last line to defend - 4179. and could possible to drop to 4080 levels to grab the #Liquidity.
Lets watch out.

Key-Resistance Liquidity Grab → FVG ShortIdea:
Price has reached a key resistance zone — a common place where smart money or institutions may hunt liquidity (stop-losses above resistance before reversing).
There is an unfilled Fair Value Gap (FVG) / imbalance zone drawn below (green “POI / FVG” zone). In price-action trading, these FVGs often act like magnets: after a rapid move, price tends to retrace and “fill” the gap.
The plan: wait for a rejection at resistance (signaling liquidity grab is done), then short — target the FVG/POI zone where the market may come back to fill imbalance.
🎯 Trade Plan (Entry / Exit / Risk-Reward)
Parameter Plan
Entry After a bearish rejection (e.g. long upper-wick candle) near the resistance zone.
Stop-Loss Slightly above the resistance / recent swing high (to avoid being stopped by a false breakout).
Take-Profit (TP) Around / within the FVG / POI zone (green zone on chart) — where imbalance may be filled.
Risk–Reward Aim for at least 1 : 2 — ideally more, depending on how far the FVG is below resistance.
⚠️ What Makes This Setup Valid (and What to Watch)
FVGs mark market inefficiencies / liquidity gaps created by rapid moves, which often get revisited.
A reversal or rejection at a well-defined resistance zone gives signal that the liquidity hunt may be done and a move downward may begin.
But — if price breaks cleanly and strongly above the resistance (with momentum), the short trade becomes invalid.
Also, FVGs don’t always get filled. Entry should ideally wait for a clear rejection or confirmation, not just assume a fill.
