XRPUSDT - FORMING A BULLISH STRUCTURESymbol - XRPUSDT
CMP - 2.5500
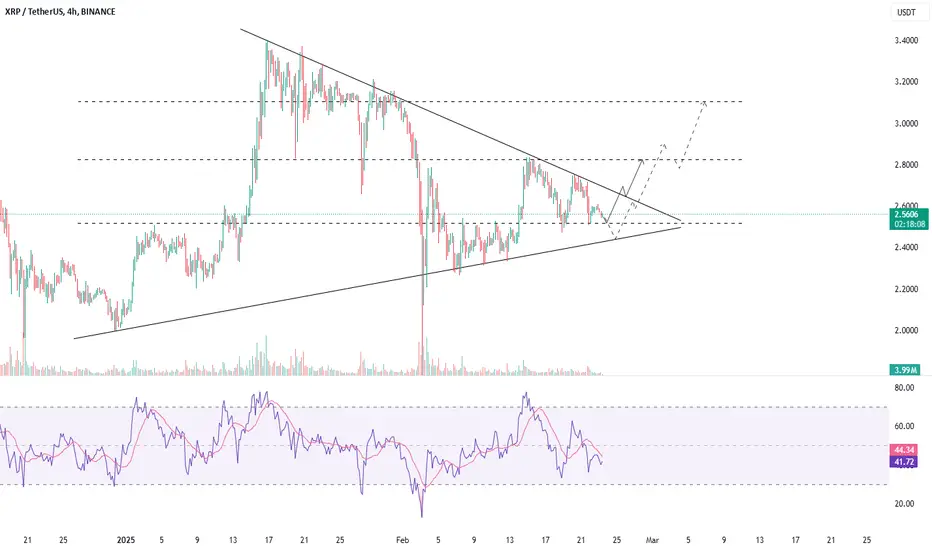
XRPUSDT has been exhibiting a range-bound behavior recently, currently trading within a symmetrical triangle formation, indicating potential for a breakout in either direction. This pattern suggests that there is a convergence of support and resistance, and the price could move decisively once it breaks out of this range. Price is also forming a support area, suggesting a strong foundation for a potential upward move, especially if key levels are breached.
While the symmetrical triangle is a typical continuation pattern, the direction of the breakout is still uncertain due to the consolidation phase. Both upward and downward movements are possible depending on how the price interacts with key levels in the near term. I am closely monitoring the price action at these levels, as it could provide the clues necessary to gauge the next potential move.
From a fundamental perspective, the XRP market has seen some buzz surrounding the potential approval of an XRP-based ETF. This rumor has stirred investor sentiment, making the $2.83 level an important threshold. A break and consolidation above this level could trigger a continuation of the upside, especially if positive developments around the ETF rumor materialize. This could act as a major catalyst for a rally, especially if the broader market conditions remain favorable.
Key Support levels: $2.51, $2.00
Key Resistance levels: $2.83, $3.10
If XRP manages to break and hold above $2.83, it could initiate an upward push towards higher resistance levels, potentially igniting a stronger bullish momentum. However, caution should be exercised as the price could first face a retest of support before making any significant movement.
On the other hand, we should also keep an eye on the $2.51 - $2.48 level. A break of this support level could indicate a shift towards a downward trend, sending the price to test lower supports. However, if the price holds above this level, it could form a rebound, giving bulls another chance to push the price higher.
On both the daily and weekly timeframes, the consolidation following the recent rally remains a positive sign, suggesting that the upward momentum could resume once the price breaks out of the symmetrical triangle. As we navigate this phase, both long and short setups are still valid, depending on how the price behaves in relation to these key levels.
In summary, the market is in a phase of consolidation with a potential for upside movement if key resistance levels are cleared, especially with the underlying ETF rumors providing additional bullish sentiment. On the flip side, any breach of support levels could signal a corrective phase.
Xrpusdtrading
XRPUSDT - CORRECTION WITHIN BULLISH TREND?Symbol - XRPUSDT
Yesterday evening, XRPUSDT retraced the previous decline but encountered significant resistance, which defines the upper boundary of the descending channel. This may lead to a potential correction. Following a notable upward movement, XRP is now entering a corrective phase, which is occurring within a descending channel or flag pattern. The nature of this pattern suggests a continuation of the prevailing trend, with the broader market trend remaining bullish.
From a technical perspective, a false breakout of resistance and a subsequent correction are plausible, with a potential pullback to the 3000 level before the market begins to develop the momentum for a breakout of the channel’s resistance, thus facilitating further upward movement.
Key support levels: 3000, 2900
Key resistance levels: 3145, 3200
The liquidity zone between 3145 and 3200 may initially prevent the price from breaking higher. In the short term, I anticipate a false breakout followed by a correction to the targets outlined in the chart.

XRPUSDT Wave CountsHi, As per my analysis in upcoming days or in this month we can see a level breakout of xrp .7400 which is a sign of continuation of bullish trend if this level is taken out
Hope for the best
Thanks
Ishu Prajapati

XRPUSDT in parallel Channel and bullish on chart long buyTechnical Analysis:
1. Backtesting within the last 7 days shows that there are no specific patterns observed in the MACD, RSI, BOLL, and KDJ indicators.
2. Backtesting within the last 30 days also does not show any specific patterns in the MACD, RSI, BOLL, and KDJ indicators.
3. The current price of XRP is $0.5794, with a 24-hour price change of +4.62% and a 7-day price change of +5.58%.
4. The BOLL support price is $0.5693, and the BOLL resistance price is $0.5883.
Fundamental Analysis:
1. XRP is the currency that runs on the RippleNet payment platform, which aims to enable instant monetary transactions globally.
2. The total supply of XRP is 100,000,000,000 tokens, with a circulation supply of 45,404,028,640 tokens.
3. The market capitalization of XRP is $32,044,348,010.
4. The current trading volume for XRP is $73,202,253.74.
Based on the technical analysis, there are no specific patterns observed within the last 7 and 30 days. As for the fundamental analysis, XRP is a digital payment platform that facilitates instant monetary transactions globally. The current market capitalization and trading volume indicate the popularity and liquidity of XRP.
Please note that this analysis is based on the provided data, and it is recommended to conduct further research and analysis before making any investment decisions.
Risk Disclosure: Predictions are for reference only, not investment advice. Investing involves risks; please make decisions cautiously.


XRPUSDT LongXRPUSDT Long
IMO
Give a Like and Feel free to share your opinions in the comment!
Happy Trading 😊

XRP hitting our targets ...Xrp was in news for a couple of days and since the last news in favor with XRP, it resulted in a good buying volumes. Follow me and stay updated on different crypto news and stocks analysis.
Check out my website Coinexpress.tech , where I post daily analysis.
