part 2prev analysis target taken.
Recovery inefficency at 83k
first long term bullish : pullback to hhh
bearish : persistent downtrend
t1 78-77 (>50%)
t2 74-72
tomorrow daily candle will be important to understand if its a drawdown or a change in trend.
Trendline long term still bullish.
Crypto market

BTC Monthly CandlesBTC 1M
Here is an update on the monthly chart of btc where i specify the Dec2024 monthly doji candle as a bearish sign. Although the Jan2025 candle is bullish and produce a new ATH, it still fails to breakout from the trendline resistance where all ATHs' are connected. Getting our starting reference point from 2017ath, we can see from here the market cycle of 3:1 bear:bull ratio. Also noted that an ATL is established 1 year after making an ATH;
•2017ath to 2018atl
•2021ath to 2022atl
Since price tap on our trendline resistance, big question is, will this be this cycle's top? February candle is currently printing a -17% with 2 days to go before closing. Trump tariff impacted the market heavily. "Twice". There is also the $1.4B ByBit hack.
Anyways, key support level lies at 72~73k level around the wave3&B Leg. This is ideal to be hit to fully fill the gap on this monthly candles. I think the 70k is a protected zone because this is also the range of 2021ath.

Bitcoin Daily just landed on the 200 SMA - what now ?Many people are expecting Bitcoin to Bounce off the 200 day SMA ( yellow & Arrowed)
But I just want to point out what happened last time we tanged for a long time.
We did NOT bounce of it untill PA was ready to
In fact, er fell below numerous times.
So, SORRY, don;t get your hopes up BUT we can watch and react.......
It may bounce but I doubt for long.....
Time will tell

Is Bitcoins NUPL showing us we already had 2 cycle Tops ?As explained by Trading View
"Indicator Overview NET UNREALISED PROFIT LOSS - NUPL
This indicator is derived from Market Value and Realized Value, which can be defined as:
**Market Value: The current price of Bitcoin multiplied by the number of coins in circulation. This is like market cap in traditional markets i.e. share price multiplied by number of shares.
**Realized Value: Rather than taking the current price of Bitcoin, Realized Value takes the price of each Bitcoin when it was last moved
It then adds up all those individual prices and takes an average of them. It then multiplies that average price by the total number of coins in circulation.
By subtracting Realized Value from Market Value we calculate Unrealized Profit/Loss.
The Net Unrealized Profit/Loss (NUPL) for Bitcoin can drop due to several factors.
One significant reason is the correction in Bitcoin's price
This price correction can push the NUPL indicator closer to the fear area, which begins after a drop below 0.25.
Additionally, short-term holders (STH) may still be experiencing capitulation, indicating that new investors are still underwater.
This can cause the NUPL to reflect deeper pessimism among newer investors, even if the overall market sentiment shows signs of optimism.
SO, we can see from the chart how, back in 2021, NUPL went up and peaked twice - each occasion was around the 1st major ATH and then Cycle ATH in Nov 2021.
Also note how the NUPL was lower the 2nd time round as Most major profit taking had been taken in March and so the next lowest Buy price was on the Dip before PA began to rise, and so the profit margin was lower
We have just experienced a similar thing this cycle..The peaks of profit taking were a similar number of days apart and om a similar Range to 2021
And now, we see the NUPL Dropping.
This is. to remind you, the fact that PA is dropping and Short term holders, who bought High, are now in Loss, underwater.
Does this mean that we are at cycle end ?
NOT AT ALL
But it does very clearly show how all th epeople that said "This time is different" WERE RIGHT
So, Hang on Guys and Gals, - it is different,
Keep your eyes on NUPL,it is a great way of seeing Market Profits and how, when nthis is high, Profit taking is very likely to happen
It is also a great signal as to when to BUY, when this is Low....it is usually because PA is LOW

SOL Long OpportunityMarket Context:
SOL has seen a significant drop in recent weeks but has now entered a key support zone. This could present a potential bounce to test the next resistance levels.
Trade Details:
Entry Zone: $132 - $144
Take Profit Targets:
$168
$195
Stop Loss: Just below $130
This setup aims to capture a potential recovery as SOL stabilizes at support and looks for upside continuation. 🔥

$ETH - What do you think what should be the target?AMEX:ETH is broken down the channel and moving for next downside target, as of now it looks around 2390 usd and next would be around 2160 usd. Many things will depend on how CRYPTOCAP:BTC will react, there might be some small pullbacks, but I am assuming that these targets will be met.

BNB COIN: Breakout Expected1. Testing the resistance of ATH.
2. Bouncing from the EMA.
2. Dz is playing out for the price to push to the higher levels

BTC#18: BTC plunges, destination and trading opportunities at th🔥 So BTC has corrected. However, how much it has decreased, we will analyze it right away: 🔥
1️⃣ **Fundamental analysis:**
📊 Widespread Pessimism, Cryptocurrency Market Plunges Sharply
————
⚫Bitcoin and altcoins plunge: Bitcoin drops nearly 5% to $90,000, Ethereum loses more than 10% in two days, Solana drops 15%, Dogecoin drops 13%.
⚫The market is still affected by the $1.4 billion hack last week. Bybit announces compensation but Ethereum is still under pressure.
⚫Weak market sentiment: Many meme coins collapse, limited capital flows cause altcoins to lose value sharply. Solana under selling pressure as it prepares to unlock $1.72 billion in tokens on March 1.
⚫Crypto-related stocks also plunge: Coinbase down for six consecutive sessions, MicroStrategy down 5.7%, BTC mining stocks fall sharply.
🚀 MicroStrategy continues to buy BTC: The company bought another 20,356 BTC worth $1.99 billion, bringing its total BTC holdings to 499,096 VND (~$33.1 billion).
🛫Forecast: The downtrend may continue if market sentiment does not improve and cash flow does not return to altcoins.
2️⃣ **Technical analysis:**
🔹 **Frame D**: the bullish structure has been broken and turned bearish. Pessimistic sentiment covers the entire market so it will be difficult to see an immediate recovery
🔹 **H4 frame**: the bearish price structure is more clearly shown. The nearest resistance zone is 93x
🔹 **H1 frame**: the price line is still quite far from the horizontal or diagonal resistance zone, the current price has recovered a bit but the market sentiment is still hesitant about the Fibo 23.6 area as you can see on the chart
3️⃣ **Trading plan:*
⛔The current time is not suitable to catch the bottom of BTC, not only the market sentiment is pessimistic but the basic information has not seen any positive news for BTC. We will need to patiently wait for confirmation from the price line
✅ Priority at the moment. Currently is looking for a SELL position following the main trend. The sharp price drop will have a recovery adjustment but pay attention to stick to the price structure and do not be greedy.
💪 **Good luck trading!**

Bitcoin buy 87500-87000 SL 85500 Target 94300-700How to take trades using Harmonic pattern projection Trade setup is explained below :-
Entry : 1st D point : 0% is recent top or bottom.
Trailing SL: 11.4% is work as trailing SL of buy or sell trade if hit then we have to book profit
.If price goes below 21.4% then early traders can make fresh reversals trade after breaking 11.4% safe traders can reversal trade after breaking 21.4%
Targets :
Target T1 : 28.3% ( early trade if entry at 11.4% )
Target T1 : 35.1% to 38.2%
Target T3 : 50.1% to 53.2%
T3: 61.8% to 65.1% is our 3rd Target since this is reversal zone so must book profit if break then take fresh trade again
Target T4 : 76.4% to 79.7%
Next Targets are 100% , 127.2% ,141.4% and final Target 161.8%.
How to take reversal trade :
If price going upside/ downside then then buy or sell levels appear on Chart ( Automatically show when price reach any reversal zone of harmonic projection pattern based .
After showing reversal levels wait for confirmation until 21.4% or 28.3 % level not break if break then exit from current buy / sell trade and take fresh reverse trade buy/ sell .
Trailing SL:
After reach 1st Target trail SL to just above or below cost ( for example we are holding sell trade from 100 1st Target 110 hit then move trailing sl to 104-105 and move SL as price move upside or Downside)
Re- Entry :
For Re-entry in any pull back Point D ( 11.4% ) is used for re-entry then SL recent high or low Point D ( 0% ) .
Target is same as early 21.4% , 28.3 , 35.1 and so on
Blue Line is 1st support/ Resistance
Green line is 2nd support/ resistance
Red line is 3rd Support/ resistance

BITCOIN TESTING $87K - FALSE OR TRUE BREAKDOWN?Symbol - BTCUSD
CMP 87100
BTCUSD has entered a risk zone, exhibiting a breakdown of the key support level. The market's attention is now on the bulls and their ability to maintain their defense. On the daily and weekly timeframes, the price is in a phase of global consolidation following a period of significant upward movement. The focus remains on the $90-91K range, a strong support area that aligns with the broader trend. Currently, a breakdown of support appears to be unfolding.
On the local timeframes (H1 - H4), the price is testing the support of the local channel, as well as the risk zone at 87,000. If the bulls are able to sustain their defense above 86,400 level, Bitcoin could potentially strengthen. In this scenario, the primary target would be $91-92K
Key support levels: 86,400, 85,530
Key resistance levels: 89,400, 91,600
Historically, the most significant price movements tend to occur after a false breakdown. However, the critical factor here is whether the breakout is genuine or false. In this case, confirmation is required — specifically, price consolidation above the key zones and levels.
Regarding my previous BTCUSD analysis, I had projected a decline to the $90K risk zone while Bitcoin was trading around $96-97K at that time. After some consolidation, the analysis proved accurate as Bitcoin dropped to the $90K range.
I believe this recent sell-off has disrupted the previous bullish structure, and a bearish structure is now beginning to take shape. I expect a retracement to the $91-92K range before the downtrend continues.

the crypto will correct more!!BTC CMP 87200
Fibs- the crypto is at fib support at 86800. I think it will break it and come down to 82300.
Trendline - the break of the trendline means more correction on the way.

So, the Range box WAS hiding a Secret - what now for Bitcoin
2 days ago, I posted and showed why the Current Range Box of Bitcoin may have had a bearish secret and, well , It happened.
Currently, PA has fallen out of Range and is sitting on levels of Low support
And, as I have been saying since November, there is a CME Gap from 80700 down to 77535
This Gap may get filled as this could be an excellent opportunity to do so.
It is also a great chance for us mere mortals to buy a few More Sats of a Bitcoin at a cheaper price than previously.
And I will, I do not believe this cycle is over yet...
Notice the 2.272 Fib line at 78920 which will offer support and then, just below that we have a rising Long Term line of support at around 76100, depending where PA hits it, should the support above fail.
Of course, we should remember that PA may turn around now, and reclaim a higher high
We have to Watch and react to what happens...
Stay safe

Bitcoin long term sell given103000 , 86500 Target hit 69500 nextHow to take trades using Harmonic pattern projection Trade setup is explained below :-
Entry : 1st D point : 0% is recent top or bottom.
Trailing SL: 20.2% is work as trailing SL of buy or sell trade if hit then we have to book profit
.If price goes below 20.2% then early or risky traders can reversal trade ,
Targets :
Target T1 : 28.3%
Target T1 : 37.8 %
Target T3 : 48.1%
T3: 60.2% to 66.9 % is our 3rd Target since this is reversal zone so must book profit if break then take fresh trade again
Next Targets are 77.5 % , 88.1 % 100% , 113.5 % , 127.3% , 141.2% and 160.2 , 177.5. final Target 200%
160.2 to 177.5% if profit booking area so book full profit and wait for reversal.
How to take reversal trade :
If price going upside/ downside then then buy or sell levels appear on Chart ( Automatically show when price reach any reversal zone of harmonic projection pattern based .
After showing reversal levels wait for confirmation until 20.2 % or 28.3 % level not break if break then exit from current buy / sell trade and take fresh reverse trade buy/ sell .
Trailing SL:
After reach 1st Target trail SL to just above or below cost ( for example we are holding sell trade from 100 1st Target 110 hit then move trailing sl to 104-105 and move SL as price move upside or Downside)
Re- Entry :
For Re-entry in any pull back Point D ( 10.1% ) is used for re-entry then SL recent high or low Point D ( 0% ) .
Target is same as early 20.2% , 28.3 , 37.8 and so on
Blue Line is 1st support/ Resistance
Green line is 2nd support/ resistance
Red line is 3rd Support/ resistance

Is Bitcoins Range Box maybe hiding a bearish secret ? CAUTION ?
I have been talking about his range box that PA is in for a while and, at the same time, referenceing the previous 2 times PA has done this this Cycle.
But I also pointed out recently how this range is slightly different and possibly in a bearish way..
And I just found this on a 4 hour chart, which if true, could point towards PA taking a sudden drop to bottom of Range or Lower.
As you can see, PA has ranged across and just got rejected off the Upper trendline of a descending channel. The Fib Retracements levels seem to offer support
There is a vertical line on 1st April to give you a marlker to work on as main chart is a daily and this chart is 4 hour.
PA could continue to range horizontalyt till around 3rd March before hitting trend line again.
If PA tries to break out, it will hit it earlier.
In my head, I always have that Still open CME Gap at 77K - 82K
This is a perfect opportunity to buy Bitcoin at a discount if we get down there.
I do have an open SPOT BUY order at 78600 just in case. I would not expect PA to remain down there for very long, so I have placed my order above what I consider to be the possible Low.
None of this may happen BUT I find it prudent to be aware of all possibilities.

Will BTC fill 78k CME gap and reach 75k for the C waveCrypto market has been crazy this cycle
A lot of memes got listed for many milions dollars
But not other coin like Gaming, RwAs
I guess the market is so early for overvalued project just pumped randomly like Dotcom bubble 2008.
The Crypto bubble needs to implode so that quality project, real application, real uses can stay.
Crypto Bubble.

ETH USD 24-02 BUY DIRECTIONDear traders, Here are the important pivot support zones of ETH USD (15m): Candle taking support at the S3 pivot level, it represents short-term intraday buy direction based on previous day movement and market trend.
Risk Reward Ratio 1:1

BITCOIN PA got rejected by the same Fib Circle as Nov 2021 ATH
This may not really Mean anything other than to show how amazing Fib Circles are and how they have a legacy in the past, even if the anchors are in the future.
Let me Explain.
To Draw a Fib circle, on the whole, we place one Anchor on a Low point of PA and then place a 2nd on a high
These Fib Circles have their Anchors in Early 2023
But Look how these Circles cross PA back in 2021.
The Current Circle that PA just went through and then turned down in the 2.618
On the Left side of the chart, see that Fib Circlwe that rejected March 2021 ATH..thats the 3.618 which we will cross again from July 2025
See what happened with the inner circle, the 1.618, on both occasions the PA ran into it.
Just somethin to think about while we wait for BTC PA to Dip down to 77K and bounce back up ;-)

Bitcoin exactly dumping as I predict earlier.Bitcoin is exactly following the dump path as i predict before. Bitcoin might fall to 70,000 support very soon.

PI spot chart 2 $ targetPrice has been consolidating last 2 days testing the trendline multiple times, We can expect price to break the trendline and push upto 2$ level soon and above.

Bitcoin book profit newr 86700 sell given at 95500How to take trades using Harmonic pattern projection Trade setup is explained below :-
Entry : 1st D point : 0% is recent top or bottom.
Trailing SL: 20.2% is work as trailing SL of buy or sell trade if hit then we have to book profit
.If price goes below 20.2% then early or risky traders can reversal trade ,
Targets :
Target T1 : 28.3%
Target T1 : 37.8 %
Target T3 : 48.1%
T3: 60.2% to 66.9 % is our 3rd Target since this is reversal zone so must book profit if break then take fresh trade again
Next Targets are 77.5 % , 88.1 % 100% , 113.5 % , 127.3% , 141.2% and 160.2 , 177.5. final Target 200%
160.2 to 177.5% if profit booking area so book full profit and wait for reversal.
How to take reversal trade :
If price going upside/ downside then then buy or sell levels appear on Chart ( Automatically show when price reach any reversal zone of harmonic projection pattern based .
After showing reversal levels wait for confirmation until 20.2 % or 28.3 % level not break if break then exit from current buy / sell trade and take fresh reverse trade buy/ sell .
Trailing SL:
After reach 1st Target trail SL to just above or below cost ( for example we are holding sell trade from 100 1st Target 110 hit then move trailing sl to 104-105 and move SL as price move upside or Downside)
Re- Entry :
For Re-entry in any pull back Point D ( 10.1% ) is used for re-entry then SL recent high or low Point D ( 0% ) .
Target is same as early 20.2% , 28.3 , 37.8 and so on
Blue Line is 1st support/ Resistance
Green line is 2nd support/ resistance
Red line is 3rd Support/ resistance

Bitcoin Bybit chart analysis February 21Hello
It's a Bitcoinguide.
If you have a "follower"
You can receive comment notifications on real-time travel routes and major sections.
If my analysis is helpful,
Please would like one booster button at the bottom.
Here is the Bitcoin 30-minute chart.
Nasdaq indicators will be released at 12 o'clock shortly.
Nasdaq is moving sideways in the 6+12 pattern
From the Top section to the Good section at the top,
It is the resistance line of the Bollinger Band daily chart.
(Best short entry section)
I created today's strategy with the important conditions above.
* Conditional long position strategy when the red finger moves
1. 98,332.5 dollars long position entry section / cut-off price when the green support line breaks
2. 99,740 dollars Top section long position 1st target -> Good 2nd target
The target price at the top is important.
By 9 am tomorrow morning when an additional daily candle is created
If it reaches the Top-> Good section
After long profit taking, short position switching -> long position is autonomous
I think it would be good to look at the final 1+4 section.
(Currently, 1st section, around 97875.5 dollars)
After finishing today with an upward sideways movement
If it reaches the top section tomorrow,
You can continue to maintain a long position by modifying the stop loss price.
Refer to Great -> Miracle at the top.
This part is a strategy based on the shape of the resistance line on the daily chart.
If it deviates from the current position,
The bottom section becomes the 1+4 section
And then the 2nd section
Please check the shape of the support line on the daily Bollinger Band chart over the weekend.
Please use my analysis so far for reference and use only
Thank you for your hard work this week.
Thank you.

SOL/BTC DUMPING TOWARDS IT'S BREAKOUT TARGETSOL/BTC dumping as expected after breakout of symmetrical triangle. The target from the breakdown is outlined in the chart.
This could be an ideal area to purchase more SOL for your portfolio.

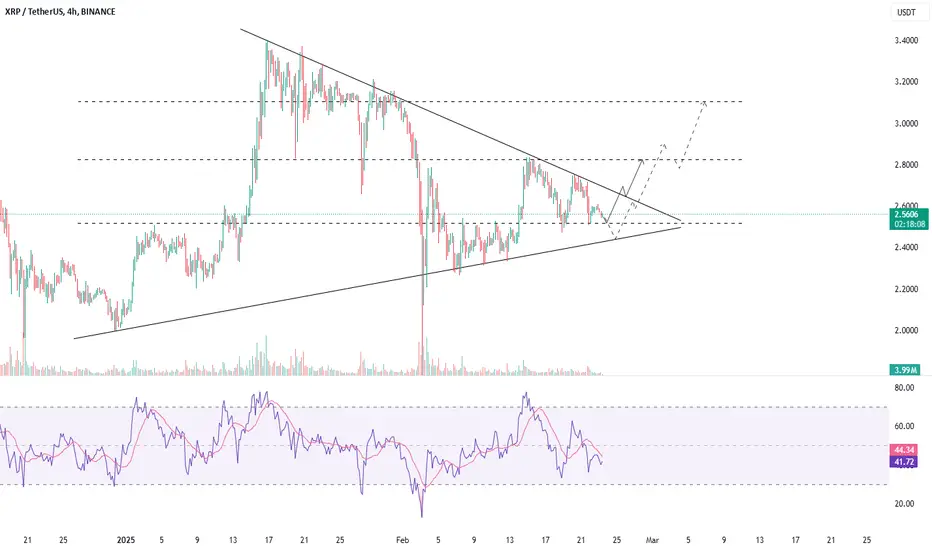
XRPUSDT - FORMING A BULLISH STRUCTURESymbol - XRPUSDT
CMP - 2.5500
XRPUSDT has been exhibiting a range-bound behavior recently, currently trading within a symmetrical triangle formation, indicating potential for a breakout in either direction. This pattern suggests that there is a convergence of support and resistance, and the price could move decisively once it breaks out of this range. Price is also forming a support area, suggesting a strong foundation for a potential upward move, especially if key levels are breached.
While the symmetrical triangle is a typical continuation pattern, the direction of the breakout is still uncertain due to the consolidation phase. Both upward and downward movements are possible depending on how the price interacts with key levels in the near term. I am closely monitoring the price action at these levels, as it could provide the clues necessary to gauge the next potential move.
From a fundamental perspective, the XRP market has seen some buzz surrounding the potential approval of an XRP-based ETF. This rumor has stirred investor sentiment, making the $2.83 level an important threshold. A break and consolidation above this level could trigger a continuation of the upside, especially if positive developments around the ETF rumor materialize. This could act as a major catalyst for a rally, especially if the broader market conditions remain favorable.
Key Support levels: $2.51, $2.00
Key Resistance levels: $2.83, $3.10
If XRP manages to break and hold above $2.83, it could initiate an upward push towards higher resistance levels, potentially igniting a stronger bullish momentum. However, caution should be exercised as the price could first face a retest of support before making any significant movement.
On the other hand, we should also keep an eye on the $2.51 - $2.48 level. A break of this support level could indicate a shift towards a downward trend, sending the price to test lower supports. However, if the price holds above this level, it could form a rebound, giving bulls another chance to push the price higher.
On both the daily and weekly timeframes, the consolidation following the recent rally remains a positive sign, suggesting that the upward momentum could resume once the price breaks out of the symmetrical triangle. As we navigate this phase, both long and short setups are still valid, depending on how the price behaves in relation to these key levels.
In summary, the market is in a phase of consolidation with a potential for upside movement if key resistance levels are cleared, especially with the underlying ETF rumors providing additional bullish sentiment. On the flip side, any breach of support levels could signal a corrective phase.