USDJPY ANALYSIS OVER H1 CHART.USDJPY is reacting well from the demand zone highlighted on my TradingView chart. Price is holding above support and starting to build a base, which keeps the bullish bias intact as long as this level holds.
I’m staying long from 153.500, targeting 154.700 → 156.200 → 157.650, with risk clearly protected below 152.000.
As long as we remain above support, the upside structure remains valid.
Will continue to manage the trade strictly and update as price develops.
Forex market


AUD- USD Analysis on 4Hr TFThe AUDUSD is in Up Trend . The Elliot Wave Impulse pattern I have mentioned may be treated as the retest and completion of Second Impulse Pattern of 2-3 for minimum Fib - 1.68 Level as the Target has been mentioned

EURUSD Looks Weak on Monthly ChartEURUSD Analysis (Monthly Chart)
* The pair is trending within a descending wedge pattern, and prices have failed to breach its upper trendline multiple times in recent months.
* During Jan, the pair breached the wedge, tested the supply order block, then retraced lower.
* The month of Feb also failed to give a close higher till date.
* Hence, prices are now expected to retrace lower below 1.1800, with immediate support at the fib level 0.786 (1.1685)
* Below which, it might continue the downtrend towards the fib level 0.618 (1.1230) with an immediate hurdle near 1.1470.

FOREX "PAIRS IN PLAY" Session 33 15 02 26Scanning multiple forex pairs to filter high-quality trade setups. No trades are forced—only structure-based opportunities.
Note: There may be a delay in this video due to upload processing time.
Disclaimer: FX trading involves high leverage and substantial risk, and losses can exceed your initial investment. This content is for educational purposes only and should not be considered financial advice. Trade at your own risk.

EURUSD BUY Breakout + Retest Entry
➡️ Break & Buy Above: 1.18956
When price decisively breaks above key resistance and holds, this signals bullish continuation.
📌 Stop-Loss: 1.1372
📌 Targets:
• TP1: 1.20888
• TP2: 1.21500
Why this works: Breakouts that retest previous resistance as support can unleash strong up moves.

NZD/JPY – Buy Entry Points📈 NZD/JPY – Buy Entry Points (Structured Plan)
Since you prefer clear trading levels, here is a clean buy setup plan.
🟢 1️⃣ Aggressive Buy (Trend Continuation)
Condition: Price holding above short-term support
Entry: 92.534 (on small pullback)
Stop Loss: 91.937
Target 1: 93.70
Target 2: 94.20
Target 3: 94.90

AUDJPY – Bullish Reversal From Trendline SupportAUDJPY is reacting strongly from a major ascending trendline support on the 1H timeframe. Price swept liquidity below the structure, tapped into the demand zone, and immediately rejected — signaling buyer strength.
we entered long around 108.180, which aligns perfectly with the technicals.
📈 Why This Is a Bullish Setup
Price tapped the HTF trendline and respected it
Multiple liquidity sweeps beneath the zone, trapping sellers
Formation of a bullish rejection wick right at support
Price is still inside a discount area, ideal for longs
Recent bearish attempts failde to close below the trendline
Strong probability of a bullish push toward 109.20 – 109.50 liquidity zones
This is a classic trendline + demand + liquidity sweep confluence setup.
📋 Trade Parameters
Entry: 108.180 (executed)
Stop-Loss: ~55 pips (below liquidity sweep + structure low)
Take-Profit: ~110 pips (towards upper liquidity & imbalance zones)
Risk-to-Reward: ~1:2


USDJPY MULTI TIMEFRAME ANALYSIS Hi traders, this is the complete multi-time frame analysis for this pair. Please feel free to ask any questions in the comment section below. The entry will only be made if all strategy rules are met.

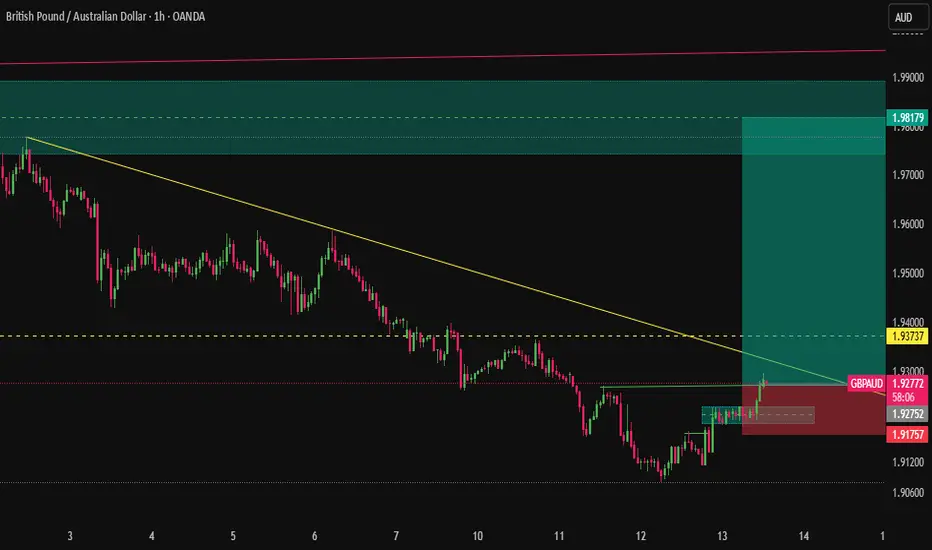
The "High R:R" Power PlayThe tides are turning for GBPAUD. After a prolonged bearish slide, we are witnessing a textbook structural shift on the 1H timeframe.
EURUSD AnalysisThe prices have breached the head & shoulder pattern on the down side.
The pair also resting below the 9 EMA
Prices are expected to test the bullish FVG between 1.1845 & 1.1835, confluence with fib level 0.236

GBPUSD Analysis
The prices have breached the head & shoulder pattern on the down side.
The pair is also resting below the 9 EMA
Prices are expected to test the bullish FVG near 1.3552 (fib level 1.272) with immediate hurdle at fib level 1.0 (1.3585)

NZDUSD MULTI TIMEFRAME ANALYSIS Hi traders, this is the complete multi-time frame analysis for this pair. Please feel free to ask any questions in the comment section below. The entry will only be made if all strategy rules are met.

Multipolar World & Geopolitical Risk Premiums1. What Is a Multipolar World?
A multipolar world refers to an international system in which power is distributed among several major states rather than concentrated in one (unipolar) or two (bipolar) dominant powers. In the 19th century, Europe functioned as a multipolar system with empires such as the United Kingdom, France, Austria-Hungary, Russia, and Prussia balancing one another.
After World War II, the world shifted into a bipolar structure dominated by the United States and the Soviet Union. Following the Soviet collapse in 1991, the U.S. emerged as the sole superpower in what many analysts described as a unipolar moment.
Today, however, global politics increasingly resembles multipolarity. Major actors shaping global outcomes include:
United States
China
Russia
European Union
India
These actors compete and cooperate across domains such as trade, technology, energy, military alliances, and financial systems.
2. Characteristics of a Multipolar System
A multipolar world has several defining features:
A. Diffusion of Power
Military, economic, technological, and financial power are more evenly spread. No single country can unilaterally dictate global rules.
B. Flexible Alliances
Unlike rigid Cold War blocs, alliances are fluid. For example, India maintains strategic ties with the United States while continuing defense and energy cooperation with Russia.
C. Regional Power Centers
Regional actors assert influence:
Turkey in the Middle East
Brazil in Latin America
Saudi Arabia in energy markets
D. Institutional Fragmentation
Global institutions such as the United Nations and the World Trade Organization face gridlock as great-power rivalry intensifies.
3. Geopolitical Risk: Concept and Evolution
Geopolitical risk (GPR) refers to the risk that political tensions, conflicts, wars, sanctions, or policy uncertainty will disrupt economic stability and financial markets.
Examples include:
The Russia-Ukraine War
Rising tensions between China and Taiwan
Sanctions imposed by the United States on Iran
In a multipolar system, geopolitical risks tend to increase because:
Power transitions create instability.
Strategic mistrust grows among major powers.
Economic interdependence becomes weaponized (e.g., trade restrictions, export controls).
4. What Is a Geopolitical Risk Premium?
A geopolitical risk premium is the additional compensation investors demand for holding assets exposed to geopolitical uncertainty.
It appears in various markets:
Oil prices rise when conflict threatens supply.
Government bond yields increase for politically unstable countries.
Equity markets decline amid war fears.
Currencies depreciate in high-risk environments.
For example, during the Russia-Ukraine War, global oil prices surged because markets priced in supply disruption risks.
In essence:
Geopolitical Risk Premium = Extra expected return required due to political uncertainty.
5. How Multipolarity Increases Risk Premiums
Multipolarity amplifies geopolitical risk premiums through several channels:
A. Strategic Competition
The rivalry between the United States and China spans semiconductors, artificial intelligence, rare earth minerals, and trade routes. Export controls and technology bans create uncertainty for global firms.
Investors therefore demand higher returns for exposure to supply chains dependent on either power.
B. Sanctions & Economic Weaponization
Financial sanctions have become common tools. When the United States and its allies restricted Russian banks’ access to SWIFT, it signaled that access to the global financial system is not politically neutral.
Countries now diversify reserves away from the U.S. dollar, increasing fragmentation and uncertainty.
C. Energy & Commodity Volatility
In multipolar competition, energy security becomes strategic. Actions by OPEC and geopolitical tensions in the Middle East directly affect global inflation.
Energy-importing countries face risk premiums in currency and bond markets when oil prices spike.
D. Supply Chain Reconfiguration
“Friend-shoring” and “near-shoring” reduce efficiency but improve resilience. However, restructuring supply chains increases short-term costs and uncertainty, contributing to equity risk premiums.
6. Historical Comparisons
During 19th-century European multipolarity, shifting alliances and arms races eventually contributed to World War I. While today’s world differs due to nuclear deterrence and economic interdependence, instability risks remain.
The Cold War bipolar system was tense but predictable. The current multipolar system is arguably less predictable because:
There are more actors.
Strategic alignments shift.
Middle powers exercise autonomy.
7. Financial Market Transmission Channels
Geopolitical risk premiums transmit through several mechanisms:
1. Equity Markets
Stock prices decline during crises due to uncertainty and earnings risk.
2. Fixed Income Markets
Emerging market bonds widen in spread when political risk rises.
3. Commodity Markets
War risk increases prices of oil, gas, wheat, and metals.
4. Currency Markets
Safe-haven currencies (USD, CHF, JPY) appreciate.
8. The Role of Emerging Powers
Emerging powers such as India and Brazil are not passive players. They practice “strategic autonomy,” balancing between great powers to maximize national interest.
This fluid positioning makes geopolitical forecasting more complex and increases uncertainty premiums.
9. Implications for Policymakers
Governments respond to multipolar risk by:
Increasing defense spending
Diversifying energy sources
Building regional trade blocs
Accumulating foreign reserves
Central banks must also account for geopolitical shocks when setting interest rates, as conflicts often trigger inflation via commodity prices.
10. Implications for Investors
Investors adapt by:
Diversifying geographically
Holding commodities and gold as hedges
Reducing exposure to politically fragile regions
Monitoring sanction regimes and trade policy
Risk modeling increasingly incorporates geopolitical indicators alongside macroeconomic variables.
11. Is Multipolarity More Dangerous?
Scholars debate whether multipolar systems are inherently more unstable. Some argue they create balancing mechanisms that prevent dominance. Others argue they increase miscalculation risk.
What is clear is that:
Economic interdependence no longer guarantees peace.
Political fragmentation raises structural uncertainty.
Markets now price geopolitical tension as a persistent feature, not a temporary shock.
Conclusion
The transition toward a multipolar world marks one of the most significant structural shifts in international relations since the Cold War. Power is diffusing across multiple centers, alliances are flexible, and economic tools are increasingly weaponized.
As a result, geopolitical risk premiums are becoming structurally embedded in global markets. Investors demand higher returns to compensate for political uncertainty. Governments must adapt to a world where stability cannot be assumed, and economic globalization is no longer frictionless.
In short:
Multipolarity increases complexity.
Complexity increases uncertainty.
Uncertainty increases risk premiums.
The coming decades will likely be defined not by a single hegemon but by competitive coexistence among major powers—where economics, finance, and geopolitics are deeply intertwined.

USDJPY MULTI TIMEFRAME ANALYSIS Hi traders, this is the complete multi-time frame analysis for this pair. Please feel free to ask any questions in the comment section below. The entry will only be made if all strategy rules are met.

FOREX "PAIRS IN PLAY" Session 32 13 02 26Scanning multiple forex pairs to filter high-quality trade setups. No trades are forced—only structure-based opportunities.
Note: There may be a delay in this video due to upload processing time.
Disclaimer: FX trading involves high leverage and substantial risk, and losses can exceed your initial investment. This content is for educational purposes only and should not be considered financial advice. Trade at your own risk.

NZDUSD MULTI TIMEFRAME ANALYSIS Hi traders, this is the complete multi-time frame analysis for this pair. Please feel free to ask any questions in the comment section below. The entry will only be made if all strategy rules are met.

EURCHF MULTI TIMEFRAME ANALYSIS Hi traders, this is the complete multi-time frame analysis for this pair. Please feel free to ask any questions in the comment section below. The entry will only be made if all strategy rules are met.

BUY AUDJPY• Trend direction :-After breaking the trend line and retesting the support zone again, I will buy
• Buy zone:-------- 108.976
• Stop loss--------- 108.428
• Target levels---- 111.008
• Risk management plan 📊

BUY GBPJPYIn my opinion, I am looking for buying in areas of strong demand.
Trading Bias & Strategy Ideas
🟢 Bullish Setups (Buy/Dips)
Buy around 208.50
stop below 207.088
Targets: 214.088

USDJPY MULTI TIMEFRAME ANALYSIS Hi traders, this is the complete multi-time frame analysis for this pair. Please feel free to ask any questions in the comment section below. The entry will only be made if all strategy rules are met.

GBPUSD MULTI TIMEFRAME ANALYSIS Hi traders, this is the complete multi-time frame analysis for this pair. Please feel free to ask any questions in the comment section below. The entry will only be made if all strategy rules are met.
