USD/JPY continues strong sellContinue looking for sell signals on time M15+H1
The sell trend on time D1 shows that the big downtrend is quite clear.
Forex market

EUR/JPY Big trend sell Continue looking for sell signals on time M15+H1
The sell trend on time D1 shows that the big downtrend is quite clear.

EURUSD MULTI TIME FRAME ANALYSISHello traders , here is the full multi time frame analysis for this pair, let me know in the comment section below if you have any questions , the entry will be taken only if all rules of the strategies will be satisfied. wait for more price action to develop before taking any position. I suggest you keep this pair on your watchlist and see if the rules of your strategy are satisfied.
🧠💡 Share your unique analysis, thoughts, and ideas in the comments section below. I'm excited to hear your perspective on this pair .
💭🔍 Don't hesitate to comment if you have any questions or queries regarding this analysis.

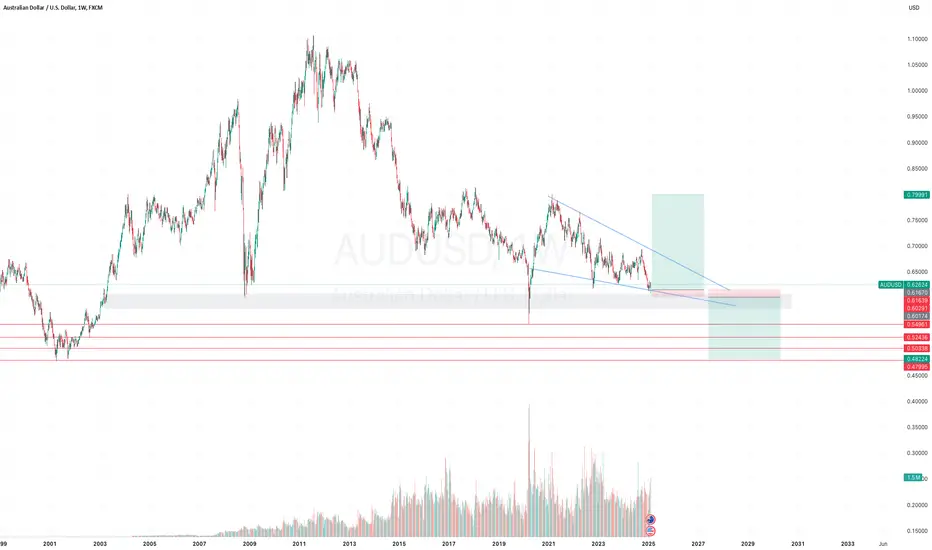
AUDUSD MULTI TIME FRAME ANALYSISHello traders , here is the full multi time frame analysis for this pair, let me know in the comment section below if you have any questions , the entry will be taken only if all rules of the strategies will be satisfied. wait for more price action to develop before taking any position. I suggest you keep this pair on your watchlist and see if the rules of your strategy are satisfied.
🧠💡 Share your unique analysis, thoughts, and ideas in the comments section below. I'm excited to hear your perspective on this pair .
💭🔍 Don't hesitate to comment if you have any questions or queries regarding this analysis.

AUDUSD can move both side.AUDUSD current level should act as a support zone 0.62-0.58. If it breaks there will be massive downfall as per the pattern overview. 0.52 and 0.47 will be next stop. On contradiction there is also bullish wedge pattern forming which could also kill the sellers. One can easily try the big long with 2% SL & target above 10% 20%. If SL hit just reverse the position for bottom level liquidity targets. 0.54 0.52 0.47
EURUSD looking super bearish long termEURUSD somehow not able to sustain at the higher levels falling from the bearish wedge pattern. Creating multiple tops and not looking confident at higher level. RSI is also suggesting more selloff pending from the current levels. Uptrend will only positive if it sustains above 1.06300. Otherwise i can see it is ready to hunt the liquidity levels of 0.974 0.964 0.953

EUR/USD Daily Chart Analysis – Smart Money Perspective
Current Market Bias: Bearish
The price action indicates that the overall structure remains bearish, with lower highs and lower lows being formed. Despite recent bullish retracements, the price has failed to break key resistance levels, signaling that sellers remain in control.
Key Areas on the Chart:
1. Order Block (OB) & Fair Value Gap (FVG) Zone:
• The highlighted gray zone represents an order block (OB), which is a supply area where institutions likely placed large sell orders.
• The presence of a fair value gap (FVG) within this zone indicates an inefficiency in price, making it a strong area for potential reversals.
• Price recently tapped into this area and reacted downward, confirming bearish momentum.
2. Liquidity Grab Possibility:
• The lower dashed line represents a previous swing low, where liquidity (stop-loss orders) is likely resting.
• Smart Money often seeks liquidity before reversing or continuing trends.
• There is a high probability that price will sweep this low before any potential bullish move occurs.
3. Market Structure Shift for a Bullish Setup:
• Although the bias remains bearish, a market structure shift (MSS) is required before considering any long (buy) setups.
• A key level to watch is 1.05351, where a break above could signal a reversal.
• Until then, selling pressure is likely to dominate.
Conclusion & Trade Plan:
• Bearish bias remains active.
• Price might sweep the previous low to grab liquidity before a potential reversal.
• A confirmed market structure shift above 1.05351 is required for bullish confirmation.
• Until that happens, traders should focus on shorting opportunities near supply zones or order blocks.
Final Thought:
By following Smart Money Concepts (SMC), traders can align their trades with institutional movements. Patience is key—wait for confirmations before entering positions. Keep an eye on liquidity sweeps and market structure shifts for the best trade setups.

EUR/USD wobbles ahead of US NFP reportEUR/USD is currently stable around the 1.0400 level, but the outlook for the Euro (EUR) remains uncertain due to concerns that the Eurozone may face losses from higher tariffs imposed by U.S. President Donald Trump. Last weekend, President Trump warned that Europe would certainly face tariffs for not buying enough U.S. goods, although he did not provide many details.
From a technical perspective, the EUR/USD pair could face downward pressure in the short term. The support level at 1.0228 is preventing the pair from dropping further, while the resistance at 1.0418 is the main reason for the temporary decline.
To manage risk, you may set a **Stop Loss (SL)** at 1.0450, just above the resistance level to protect against further upward movement. **Take Profit (TP)** can be set at the support level of 1.0228, where the pair may find stability and potentially recover. However, these levels can be adjusted based on your strategy and trading time frame.

USDJPY MULTI TIME FRAME ANALYSISHello traders , here is the full multi time frame analysis for this pair, let me know in the comment section below if you have any questions , the entry will be taken only if all rules of the strategies will be satisfied. wait for more price action to develop before taking any position. I suggest you keep this pair on your watchlist and see if the rules of your strategy are satisfied.
🧠💡 Share your unique analysis, thoughts, and ideas in the comments section below. I'm excited to hear your perspective on this pair .
💭🔍 Don't hesitate to comment if you have any questions or queries regarding this analysis.

How to draw support and resistance?Drawing **support and resistance** levels is a key aspect of technical analysis. These levels represent areas where the price tends to reverse or stall, providing key insights into market behavior. Here's how to draw them in brief:
### 1. **Support**
- **Definition**: A price level where a downtrend is expected to pause or reverse as demand increases. It's the floor of the price action.
- **How to Draw**:
- Look for areas where the price has bounced higher multiple times in the past. These are points where buyers have stepped in.
- Draw a horizontal line at the lowest price points in these areas.
- Strong support is confirmed when the price touches the same level multiple times without breaking it.
### 2. **Resistance**
- **Definition**: A price level where an uptrend is expected to pause or reverse as selling pressure increases. It's the ceiling of the price action.
- **How to Draw**:
- Identify areas where the price has consistently faced downward pressure or reversed. This is where sellers have entered the market.
- Draw a horizontal line at the highest price points in these areas.
- Strong resistance is confirmed when the price fails to break above it multiple times.
### 3. **Key Points to Remember**
- **Multiple Touches**: The more times the price touches a level without breaking through, the stronger the support or resistance.
- **Broken Levels**: Once a support level is broken, it often becomes resistance (and vice versa).
- **Use Trendlines**: In addition to horizontal levels, you can also draw diagonal trendlines to connect higher lows (support) or lower highs (resistance) in trending markets.
These levels help traders anticipate potential price reversals or continuations, making them essential for developing trading strategies.

a bearish order block failed to hold the price in it. Here’s an analysis of the situation:
Bearish Order Block Defined:
The bearish order block is the last bullish candle before a significant downward movement, often acting as a supply zone where sellers are expected to be strong.
Reasons for the Wick Break:
Liquidity Grab (Stop Hunt): The wick could represent a liquidity grab, where price briefly breaks above the bearish order block to trigger stop-loss orders placed by sellers or to entice breakout buyers before reversing.
Market Imbalance: There could have been a need to fill orders at higher levels due to prior inefficiencies or imbalance in the market.
Strong Bullish Momentum: If buyers were dominant, the bearish order block might have failed to hold the price, albeit temporarily.
News or Economic Events: Unexpected news or data releases could cause a spike in volatility, leading to such wick formations.
Outcome of the Wick:
Following the wick, it seems the price returned below the bearish order block, indicating that it was likely a false breakout or liquidity grab, and the bearish order block remained relevant.
I also love to here more solutions from you. Feel free to comment...

USDCHF MULTI TIME FRAME ANALYSISHello traders , here is the full multi time frame analysis for this pair, let me know in the comment section below if you have any questions , the entry will be taken only if all rules of the strategies will be satisfied. wait for more price action to develop before taking any position. I suggest you keep this pair on your watchlist and see if the rules of your strategy are satisfied.
🧠💡 Share your unique analysis, thoughts, and ideas in the comments section below. I'm excited to hear your perspective on this pair .
💭🔍 Don't hesitate to comment if you have any questions or queries regarding this analysis.


GBPNZD trade idea i'm looking for bearish move GBPNZD trade idea i'm looking for bearish move because previous daily candle closed in bearish and i need a 4h candlestick close in bearish engulfing so i go for short

stop loss in nzdjpy because my sl isn't above the previous high I took atrade in this pair and i got wicked out as you can see in this chart , my trend and pattern is clear in down side but my small stop loss is not good for my trade

Eurusd Will Push Downwards For sureThe EUR/USD currency pair presents a strong opportunity for traders, with a high probability of downward movement. The market conditions, technical indicators, and fundamental factors suggest a bearish trend. A combination of resistance levels, economic data, and institutional sell-offs indicate that the euro may weaken against the dollar.
If traders position themselves correctly, they can generate significant profits from this move. Short-selling or using options strategies can maximize gains. Additionally, global economic trends, such as inflation concerns, interest rate differentials, and central bank policies, support this bearish outlook.
For those willing to take calculated risks, this is an opportunity to capitalize on market movements. Proper risk management, stop-loss strategies, and a clear entry-exit plan can ensure profitability while minimizing losses. If executed well, this trade could yield substantial returns.

GBPUSD BUY It's a buy for me as it is forming higher highs and higher lows. In case if candle closes above 1.2544 then it retest the same support of 1.2544 and it goes higher.
In case if it closes below 1.2480 then it retests the 1.2480 resistance on lower timeframe and then it continues to go down.
As we have two important news today on GBP and USD both, we may expect a spike either upward or downward.

GBPJPY intra outlookGBPJPY today also in sell pressure ....
189.87 will be TGT ...
191.06 is resistance. If raise above 191.06 trend will be reversal.

EURAUDThe EURAUD has shown a strong bearish pattern on the 4 hour chart. There is a small trading range indicating an exhausted market, with the resistance being broken.

EURUSD NEXT POSSIBLE MOVE SAXO:EURUSD
s of February 6, 2025, the EUR/USD pair is trading near the 1.0385 resistance level, with recent movements suggesting a potential continuation of the bullish
**Technical Overview:**
- **Current Price:** pproximately 1.0385- **Resistance Levels:** .0385, 1.0455- **Support Levels:** .0325, 1.0200
**Technical Indicators:**
- **Trend:** he pair is attempting to breach the key resistance at 1.0385, indicating a possible continuation of the bullish trend.- **Moving Averages:** rading above the 50-day EMA supports the positive outlook.
**Trade Recommendation:**
onsidering the current technical indicators, initiating a **buy** position could be favorable if the price successfully breaks above the 1.0385 resistance level.
- **Entry Point:** uy at 1.0400- **Take Profit (TP):** .0455- **Stop Loss (SL):** .0350
**Risk Management:**
his trade setup offers a 1.1:1 reward-to-risk ratio.nsure that your position size aligns with your risk tolerance and overall trading strategy.iven the current market conditions, it's crucial to employ strict risk management practices.
**Conclusion:**
he EUR/USD pair is testing key resistance levels, and a successful breach could signal a continuation of the bullish trend.raders should monitor price action closely and manage risk appropriately.
*Disclaimer: Trading forex carries a high level of risk and may not be suitable for all investors. Ensure you fully understand the risks involved and seek independent advice if necessary.*

USD/JPY strong sell The strengthening of JPY has led to the decline of currency pairs accompanying JPY.
We will follow the high time frame to continue looking for sell orders at time M15+H1

EUR/JPY big trend sellJPY index is strengthening significantly over time D1. Along with that, the xxx/jpy currency pairs all decreased sharply.
We can easily see that EUR/JPY, after a long period of sideways price, has begun to gradually decrease and shows signs of a strong decrease in the near future. Continue to sell at smaller times and look for signals at time M15+H1.

NZDCAD Resistance Ahead!
HI,Traders !
NZDCAD is making a local
Rebound but a horizontal
Resistance is ahead at 0.81417
So after the retest we will be
Expecting a local bearish pullback
And a move down !
Comment and subscribe to help us grow !
