Hindustan Copper – Breakout, Retest & Bullish Continuation SetupNSE:HINDCOPPER
Hindustan Copper has delivered a powerful breakout followed by healthy consolidation near highs — indicating strength rather than exhaustion.
Technical Observations
Breakout zone: ₹570–₹590 area (now acting as support)
Current structure: Flag-type consolidation near highs
Volume:

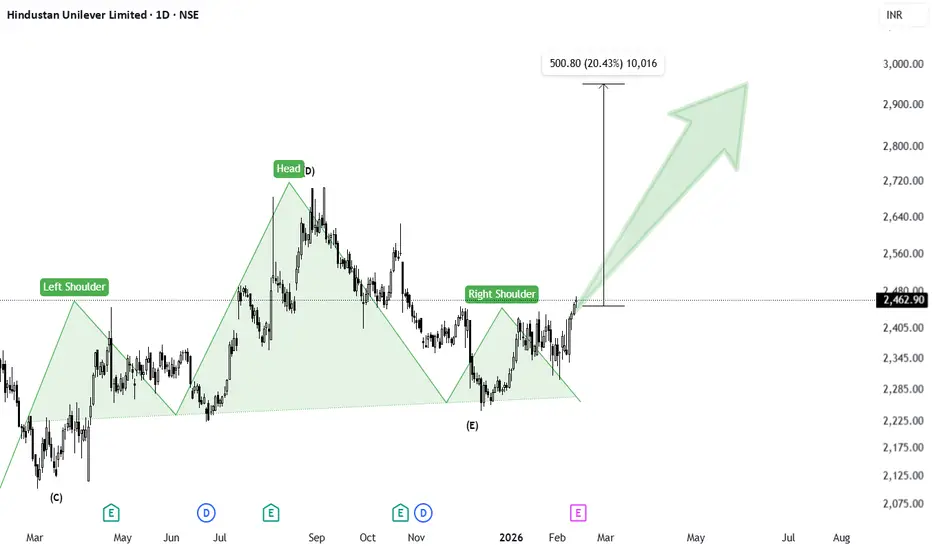
Hindustan Unilever : Prepared for Upside Hindustan Unilever – Failed Head & Shoulders Turning Bullish (Daily Chart)
On the daily timeframe, Hindustan Unilever was forming a well-structured Head & Shoulders pattern. The left shoulder, head, and right shoulder were clearly visible, with a defined neckline acting as support.
However, instea
Positional View for Infyosys Ltd.Wrap up:-
As per chart of Infosys Ltd., it seems that correction in the stock is now over with a abc pattern in major wave 4. Now, major wave 5 is started of which inner wave 1 is completed at 1649 and wave 2 is expected to be completed in the range 1433-1307.
What I’m Watching for 🔍
Low Risk

BIOCON: Compression Before ExpansionBIOCON is trading inside a rising broad channel while currently forming a short-term falling channel.
Price is now near the lower support of the larger ascending structure. If it breaks above the falling channel resistance, we may see momentum toward the upper trendline zone.
But if it loses the r

Breakout from Rounding Base after Long Consolidation in VoltasNSE:VOLTAS
📈Pattern & Setup:
Voltas has formed a large rounding base over many months after staying under pressure from the prior decline. Price has now pushed into the major horizontal resistance zone near 1,520–1,540, where supply had repeatedly emerged earlier.
Today’s move shows a decisive

Bajaj finance: is retest done or pending?As per chart reading we can see that BAJFIN completed the retest in the market volatility of the last few weeks, be it in budget or US-INDIA trade deal.
it is gearing up for new rally.
have a 10% SL and it can give return more than 50%.
first tareget should be 25% then 38% and last target should be

SMS Pharma - Cup & Handle PossibilitySMS Pharma :
Cup and Handle Breakout Possibility
Looks good above 363, Breaking and sustaining above 378 leads to 400 and more

Bigger Stoploss wont save you in the markets ? ( Proof ) I have used older than 3 months chart to explain a concept / bias here - keeping bigger stoploss will save your trade ? No , that is a big lie, watch the video to understand .

AUROPHARMA: Supply Exhaustion & The Golden Retracement📝 The Technical Breakdown (Educational Guide)
This chart is a masterclass in understanding Volume Price Analysis + Fibonacci Confluence. Let’s decode the setup through 4 key educational pillars:
1️⃣ Supply Exhaustion Zone 🔴
Observe the pink box marked as “Exhausted Supply Zone.”
Price has tested

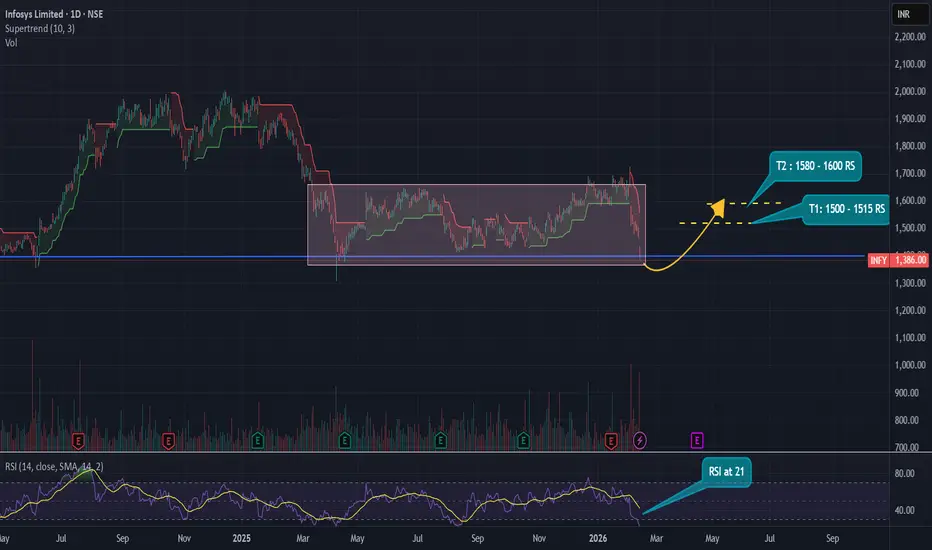
Infosys LimitedInfosys Technical Outlook :
Infosys has been consolidating within the ₹1400–₹1700 range over the past year. Currently, the stock is in the oversold zone, with the RSI at 21, and is testing a strong support level around ₹1400.
From a mid-term perspective, the setup looks attractive:
- Target 1: ₹1500
See all popular ideas
SymbolPrice & chgMarket cap
SymbolMarket cap / Price
SymbolPrice & chgEmployees
SymbolEmployees / Price
Stock collections
Today
SB1NOSPAREBANK 1 SOR-NORGE ASA
Actual
0.41
USD
Estimate
0.41
USD
Today
035720Kakao Corp.
Actual
0.06
USD
Estimate
0.17
USD
Today
5105Toyo Tire Corporation
Actual
0.44
USD
Estimate
0.68
USD
Today
2270MEGMILK SNOW BRAND Co., Ltd.
Actual
1.11
USD
Estimate
0.54
USD
Today
COINCoinbase Global, Inc. - 3
Actual
−2.49
USD
Estimate
1.00
USD
Today
6460Sega Sammy Holdings Inc.
Actual
−0.59
USD
Estimate
0.24
USD
Today
8795T&D Holdings, Inc.
Actual
0.58
USD
Estimate
0.58
USD
Today
3197Skylark Holdings Co., Ltd.
Actual
0.09
USD
Estimate
0.10
USD
See more events