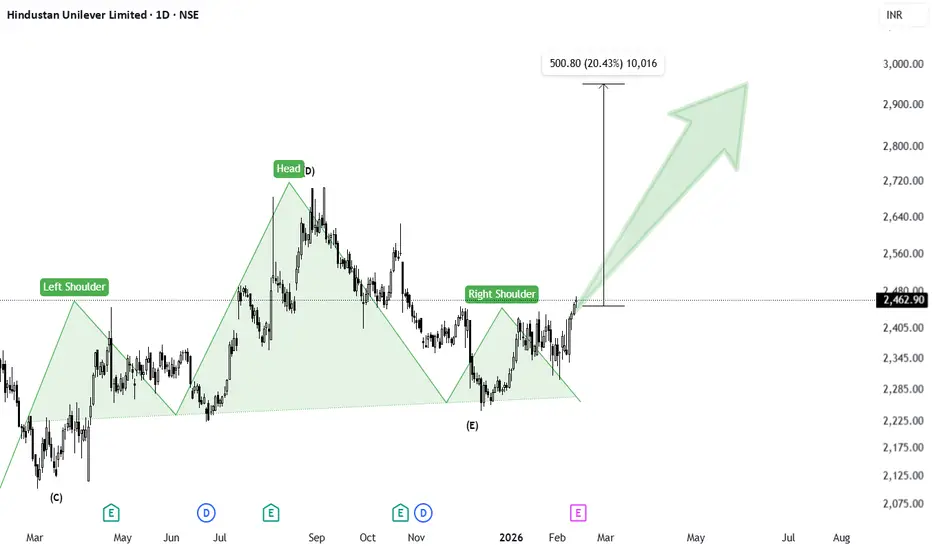
Hindustan Unilever : Prepared for Upside Hindustan Unilever – Failed Head & Shoulders Turning Bullish (Daily Chart)
On the daily timeframe, Hindustan Unilever was forming a well-structured Head & Shoulders pattern. The left shoulder, head, and right shoulder were clearly visible, with a defined neckline acting as support.
However, instead of breaking below the neckline, price action failed to confirm the bearish reversal. The right shoulder did not lead to downside continuation. Instead, price reversed strongly and has now given a decisive breakout above the right shoulder high, closing above that level.
This failure of a bearish Head & Shoulders pattern indicates a potential bullish reversal. Failed patterns often lead to strong moves in the opposite direction, as trapped short sellers exit their positions.
Target Measurement:
The projected upside target is calculated by measuring the vertical distance from the Head (highest point) down to the neckline low. This distance is then projected upward from the breakout point above the right shoulder.
Price has already given a confirmed daily close above the right shoulder resistance, validating the breakout.
As long as price sustains above the breakout level, the measured move target remains active.
Positional View for Infyosys Ltd.Wrap up:-
As per chart of Infosys Ltd., it seems that correction in the stock is now over with a abc pattern in major wave 4. Now, major wave 5 is started of which inner wave 1 is completed at 1649 and wave 2 is expected to be completed in the range 1433-1307.
What I’m Watching for 🔍
Low Risk Entry Range is 1433-1307 for a Probable target of 1897-2053 with a stoploss of 1307.
Disclaimer: Sharing my personal view — only for educational purpose not financial advice.
"Don't predict the market. Decode them."

Hindustan Copper – Breakout, Retest & Bullish Continuation SetupNSE:HINDCOPPER
Hindustan Copper has delivered a powerful breakout followed by healthy consolidation near highs — indicating strength rather than exhaustion.
Technical Observations
Breakout zone: ₹570–₹590 area (now acting as support)
Current structure: Flag-type consolidation near highs
Volume: Expansion during breakout, contraction during pullback (healthy)
EMA alignment: 21 EMA > 50 EMA (bullish structure intact)
Momentum is cooling slightly but price is not breaking down — this indicates accumulation.
Bullish Continuation:
If price sustains above ₹590–₹600 zone → Possible move towards ₹650–₹680 and beyond.
Invalidation:
Daily close below ₹560 weakens structure.

BIOCON: Compression Before ExpansionBIOCON is trading inside a rising broad channel while currently forming a short-term falling channel.
Price is now near the lower support of the larger ascending structure. If it breaks above the falling channel resistance, we may see momentum toward the upper trendline zone.
But if it loses the rising support, the structure weakens.
This is a decision zone — watch for breakout confirmation, not prediction.
Clean structure. Clear levels. Let price speak. 🚀

Breakout from Rounding Base after Long Consolidation in VoltasNSE:VOLTAS
📈Pattern & Setup:
Voltas has formed a large rounding base over many months after staying under pressure from the prior decline. Price has now pushed into the major horizontal resistance zone near 1,520–1,540, where supply had repeatedly emerged earlier.
Today’s move shows a decisive breakout attempt backed by momentum, suggesting demand is finally overpowering sellers. Such long consolidation breakouts often lead to fast expansion legs.
📝 Trade Plan:
Entry: Fresh entry can be considered above 1,540–1,550 on sustained strength.
🚩Stop-Loss: 1,470 (below breakout base).
🎯Targets:
Target 1 → 1,700 (intermediate resistance).
Target 2 → 1,930–1,950 (measured move projection, ~25% upside).
💡Pyramiding Strategy:
1. Enter first lot above 1,550.
2. Add on continuation above 1,620, trail SL to 1,520.
3. Add final lot above 1,700, trail SL to 1,600.
Hold the position as long as price sustains above the breakout zone.
🧠Logic Behind Selecting this Trade:
Rounding bases indicate gradual accumulation. When price finally clears the neckline after months of compression, it usually attracts momentum traders and forces short covering. Acceptance above 1,550 can open the path toward the 1,900 zone.
Keep Learning. Keep Earning.
Let’s grow together 📚🎯
🔴Disclaimer:
This is not an investment advice. Always do your own due diligence before making any trading or investment decision.

SMS Pharma - Cup & Handle PossibilitySMS Pharma :
Cup and Handle Breakout Possibility
Looks good above 363, Breaking and sustaining above 378 leads to 400 and more

IOC – 7+ Years Mega Breakout in the MakingIOC is not setting up for a routine breakout. The stock is attempting to emerge from a massive 7–8 year consolidation phase, making this a potential multi-year structural breakout rather than a short-term move.
Since 2017, IOC has repeatedly faced selling pressure near the 180–190 resistance zone, keeping the stock range-bound for years. Now, price is back at this critical level — but this time with strong trend structure and visible volume expansion, suggesting a clear shift in market behavior.
The overall price action shows a transition from range mode to trend mode. Higher highs and higher lows are already in place, and pullbacks are becoming shallow — a classic sign of institutional accumulation. Price is also trading comfortably above its key moving averages, reinforcing the long-term bullish bias.
Momentum indicators support the setup as well. The Vortex Indicator shows clear buyer dominance, indicating that sellers are gradually losing control. Currently, the stock is consolidating in a tight 177–182 zone, which looks more like energy build-up than exhaustion.
A sustained move above the 185–190 zone, especially on a monthly closing basis, could confirm a major structural breakout and open the door for a strong trend continuation.
Key Levels to Watch
🚀 Breakout Zone: 185 – 192 (Sustaining above this is crucial)
🛡️ Immediate Support: 165
🛡️ Structural Support: 153
Final Take
IOC is standing at the edge of a long-term trend shift. Multi-year bases take time to resolve, but once the breakout is confirmed, the resulting move is often powerful and decisive. This setup is more about confirmation and patience than prediction.
Big bases don’t deliver fast moves — they deliver big moves.
— Ayushi Shrivastava
Independent Market Research | Technical & Structural Analysis
This research is my own work, supported by AI tools for data structuring and visualization.
Disclaimer: This analysis is for educational purposes only. Not investment advice.

Derivatives and Options TradingWhat Are Derivatives?
A derivative is a financial contract whose value is derived from an underlying asset. The underlying asset can be:
Stocks
Bonds
Commodities (gold, oil, wheat)
Currencies
Interest rates
Market indexes (like the S&P 500 or Nifty 50)
In simple terms, a derivative does not have independent value; its price depends on the value of something else.
Common Types of Derivatives
Futures Contracts
Options Contracts
Forwards Contracts
Swaps
Among these, futures and options are the most actively traded on exchanges.
Purpose of Derivatives
Derivatives serve three main purposes:
1. Hedging (Risk Management)
Hedging is used to reduce or eliminate financial risk. For example, a farmer expecting to harvest wheat in three months may use a futures contract to lock in a selling price today. This protects against the risk of falling prices.
Similarly, investors use options to protect stock portfolios from market downturns.
2. Speculation
Speculators use derivatives to profit from price movements. Because derivatives often require a smaller initial investment (called margin or premium), they provide leverage, allowing traders to control large positions with less capital.
However, leverage increases both potential profits and potential losses.
3. Arbitrage
Arbitrage involves exploiting price differences between markets. Traders buy an asset in one market and sell it in another where the price is higher, locking in a risk-free profit.
Understanding Options
An option is a type of derivative contract that gives the buyer the right, but not the obligation, to buy or sell an underlying asset at a specific price on or before a specific date.
There are two main types of options:
Call Option
Put Option
Call Option
A call option gives the buyer the right to buy an asset at a fixed price (called the strike price) before expiration.
Example:
Stock price: $100
Call option strike price: $105
Expiration: 1 month
If the stock rises to $120, the call option becomes valuable because the buyer can purchase at $105 and potentially sell at $120.
If the stock stays below $105, the option may expire worthless.
Put Option
A put option gives the buyer the right to sell an asset at a fixed price before expiration.
Example:
Stock price: $100
Put strike price: $95
If the stock falls to $70, the put increases in value because the holder can sell at $95 instead of the market price of $70.
If the stock stays above $95, the option may expire worthless.
Key Components of an Option
1. Strike Price
The predetermined price at which the asset can be bought or sold.
2. Expiration Date
The date on which the option contract expires.
3. Premium
The price paid to buy the option. This is the maximum loss for the buyer.
4. Intrinsic Value
The real value if exercised immediately.
5. Time Value
The extra value based on time remaining before expiration.
Option Buyers vs Option Sellers
Option Buyer (Holder)
Pays the premium
Has limited risk (loss = premium paid)
Has unlimited profit potential (for calls)
Option Seller (Writer)
Receives the premium
Has limited profit (premium received)
May face large or unlimited losses
Selling options can be riskier than buying them.
In-the-Money, At-the-Money, Out-of-the-Money
In-the-Money (ITM)
Call: Stock price > Strike price
Put: Stock price < Strike price
At-the-Money (ATM)
Stock price = Strike price
Out-of-the-Money (OTM)
Call: Stock price < Strike price
Put: Stock price > Strike price
Leverage in Options Trading
Options provide leverage because traders control large positions with smaller investments.
Example:
Buying 100 shares at $100 = $10,000 investment
Buying one call option might cost $300
If the stock rises significantly, the percentage return on the option can be much higher than owning the stock directly.
However, if the stock does not move as expected, the option can expire worthless.
Risks in Derivatives and Options Trading
While derivatives provide opportunities, they also involve risks:
1. Market Risk
Price movements can lead to losses.
2. Time Decay (Theta)
Options lose value as expiration approaches.
3. Volatility Risk
Changes in volatility affect option prices.
4. Leverage Risk
Losses can be magnified.
5. Liquidity Risk
Some contracts may be difficult to buy or sell.
Option Pricing Basics
Option prices are influenced by:
Current stock price
Strike price
Time until expiration
Volatility
Interest rates
The Black-Scholes model is commonly used to estimate theoretical option prices.
Popular Options Strategies
Traders use different strategies depending on their outlook.
1. Covered Call
Holding a stock and selling a call against it to earn income.
2. Protective Put
Buying a put to protect a stock position.
3. Straddle
Buying both a call and a put at the same strike price to profit from large moves in either direction.
4. Spread Strategies
Combining multiple options to reduce risk.
Futures vs Options
Feature Futures Options
Obligation Both parties obligated Buyer has right, not obligation
Risk Can be unlimited Buyer risk limited to premium
Upfront Cost Margin required Premium paid
Complexity Moderate More complex
Exchange-Traded vs OTC Derivatives
Exchange-Traded Derivatives
Standardized contracts
Regulated exchanges
Lower counterparty risk
Over-the-Counter (OTC)
Customized contracts
Private agreements
Higher counterparty risk
Importance in Financial Markets
Derivatives increase:
Market efficiency
Price discovery
Liquidity
Risk management capabilities
However, misuse or excessive speculation can cause instability, as seen during the 2008 financial crisis involving complex derivatives like credit default swaps.
Who Uses Derivatives?
Individual traders
Hedge funds
Banks
Corporations
Institutional investors
For example, airlines hedge fuel costs using oil futures, and multinational companies hedge currency risk using forex derivatives.
Conclusion
Derivatives and options trading are powerful financial tools that allow market participants to hedge risk, speculate on price movements, and enhance portfolio returns. Options, in particular, offer flexibility because they provide the right—but not the obligation—to buy or sell an asset at a fixed price.
However, these instruments involve complexity and significant risk, especially due to leverage and time decay. Successful derivatives trading requires strong knowledge, risk management, and disciplined strategy.
In summary, derivatives and options are essential parts of global financial markets. When used wisely, they can reduce risk and create opportunities. When misused, they can lead to substantial financial losses. Understanding their structure, purpose, and risks is the foundation for participating safely and effectively in derivatives markets.

Bajaj finance: is retest done or pending?As per chart reading we can see that BAJFIN completed the retest in the market volatility of the last few weeks, be it in budget or US-INDIA trade deal.
it is gearing up for new rally.
have a 10% SL and it can give return more than 50%.
first tareget should be 25% then 38% and last target should be 50% of the current price.
current price : 967
SL: 870
Target 1: 1208
Target 2: 1334
Target 3 (Final target) :1450

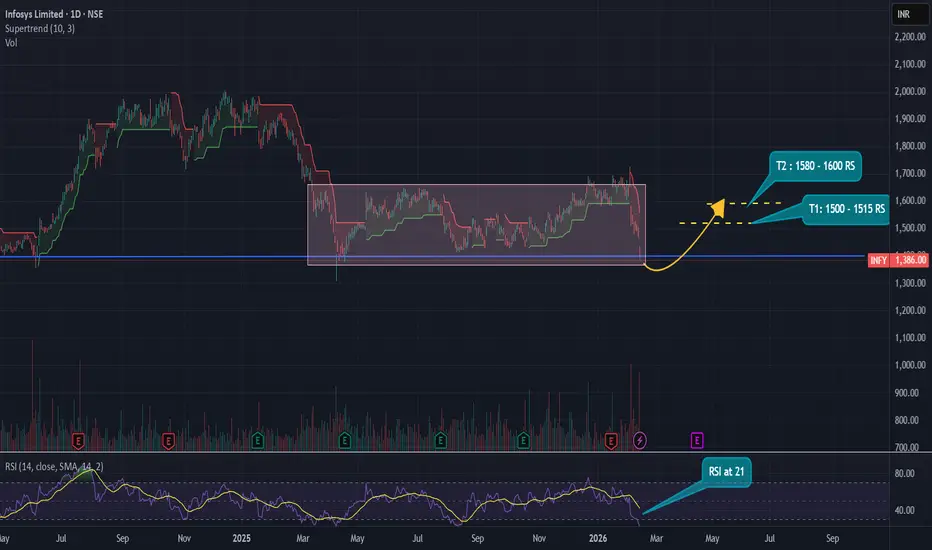
Infosys LimitedInfosys Technical Outlook :
Infosys has been consolidating within the ₹1400–₹1700 range over the past year. Currently, the stock is in the oversold zone, with the RSI at 21, and is testing a strong support level around ₹1400.
From a mid-term perspective, the setup looks attractive:
- Target 1: ₹1500–₹1515
- Target 2: ₹1580–₹1600
This implies a potential return of 9–12% from current levels, provided the support holds.
Disclaimer : The Above shared Content is for information and education purposes only and should not be treated as investment or trading advice. Im not SEBI registered, Contact your financial advisor before any investment.
Groww - Approaching Confluence ResistanceGroww :
Looking Good for a Triangle Breakout
185 -189 is the region of confluence resistance, Breaking is crucial for upmove towards 200+ zone

OFSS - Breakdown - Approaching crucial levelsOFSS :
Important support Breakdown observed
6400 levels are crucial levels to watch out, breaking the same will lead to panic and possible 10-20 percent fall

BUY TODAY SELL TOMORROW for 5% - BTST STOCK OPTIONDON’T HAVE TIME TO MANAGE YOUR TRADES?
- Take BTST Stock Option trades at 3:25 pm every day
- Try to exit by taking 4-7% profit of each trade
-Resistance Breakout in TRENT
BUY TODAY, SELL TOMORROW for 5%

BUY TODAY SELL TOMORROW for 5%DON’T HAVE TIME TO MANAGE YOUR TRADES?
- Take BTST trades at 3:25 pm every day
- Try to exit by taking 4-7% profit of each trade
- SL can also be maintained as closing below the low of the breakout candle
Now, why do I prefer BTST over swing trades? The primary reason is that I have observed that 90% of the stocks give most of the movement in just 1-2 days and the rest of the time they either consolidate or fall
Cup & Handle Breakout in KPL
BUY TODAY SELL TOMORROW for 5%

Commodities and Alternative Assets1. Commodities
Definition
Commodities are raw materials or primary agricultural products that can be bought and sold. They are standardized and interchangeable, meaning one unit is essentially the same as another unit of the same grade. For example, one barrel of crude oil is equivalent to another barrel of the same type and quality.
Commodities are typically traded on exchanges such as the Chicago Mercantile Exchange (CME) or the London Metal Exchange (LME).
Types of Commodities
1. Energy Commodities
Crude oil
Natural gas
Coal
Gasoline
Energy commodities are highly sensitive to geopolitical events, supply disruptions, and global demand cycles.
2. Precious Metals
Gold
Silver
Platinum
Palladium
Gold is often viewed as a “safe haven” asset during economic uncertainty or inflationary periods.
3. Industrial Metals
Copper
Aluminum
Nickel
Zinc
These are closely tied to industrial production and infrastructure development.
4. Agricultural Commodities
Wheat
Corn
Soybeans
Coffee
Sugar
Cotton
Prices are affected by weather patterns, seasonal cycles, and global consumption trends.
Ways to Invest in Commodities
Physical Ownership
Buying physical gold, silver, or other tangible goods.
Futures Contracts
Agreements to buy or sell a commodity at a future date at a predetermined price. Futures are highly leveraged and commonly used by traders and hedgers.
Exchange-Traded Funds (ETFs)
Commodity-based ETFs track the price of a specific commodity or a basket of commodities.
Commodity Stocks
Investing in companies that produce commodities (e.g., oil companies, mining firms).
Mutual Funds and Index Funds
Provide diversified exposure to commodity markets.
Characteristics of Commodities
Inflation Hedge: Commodities often rise in price when inflation increases.
Low Correlation with Stocks/Bonds: They can reduce portfolio volatility.
High Volatility: Prices fluctuate due to global supply-demand imbalances.
Cyclical Nature: Prices move in long-term cycles tied to economic expansion and contraction.
Advantages of Commodities
Portfolio diversification
Protection against inflation
Opportunity for high returns during commodity booms
Hedge against currency depreciation
Risks of Commodities
Price volatility
Geopolitical risk
Weather risk (agriculture)
Storage and transportation costs (for physical commodities)
Leverage risk in futures trading
2. Alternative Assets
Definition
Alternative assets are financial assets that do not fall into traditional categories like stocks, bonds, or cash. They often require specialized knowledge and may be less liquid than conventional investments.
Alternative investments are commonly used by institutional investors, hedge funds, and high-net-worth individuals.
Major Types of Alternative Assets
1. Real Estate
Includes residential, commercial, and industrial properties. Investors may earn income through rent and capital appreciation.
Direct property ownership
Real Estate Investment Trusts (REITs)
Real estate funds
2. Private Equity
Investment in private companies or buyouts of public companies. Investors aim to improve operations and sell at a profit.
Venture capital
Growth capital
Leveraged buyouts
3. Hedge Funds
Actively managed investment funds using complex strategies:
Long/short equity
Arbitrage
Global macro
Event-driven strategies
4. Infrastructure
Investments in public assets such as:
Airports
Toll roads
Utilities
Renewable energy projects
These provide stable, long-term cash flows.
5. Commodities (as Alternatives)
Though commodities are their own asset class, they are often categorized under alternative investments.
6. Collectibles and Tangible Assets
Art
Rare coins
Wine
Classic cars
Antiques
Value depends on rarity, condition, and demand.
7. Cryptocurrencies
Digital assets like Bitcoin and Ethereum. Highly volatile but increasingly considered an alternative investment class.
Characteristics of Alternative Assets
Low Liquidity: Harder to buy and sell quickly.
Higher Return Potential: Often target above-market returns.
Higher Risk: Complexity and lack of regulation in some areas.
Less Transparency: Valuations may not be daily or publicly available.
Advantages of Alternative Assets
Diversification
Lower correlation with traditional markets.
Inflation Protection
Real estate and infrastructure often adjust with inflation.
Higher Yield Potential
Private equity and hedge funds can outperform public markets.
Access to Unique Opportunities
Investment in emerging industries and innovation.
Risks of Alternative Assets
Illiquidity risk
High fees (management and performance fees)
Valuation risk
Regulatory risk
Complexity and limited transparency
Role in Portfolio Management
Modern portfolio theory suggests diversification reduces overall risk. Commodities and alternative assets improve diversification because they behave differently from traditional equities and bonds.
Institutional investors such as pension funds often allocate:
5–15% to commodities
10–30% to alternative investments
The actual allocation depends on:
Risk tolerance
Investment horizon
Liquidity needs
Economic outlook
Conclusion
Commodities and alternative assets have become increasingly important components of modern investment portfolios. Commodities provide exposure to tangible goods essential to the global economy and offer inflation protection and diversification benefits. However, they are subject to high volatility and global economic forces.
Alternative assets encompass a wide range of investments including real estate, private equity, hedge funds, infrastructure, collectibles, and digital assets. These investments often provide opportunities for enhanced returns and risk diversification but come with challenges such as illiquidity, complexity, and higher fees.
For investors seeking to move beyond traditional stocks and bonds, commodities and alternative assets can enhance portfolio resilience and return potential. However, careful analysis, risk assessment, and strategic allocation are essential to successfully integrate them into a long-term investment strategy.


BAJFINANCE: At a Decisive Crossroads!The gap-up and volatility we're seeing today in BAJFINANCE are driven by two main factors:
India-US Trade Deal Euphoria: The broader market surged today after US President Donald Trump and PM Modi announced a historic trade deal. This sparked a massive rally across the Sensex and Nifty (up over 2.5%), with Bajaj Finance being one of the top gainers as foreign investors eye a return to Indian equities.
Q3 Earnings Report (Mixed Bag): Bajaj Finance released its Q3 results today post-market hours.
The Good: Net Interest Income (NII) surged 21% YoY to ₹11,318 crore, and Assets Under Management (AUM) grew 22%.
The Bad: Net profit fell 5.6% YoY to ₹4,066 crore, primarily due to a one-time charge from new labor codes and accelerated credit loss provisions.
Market Sentiment: While the profit dip looks "red" on paper, the underlying business growth (AUM and NII) is robust, which often keeps the bulls interested.
Key Technical Levels for the Next 2-3 Days:
🚧 The Decisive Zone (951–971): This is the battlefield. The stock is currently testing the 50-day EMA and a major sentimental barrier at 970.
📈 Bullish Case: If the stock sustains above 971, the next stop is 1005. A trade with volume above this could confirm the end of the long-term correction.
📉 Bearish Case: If it fails to hold the 951 level, expect a retracement toward the immediate support at 913.
💡 Strategy: Be extremely vigilant near the 970 mark. With Q3 results now public, the market will spend the next 48 hours "digesting" the data. High volatility is expected.
Watch for: Volume-backed breakout above 971 or a rejection candle at 970.

TCS – Heavy Breakdown | Key Support Under Threat Amid IT Sector TCS has witnessed a decisive breakdown, signaling a clear shift in market structure. The recent decline is not just a technical event but aligns closely with the broader weakness seen across the IT sector.
Ongoing pressure from global cues — including uncertainty around US interest-rate cuts, cautious enterprise IT spending, and weak sentiment in global tech stocks — has weighed heavily on Indian IT names. In this environment, TCS price action has firmly tilted in favor of sellers.
The stock has broken below its earlier base and is now trading at lower levels. Every minor recovery attempt is facing selling pressure, indicating that the market is currently selling rallies rather than buying dips.
Key Price Zones to Watch
₹2,650: This is a critical short-term support zone. Price behavior around this level will be crucial in deciding whether a temporary pause or further downside unfolds.
A decisive break below ₹2,650 could open the door for a deeper move towards the ₹2,400 demand zone, which acts as the next major support.
On the upside, the ₹2,900–3,000 zone is now a strong supply area. Unless price reclaims this zone with acceptance, upside attempts may continue to face resistance.
View
The overall structure remains negative, and broader IT sector sentiment does not yet support a sustainable reversal. Until higher levels are reclaimed, any bounce should be viewed with caution.
Price action around ₹2,650 will likely define the next directional move.
— Ayushi Shrivastava
Market structure & price-action focused analysis
This research is prepared with the assistance of AI tools for data structuring and presentation.

GODREJAGRO 1 Day Time Frame 📊 Current approximate price range: ~₹580 – ₹600+ (varies by data source & session)
📌 Daily Pivot & Support/Resistance Levels (Standard)
(based on common pivot formulas from technical data)
Pivot Point (Daily Reference): ~₹636 – ₹638
Resistance Levels
R1: ~₹601 – 602
R2: ~₹612 – 614
R3: ~₹622 – 624
Support Levels
S1: ~₹581 – 582
S2: ~₹571 – 573
S3: ~₹560 – 562
📍 Alternate intraday S/R from TradingView-type calculations (indicative)
(These are shorter-term pivot-based intraday levels that traders use for entry/exit)
Supports:
S1 ~₹642.9
S2 ~₹648.0
S3 ~₹653.2
S4 ~₹637.8
Resistances:
R1 ~₹658.2
R2 ~₹663.4
R3 ~₹668.4
R4 ~₹672.6
These figures vary slightly depending on calculation method (Classic pivot, Fibonacci, Camarilla, etc.). But the daily support range near ₹580–₹560 and resistance range near ₹600–₹620+ are consistent indicators.
📊 Important Levels to Watch
Near-term support zones (key floors):
₹580–₹575: First real intraday support
₹560–₹550: Secondary broader support (breakdown risk)
Near-term resistance zones:
₹600–₹612: Immediate resistance
₹620–₹630+: Higher resistance if bulls resume control

EICHERMOT-BUY LIMITView: Bullish continuation – Buy on retracement
Eicher Motors is maintaining a strong higher high – higher low structure, indicating a clear uptrend. After a sharp impulsive move upward, price is likely to retrace toward the previous breakout / demand zone before continuing higher.
The marked purple zone around ₹7,150 – ₹7,300 is a strong demand and previous resistance-turned-support area. This zone aligns with:
Prior consolidation base
Breakout level
Trendline support area
Strong bullish reaction previously
This makes it an ideal area to place a Buy Limit order, instead of chasing price at higher levels.

#SENCO GOLD NEXT MOVE #SENCO GOLD NEXT MOVE for short term
NEXT LEVEL 405 (8%)
after that big move..will update after this level
little bit retracement may b

Bigger Stoploss wont save you in the markets ? ( Proof ) I have used older than 3 months chart to explain a concept / bias here - keeping bigger stoploss will save your trade ? No , that is a big lie, watch the video to understand .

PREMIERENE: Bulls Defend 776 Support,Is 805 Next?PREMIERENE is currently showing a classic "volatile consolidation" pattern. After a strong bounce from the 766 level that peaked at 833, the stock faced significant selling pressure today, sliding back to test the strength of its recent recovery.
The price action has narrowed down to a decisive pivot zone between 772.50 and 776 . Today’s session confirmed the importance of this area as the stock managed to find intraday buyers right at this level with sentimental level at 782
Bullish Scenario: If the stock maintains its footing above 776, the immediate target remains 805. A sustained move above this could restart the further momentum towards the recent high of 833.
Bearish Scenario: A breakdown and trade below 772.50 would likely trigger a deeper correction. In this case, the next logical support sits at 738, which aligns with previous structural lows.
Joint Venture & Expansion: The company recently announced a JV with BA Prerna Renewables and has successfully commissioned a new 400 MW solar cell facility in Telangana. This brings their total cell capacity to 3.6 GW, supporting their aggressive ₹11,000 crore expansion plan.
Earnings Momentum: In the latest Q3 FY26 earnings (released Jan 23), Premier Energies reported EPS that exceeded analyst expectations, though revenue slightly lagged.
Institutional Interest: Despite recent volatility, 90% of analysts track the stock with a "BUY" rating, with institutional giants like Quant Mid Cap Fund holding significant stakes.
