Adani Energy Technical Overview - Monthly 👉🇮🇳#Adani Energy encompasses several entities within the Adani Group, predominantly involved in energy solutions, including power transmission, distribution, and generation. Here's an Technical 📉Chart based on the available information:

POLICYBZR near 200ema......Should we BUY?Pro's: POLICYBZR is at 200 Day moving average. It is at Channel support.
It has come to 200d ema supoort for second time.
Caution: It has made double top which isn't great technically. If it breaks channel support, then it may take support at IPO Breakout zone. But need to check Q3FY25 result growth pace to confirm it strength in stock.


ZEN TECHNOLOGIES - AT OLD SUPPORT - DAILY CHARTZen Technology has taken support at an old support, you may clearly see that in the chart.
Stock is trading under 50ema - almost 22% under 50ema and about 35% down from the ATH.
It is taking support at the same level for the 6th time, so this gives us an edge to decide it is a strong support.
This market is a time to invest for long term and sit back, so plan accordingly, one should definitely invest at least 30% capital for long term. It will give a really good reward.
This stock gave sharp recovery in the past . If you want I can share that analysis with you, please leave a comment if you want me to do that.
If you like my analysis, please follow me as a token of appreciation :)
in.tradingview.com/u/SatpalS/
For learning and educational purposes only, not trading advice. Please consult your financial advisor before investing.

BLISSGVS Long Idea...BLISSGVS is consolidating in monthly chart. Taking trade after monthly confirmation (close above resistance) is good for safe trader
Personally I'm following it in daily charts to get a good early entry with some risk.
Lets see how it turns.
NOTE: NO idea of comapny Fundamentals. Just a technical take. Should plan trade with proper risk management.

CAN ANGEL ONE GIVE 80% GAIN ?Angel one today close price 2296.55 yesterday low is 2150.30 it has entered the buying zone.
and because the Net profit of DEC Quarter was decrease compare to SEP quarter it may be possible to consolidate near the zone and after the Next Quarter if Net profit will increase then Angel one is going might be give 80% gain within 1year..

Bajaj Finance - Rock Steady and SafeA long multi year consolidation is coming to an end. In turbulent times in the market it is always a good move to fall back on the very safe bets for long term.
Fundamentally:
- Strong Long Term Fundamental Strength with an average Return on Equity (ROE) of 17.23%
- Healthy long term growth as Operating profit has grown by an annual rate of 22.46%
- The company has declared Positive results for the last 13 consecutive quarters
- PBDIT(Q) Highest at Rs 11,752.25 cr.
- PBT LESS OI(Q) Highest at Rs 5,396.34 cr.
- PAT(Q) Highest at Rs 3,999.73 cr.3
- High Institutional Holdings at 35.96%
With its market cap of Rs 4,71,254 cr, it is the second biggest company in the sector (behind Life Insurance) and constitutes 10.77% of the entire sector. Its annual Sales of Rs 62,278.71 are 2.83% of the industry

CREDITACC long Idea...CREDITACC chart looks good for uptrend. Good Volumes have seen in Daily chart. It is yet to confirm uptrend by breaking trendline resistance.
Pro's: Liquidity pump in system by RBI which is good news for Finance Sector. Waiting for Interest rates to reduce in coming months.
Con's: Q3FY25 PAT is down and sales growth is down. Buisness is dull due to Micro-Finance Lending NPA's, Provisions. Growth will come with Interest rate cycle. So good time is Ahead.
NOTE: Risk Management is Very Important to save capital.

2 Stocks Price action for 30 Jan 2025 I daily make educational content videos for swing / positional trading

A SLOW WALK PATH ONLY FOR LONG TERMonly for long term investors i am personally holding this company it is an investment pick has current market scenario only long term is the outlook a good dividend paying company below are the trade ratios i sm looking the market bearish so will buy slolwy on dips for future
possible @ 710/700/650
looking for 1000/1100/1800+
only investment pick no trading
buy and forget no time
yealry 10 rs+ dividend company has it is an investment so no sl will hold for longer tenure

ITC Hotels - Accumulate the 'luxury' or give it a pass?The most awaited ITC Hotels share got listed finally today. This spin off from ITC LTD, its parent company appears to be logical move for growth.
Is this a value buy and should one accumulate this share? The video answers exactly this.

Top 4 Swing Trading Ideas for Jan 30, 2025!🚀Top 4 Swing Trading Ideas for Jan 30, 2025! 🚀
📢 Disclaimer: The 4 stocks discussed here are for educational purposes only. 📚💡
✅ First, learn how to trade, then focus on earning! 💰📈
💬 Got a stock in mind? Drop a comment, and I'll reply! 🔍📊
#LearnBeforeYouEarn #StockMarket

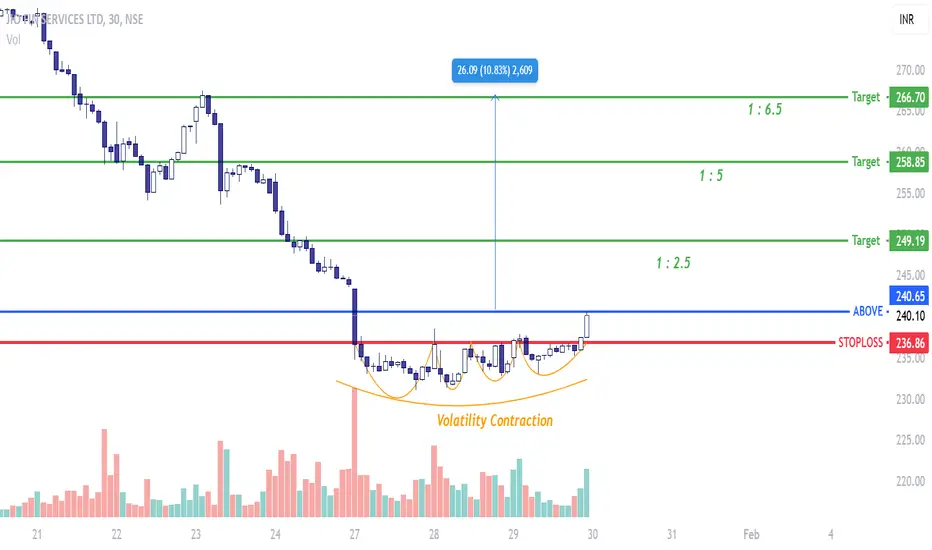
JIO FIN SERVICES - Swing ContenderOn the larger scheme of this this stock has been beaten down and the trajectory is deep negative. However, in the very short term the stock can correct its trajectory and as a trader one can make use of these opportunities.
A volatility contraction has happened forming a base on shorter timeframe. Expecting this stock to perform well over the next 2 days.
CHOLAFIN - ReassessmentThe last time I posted the chart, the inverted Head and Shoulder pattern was evident and it had signaled that the downward trajectory has been arrested. However, the analysis was premature and with the very close Stoploss we were safely out of the stock. That is the benefit of having a stoploss.
Since then the stock has gone on to form a nice base respecting that bottom zone the Inverted Head and Shoulder had arrested and also now it is making a more evident Triple Bottom on the Support line of the Ascending Channel.
I believe the stock is now ready for an up move.

Trade Alert : Tata Consumer Product, breaking out with INHS Technical Analysis:
Trading Above 20 EMA : good for short term
Broken out from INHS pattern with good volume
Good Volume
Trading Setup
Buy at cmp unless gap down opening
Target would be :1026-1060
short Term SL would be : 955
Risk Reward Ratio : 2.6
Note : Market is volatile nowadays, so keep your size as per risk appetite

BOI Showing Strength with Vol., Good Q3 and Below BV.NSE:BANKINDIA is showing strength with volumes getting picked since two days after good Q3 Numbers and RBI Liquidity Inject in the System. It is still trading below its book value of 155 Rs.
Bank of India posted a good set of numbers as fresh NPA accretion declined on a sequential basis. Margins were partly impacted due to lower margins on international book. Loan growth was healthy during the quarter. Lower credit costs and contained opex helped the bank post a good rise in net profit.
F&O Activity:
Significant Long Build-up with 105 PUT Showing Significant OI addition.
Trade Setup:
It can be a Good 1:2 RISK-REWARD Trade with the recent swing low being crucial. The stock closed above 20 DSMA.
Target(Take Profit):
115/116 Levels for Swing Trader and 155 for Positional Trader.
Stop-Loss:
99/100 For Swing Trader and Recent Base of 89-91 for Positional Trader.
📌Thank you for exploring my idea! I hope you found it valuable.
🙏FLLOW for more
👍BOOST if useful
✍️COMMENT Below your views.
Meanwhile, check out my other stock ideas below until this trade is activated. I would love your feedback.
Disclaimer: This analysis is intended solely for informational and educational purposes and should not be interpreted as financial advice. It is advisable to consult a qualified financial advisor or conduct thorough research before making investment decisions.

"HDFC Bank: Holding Steady in a Rangebound Market"If HDFC Bank's price stays between ₹1622 and ₹1688, it's in a rangebound phase.
Break above ₹1688? Enter a long trade.
Still within the range? Wait for a clear breakout.
By
Financialsako〽️

Mphasis Double Bottom Looking good for a Swing/Postional Trade NSE:MPHASIS this week showed excellent price action on the back of decent Q3 Results and Management Commentary of Revenue during the quarter was driven by strong growth in the Banking and the Technology, Media & Telecom segments coupled with healthy revenue ramp-up in new clients despite the current quarter being a seasonally soft quarter. Consolidated revenue was up by 0.7% QoQ while net profit was up by 1.1% during the same period. The management stated that sustainable EBIT margin would be in the range of 14.6%-16%.
F&O Activity:
Significant Long Build-up with 2900 PUT Showing Significant OI addition.
Trade Setup:
It can be a Good 1:1 RISK-REWARD Trade with the recent double-bottom base being crucial. After making a double bottom the stock started a pullback with decent volumes. RSI also gaining momentum, indicating a continuation of the recent up move. When should I enter? ideally 50% near 3000 and the remaining 50% near 2950.
Target(Take Profit):
3260/3565 Levels for Swing/Positional Trader.
Stop-Loss:
Entry Candle Low For Swing Trader and Recent Base of 2758/2730 for Positional Trader.
📌Thank you for exploring my idea! I hope you found it valuable.
🙏FLLOW for more
👍BOOST if useful
✍️COMMENT Below your views.
Meanwhile, check out my other stock ideas below until this trade is activated. I would love your feedback.
Disclaimer: This analysis is intended solely for informational and educational purposes and should not be interpreted as financial advice. It is advisable to consult a qualified financial advisor or conduct thorough research before making investment decisions.

CARE RATINGS: Expecting 20-25% upside potential!⚡️Price Analysis:
1️⃣ Trading near crucial EMA confluence zone - showing strong support
2️⃣ Long-term uptrend intact with clear HH-HL structure.
3️⃣ Recent correction found support at previous consolidation Dz
4️⃣ Volume trend showing distribution at highs - caution needed
5️⃣ Both EMAs rising - indicating underlying bullish momentum
✨ Key Observations:
➡️ Strong Dz confluence at support (EMA + previous consolidation)
➡️ RRR favorable at current levels with defined risk
➡️ Financial sector showing relative strength currently
➡️ Previous consolidation breakout acting as strong support
➡️ Multiple timeframes aligned for potential reversal
⚠️ Disclaimer: This is NOT a buy/sell recommendation. This post is meant for learning purposes only. Views are personal. Please, do your due diligence before investing.⚠️
💬 What's your view on Rating agency stocks? Share below! ✌️🔥 Happy Trading!✅🚀

BBTC Reversal ? ->> Bounced from a Important Level NSE:BBTC today bounced from an important level which was broken by heavy volume earlier in June 2024 now today exactly it went up with Price and Volumne Action. 100 DSMA will be important to see at the above levels.
Trade Setup:
It can be a Good 1:1 RISK-REWARD Trade for Aggressive Swing Trader, with 10 DSMA and Base Draw will be Important to sustain.
Target(Take Profit):
2532.90 will be Levels for Swing Trader.
Stop-Loss:
Around 1928.55 For Swing Trade and Positional Trader.
📌Thank you for exploring my idea! I hope you found it valuable.
🙏FLLOW for more
👍BOOST if useful
✍️COMMENT Below your views.
Meanwhile, check out my other stock ideas below until this trade is activated. I would love your feedback.
Disclaimer: This analysis is intended solely for informational and educational purposes and should not be interpreted as financial advice. It is advisable to consult a qualified financial advisor or conduct thorough research before making investment decisions.

Fresh Buy Sinal on Globus Spr. With MACD getting +veNSE:GLOBUSSPR today gains on the drop in rice price for ethanol distilleries with MACD turning Positive and RSI showing Strength, it was from a good base if the given resistance is broken it can provide a good swing.
Trade Setup:
It can be a Good 1:1 RISK-REWARD Trade, with the recent base being crucial levels on downside.
Target(Take Profit):
1115.80 Levels for Positional Trader.
Stop-Loss:
Around 795.85 For Swing Trade and Recent BO Base for Positional Trader.
📌Thank you for exploring my idea! I hope you found it valuable.
🙏FLLOW for more
👍BOOST if useful
✍️COMMENT Below your views.
Meanwhile, check out my other stock ideas below until this trade is activated. I would love your feedback.
Disclaimer: This analysis is intended solely for informational and educational purposes and should not be interpreted as financial advice. It is advisable to consult a qualified financial advisor or conduct thorough research before making investment decisions.

Deepak Fertilizers - Cup and Handle ContinuationAs you all can see there is a beautiful cup followed by a handle on the Weekly timeframe.
After the pattern broke out, the stock managed the market sell off pretty well by retesting its previous supply zone (now demand zone) and maintained the sideways trend without spoiling the pattern.
This sudden surge implies that the stock is ready to continue its uptrend.
Talking about fundamentals:
- High Management Efficiency with a high ROCE of 17.10%
- The company has a high Debt to EBITDA ratio of 1.88 times
- Healthy long term growth as Operating profit has grown by an annual rate 40.09%
- Positive results in Dec 24
- OPERATING PROFIT TO INTEREST(Q) Highest at 4.94 times
- NET SALES(HY) At Rs 5,325.74 cr has Grown at 24.53 %
- DEBT-EQUITY RATIO(HY) Lowest at 0.67 times
- With ROCE of 14.4, it has a Fair valuation with a 1.9 Enterprise value to Capital Employed
- The stock is trading at a discount compared to its average historical valuations
- Over the past year, while the stock has generated a return of 106.57%, its profits have risen by 0.5%
- High Institutional Holdings at 20.38%. Their stake has increased by 0.7% over the previous quarter.

Bullish Harami Pattern spotted in Green Power todayBullish Harami Pattern is seen on the chart today. One out of five important signals has come on the chart today. Four important signals have to come. RSI has already touched it's low side. This is not investment advice, the analysis is for educational purpose only but we can see ₹28.08 in near term if this trend reversal worked out.
