CYient coming to strong support#Cyient share prices are weaker today after results !
- Q3 results today were Not as expected and commentary was not too positive as well.
- Technically, is falling with HIGH volumes, and the first bounce can happen from 20W-EMA, and incase of further weakness it can go down to 1250 - 1150 zone (worst case in short term)..
- The good part in this stock is that it seems to trade at reasonable P/E ratio and much deeper correction may not happen technically.
#learn_at_stoxsense #Learntradingwithsudhir #StockMarketIndia #Optiontrading #learntrading

VIJAYA#VIJAYA - After the low volume pull back, the price is taking the support from 50MA and trying to move up. Stop loss level is on the chart.


Positional Paisa Double Trade RBL BANK
LTP 165
SL CLB 110
Add on Dips
Tgts 200-260-290-320-360-390
For more info - Plz visit my Profile
&
Don't miss to Boost this idea
Rgds,
Naresh G
Sebi Reg. RA

Persistent Systems: A Promising Opportunity?Persistent Systems is currently trading in an ascending channel, indicating an ongoing uptrend 📈. After correcting nearly 20% from its all-time high (ATH)—which coincided with the channel top—it has now broken above a key trendline with strong volume and a wide-range bullish candle 💪.
📊 Key Technical Analysis:
🎯 Entry: ₹6,365
⛔ Stop Loss (SL): ₹5,538 (closing basis)
🏁 Targets:T1 (Previous ATH): ₹6,790 (+7%)
Positional Target: ₹7,681 (+21%)
Long-Term Target: ₹9,094 (+43%)
📌 Technical Highlights:
1⃣Persistent has bounced back from the 50 DMA, showing strong respect for this critical support level
2⃣Closed above the 50 DMA with a strong bullish candle (minimal upper wick, significant volume).
3⃣Trendline Breakout
4⃣RSI is rising, indicating upward momentum.
5⃣Channel top could act as resistance—keep an eye on price action near T1 levels.
🧮 Position Sizing:Start with 20-30% of your planned allocation at ₹6,365.
If ₹6,790 is broken with volume, consider adding more.
Partial profits can be booked at T1, with the remainder trailed for higher targets.
⚠️ Respect the SL (Stop Loss), as it represents a 12.45% risk.
📈 Why Persistent Systems Looks Attractive for Long-Term Consideration:
1. 🌟 Growth Drivers:
AI Integration: AI is a core focus for Persistent’s growth strategy, with significant investments in AI-driven solutions 🤖.
Strategic Acquisitions: Acquisitions like Starfish Associates (contact center modernization) and Arrka (digital governance and AI cybersecurity) enhance Persistent’s offerings.
📊 Revenue Momentum: The company has reported 18 consecutive quarters of revenue growth, recently achieving a robust 18.4% YoY increase.
🏆 Industry Recognition: Named the fastest-growing IT services brand in the 2024 Brand Finance India 100 report, highlighting its competitive edge.
2. 🛠️ Expansion Plans:
Focused on AI-led, platform-driven services to drive innovative solutions for clients.
Strengthened executive leadership to support non-linear growth through mergers, acquisitions, and large deals.
3. 💹 Respecting Key Support Levels:
Persistent has consistently respected the 50 DMA, a strong indicator of investor confidence and support at this level.
These factors, coupled with the company’s strategic focus on AI and consistent execution, make Persistent Systems an attractive consideration for long-term investment.
🌍 Broader Sector Context:
The IT sector is holding up well despite market volatility, and Persistent’s positioning in emerging technologies like AI ensures it is aligned with future trends 🔮.
💡 Final Thoughts:
This trade is against the trend, so trade light and manage risk effectively ⚖️. The channel top could pose resistance, but the overall structure and long-term prospects are promising. The probability of trades failing is high when the market is in a downward trend. Please keep that in mind.
If you find this analysis insightful, like and share to help others make informed decisions 👍.
Follow me for more educational trading ideas and detailed stock analysis 📚.
❗ Disclaimer: This is for educational purposes only. Please consult with your financial advisor before making any trading or investment decisions.

Muthoot Finance | VCP Pattern in Play Muthoot Finance | VCP Pattern in Play 🔍
Technical Overview
📈 Trend: Uptrend, trading within an ascending channel.
🔄 Pattern: Volatility Contraction Pattern (VCP) in progress, signaling potential explosive movement.
📉 Correction: The stock corrected ~15% during the recent market sell-off but rebounded strongly, re-entering the channel. It’s now only ~9% off its recent ATH, showcasing resilience.
Key Levels to Watch
✅ Entry Point: Breakout above ₹2279 with strong volume and a wide-range candle.
🎯 Targets:
T1: ₹2492 (R:R = 1:1)
T2: ₹3200+ (post-market stabilization, aiming for R:R = 1:2)
🛡️ Stop Loss: ₹2067.9 (below the most recent swing low to manage risk).
Strategy
1️⃣ Enter 30% position on a clean breakout above ₹2279. Wait for a retest and continuation to add the rest.
2️⃣ If the breakout is sharp and you miss the entry, wait for a retest and continuation before entering, do not enter in FOMO.
3️⃣ Once T1 is hit, book partial profits to lock in gains, given the weak market conditions.
4️⃣ Hold the remaining position as per your risk appetite and trail your SL to protect profits.
Why This Stock?
⭐ Resilience: Despite the correction, Muthoot Finance re-entered the channel, showing strength against market headwinds.
📊 Strong Indicators: RSI is rising, signaling bullish momentum, and the VCP pattern suggests tightening volatility before a potential breakout.
📉 Controlled Drawdown: From its ATH, the stock fell just ~9%, demonstrating relative strength compared to the broader market.
⭐Trading above Key DMAs
Key Risks to Consider
⚠️ Weak Market Conditions: Broader market trends remain bearish, trading below the 200 DMA, increasing the chance of a failed breakout.
⚠️ Volume Dependency: Strong breakout volume is essential to validate the pattern.
⚠️ Market Correlation: Any further market correction could pressure this trade setup and the probability of hitting the SL increases. So trade light.
Who Should Trade This?
1️⃣Aggressive Traders: Can follow the breakout strategy with proper position sizing.
2️⃣Conservative Traders: Wait for market stabilization and a close of NIFTY 50, Nifty 500 above the 200 DMA before entering any trade.
Actionable Insights
🔒 Lock Partial Profits at T1: Secure gains to mitigate risk in this volatile environment.
📈 Trail Your Stop Loss: Once T1 is achieved, manage the trade dynamically to maximize returns.
Disclaimer
This analysis is for educational purposes only and not financial advice. Please conduct your own research and analysis before making any investment decisions. Trading involves significant risk.
Trade wisely and stay disciplined! 🚀📊

Head and shoulder patternhead and shoulder pattern create volume is average wait for breakout treandline pattern but one thing is negative 1000 is psychological resitence

breakout trendline kei industries wait for breakout very good volume seen date on 2 jan and and five time touch trenline mostlay chance is here if breakout is done very high chance good movement played very well but only one thing is negative market mood is negative lets check

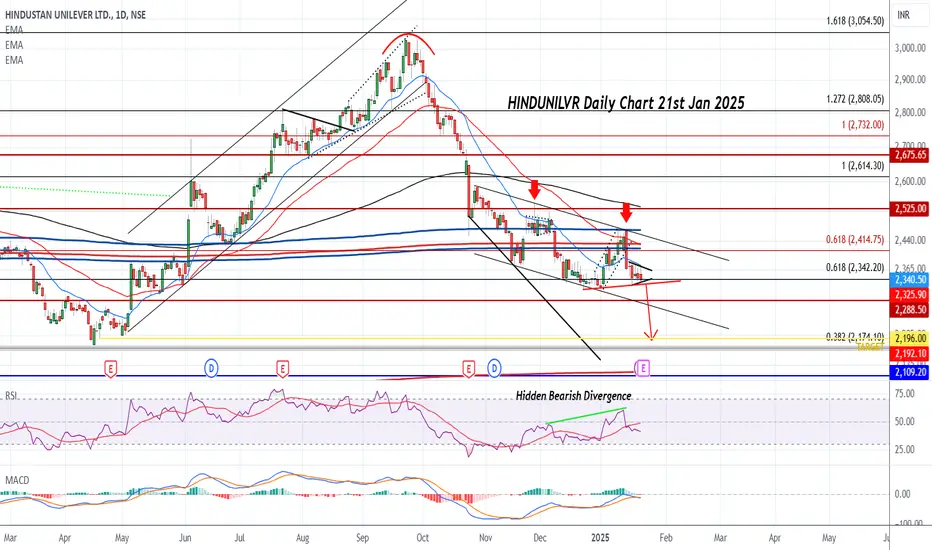
HINDUNILVR can DUMP on Earnings tomorrowAttached: Daily Chart as of 21st Jan 2025
Hidden Bearish RSI Divergence
MACD in Sell and below Zero line
Earnings tomorrow for HUL, if we go by Zomato Earnings which showed Slowdown and Weak Demand for Consumption then Earnings for HUL should also be similar
Price can Crash to Target 2200 and below levels
ALIVUS - Breakout in Daily timeframeALIVUS (Alivus Life Sciences Limited, formerly Glenmark Life Sciences) - Breakout
Breakout observed in daily timeframe of Alivus, the company has a very good chart pattern and is in a good uptrend and recently broke out with good volumes. The breakout has also been retested and sustained. There could be a good upside in this stock. The company also has good fundamentals as written below.
Fundamentals.
MCap 14,299Cr
Stock P/E 32.4
Industry P/E 31.6
ROCE 28.1%
ROE 21.1%
NPM 20.6%
PEG Ratio 1.69
Debt 16Cr
Reserves 2,514Cr
EPS 36.05
Promoter holding 75%
API contribution 9MFY24
Chronic : 69%
Acute : 31%
Key Therapeutic areas contribution 9MFY24
Diabetes : 4%
CVS : 41%
CNS : 17%
Pain Management : 6%
Others : 32%
Business segments
The company has two key segments - Generics and Complex APIs (92% of FY23 revenue) and Contract Development and Manufacturing Operations (CDMO) (8% of FY23 revenue)

[Intraday | Swing] NESTLEINDNESTLEIND seems to be consolidating allow EQL
A cautious long can take around 2150.
Keep strict SL.

HDFC stock Buy Sell or Hold ? HDFC Bank Stock: Is It Better to Buy Before or After the Union Budget
Support and Resistance Levels for HDFC Bank Stock
Support Level:
The major support for HDFC Bank is around ₹1550.
Until the Union Budget 2025, the market and HDFC Bank stock may show some upward momentum.
For now, you can consider buying the stock with ₹1600 as a support level.
Resistance Level:
The major resistance is at ₹1770.
There is a possibility of reaching this target near the resistance level.
If a weekly candle closes above ₹1770, the stock could gain further momentum.
Post the Union Budget, if HDFC Bank holds above the major support, the stock can be held for the long term. Keep a close watch on HDFC Bank and track these critical levels.
Why Buy Before the Budget?
Chance to Gain Early: Stocks often go up before the budget due to positive market sentiment.
Why Buy After the Budget?
Better Deals: If the stock price drops after the budget, you can buy at a lower price.
#HDFCBank #StockMarket #SupportResistance #UnionBudget2025 #InvestmentTips

HUL , Hero Moto Corp, TCS, Sheela Foams, HDFC Bank , & Many MoreHere Is Quick Analysis of Above Mentioned Scripts ,
We Are Standardized Focus on 200 Weeks Average @ Anchored Vwap

TATASTEELTATASTEEL's potential price movement:
Support Zone: ₹124.30 (price may bounce up).
Resistance/Target Zones: ₹160 (21.84% gain) and ₹183 (40.88% gain).
Risk: Below ₹124, it may drop to ₹112 or lower.
Analysis: If it holds above ₹124, it has good upside potential; otherwise, risk increases.

Zomato Expected Down Side Zomato is an Indian multinational company that provides a platform for discovering, reviewing, and ordering food from restaurants. Founded in 2008 by Deepinder Goyal and Pankaj Chaddah, the company initially started as *Foodiebay* before rebranding to *Zomato* in 2010. Over time, Zomato has grown into one of the most recognized online food delivery, restaurant discovery, and review platforms in the world.
Here’s a detailed company profile:
### 1. **Core Services**:
- **Restaurant Discovery & Reviews**: Zomato offers a comprehensive platform for users to explore restaurants, cafes, and bars in their locality. The platform features user-generated reviews, ratings, and photos to help users make informed decisions.
- **Food Delivery**: Zomato allows customers to order food online from a wide range of local restaurants. The company has invested heavily in streamlining its logistics and delivery networks to ensure fast and reliable services.
- **Online Table Reservations**: Through Zomato Book, users can book tables at participating restaurants and get access to special offers.
- **Zomato Pro (formerly Zomato Gold)**: A subscription-based service that offers users discounts and exclusive deals at partner restaurants and bars.
- **Zomato for Business**: A platform for restaurant owners to manage their profiles, engage with customers, and analyze performance metrics.
### 2. **Key Milestones**:
- **2008**: Zomato is founded as *Foodiebay* by Deepinder Goyal and Pankaj Chaddah.
- **2010**: The company rebrands as Zomato and starts expanding beyond India, first into the UAE and then globally.
- **2014**: Zomato expands to over 10 countries and raises significant funding.
- **2017**: Zomato acquires the US-based food discovery platform *Urbanspoon* to strengthen its position in North America and Australia.
- **2018**: Zomato enters the food delivery space with the acquisition of *Tapzo* and later raises funding to expand its delivery business.
- **2020**: Zomato goes public through an IPO and lists on the Indian stock market.
### 3. **Financials**:
- **Revenue**: Zomato generates revenue through food delivery commissions, restaurant advertising, and premium subscription services (Zomato Pro). It reported strong revenue growth in recent years, although profitability remains a challenge in a competitive market.
- **Funding**: Zomato has raised over $2 billion in funding from various investors, including Alibaba’s Ant Financial, Sequoia Capital, and Tiger Global Management.
- **IPO**: In July 2021, Zomato went public with its Initial Public Offering (IPO) and listed on the Bombay Stock Exchange, marking a significant milestone for the company.
### 4. **Technology & Innovations**:
- Zomato leverages data analytics and artificial intelligence to provide personalized food recommendations and improve customer service.
- It uses machine learning algorithms to optimize delivery routes, ensuring timely and efficient food delivery.
- The company has also implemented contactless delivery features, which became important during the COVID-19 pandemic.
### 5. **Competitors**:
Zomato operates in a highly competitive market, and its major competitors include:
- **Swiggy**: One of Zomato's biggest rivals in India in the food delivery space.
- **Uber Eats**: Although Uber Eats exited India, it was once a significant competitor in the market.
- **Domino’s**: A major player in the food delivery business, particularly in pizza.
### 6. **Challenges**:
- **Profitability**: Despite its market leadership, Zomato has struggled with profitability due to high operational costs and intense competition.
- **Logistics & Delivery Costs**: Ensuring a fast, efficient, and cost-effective delivery network has been a constant challenge for Zomato.
- **Regulatory Issues**: As with many companies in the tech and food delivery sector, Zomato faces regulatory scrutiny, especially regarding the gig economy and labor laws.
### 7. **Corporate Culture & Leadership**:
- Zomato is known for its young, dynamic, and fast-paced corporate culture, attracting top talent from across the tech and food sectors.
- Deepinder Goyal, one of the co-founders, serves as the CEO and is actively involved in shaping the company's direction.
### 8. **Geographic Presence**:
Zomato operates in over 20 countries, with a strong presence in India, the Middle East, Southeast Asia, and Australia. It has also made inroads into markets like the US, UK, and Canada.
### 9. **Recent Developments**:
- **Expansion into New Markets**: Zomato continues to explore international growth opportunities, with a focus on markets in Southeast Asia and Europe.
- **Mergers and Acquisitions**: Zomato has been consolidating its position through strategic acquisitions, such as the buyout of *Wiggy* and *Uber Eats India* in 2020.
- **Sustainability Initiatives**: Zomato has made commitments to sustainability, including initiatives to reduce food waste and carbon emissions in its operations.
### 10. **Corporate Social Responsibility (CSR)**:
Zomato has also been involved in several social initiatives, including:
- **Zomato Feeding India**: A non-profit initiative focused on feeding the hungry and addressing food wastage.
- **Sustainable Practices**: Zomato has introduced features like eco-friendly packaging and supports restaurants that use sustainable sourcing practices.
### 11. **Future Outlook**:
Zomato is poised for further growth, especially in the areas of food delivery, cloud kitchens, and restaurant technology. The company is expected to focus on improving its unit economics and scaling its business in a competitive landscape.
Let me know if you'd like more specific information on any of the sections!

IRCTC falling wedge pattern price near supportIRCTC has formed a falling wedge pattern.
Price trading near support zone.
Pattern base range target and Stop loss plotted on chart.
Volume also dried, showing selling is minimal.
Disclaimer : chart share here is education purpose only. not buy and sell recommendation give on stock.

OFSS Stock of the Week.NSE:OFSS is at a perfect level for a Short Downside Swing as per the price action on daily charts. Although the RSI is in an Oversold Zone it may give a dead cat bounce.
F&O Activity:
11,000 Looks like a Big Resistance With Major Long's being Covered.
Trade Setup:
It can be a Good 1:1 RISK-REWARD Trade for Aggressive Swing Trader if the Level is Breached.
Target(Take Profit):
8866.65 Levels for Swing Trade.
Stop-Loss:
11187.65 Levels for Swing Trade.
📌Thank you for exploring my idea! I hope you found it valuable.
🙏FLLOW for more
👍BOOST if useful
✍️COMMENT Below your views.
Meanwhile, check out my other stock ideas below until this trade is activated. I would love your feedback.
Disclaimer: This analysis is intended solely for informational and educational purposes and should not be interpreted as financial advice. It is advisable to consult a qualified financial advisor or conduct thorough research before making investment decisions.

Wipro: Resilient Recovery Back Into the Ascending ChannelWipro has shown impressive strength recently, bouncing back into its well-established ascending channel on the daily chart. Here are the key observations:
Channel Recovery:
After briefly dipping below the channel on January 17, the stock quickly recovered and closed back within the channel the very next day, demonstrating strong buying interest at lower levels.
Current Momentum:
The stock is trading near the upper half of the channel, indicating bullish momentum.
The breakout attempts suggest that buyers are dominating at current levels.
Support and Resistance:
The lower boundary of the channel around ₹290 acts as strong support.
Immediate resistance is seen at ₹320, near the upper edge of the channel. A breakout above this level could lead to further gains.
Indicators:
The RSI is trending upwards and is currently above the neutral zone, supporting the bullish outlook.
A sustained move above ₹320 could push the RSI into overbought territory, requiring cautious optimism.

Reliance Industries: Key Levels to Watch Amid Channel Breakdown Reliance Industries (RIL) is currently trading within a critical zone that could determine its short- to medium-term direction. Here's a breakdown of the key observations:
Ascending Channel Breakdown Risk:
The stock has been respecting an ascending channel on the weekly chart. However, it is now testing the lower boundary of this channel, indicating potential weakness.
Support Levels:
Immediate support is seen at ₹1,200, which aligns with historical consolidation.
A breakdown below ₹1,200 could open the doors to ₹1,100, which is the next significant support.
Resistance Levels:
On the upside, ₹1,325 is a critical resistance level.
A breakout above ₹1,325 may lead to a rally toward ₹1,500, which is the next target based on historical price action and the upper range of the channel.
Likely Consolidation:
The stock might hover within the ₹1,200–₹1,325 range for a few weeks, allowing the market to decide its next direction.
Indicators:
The RSI on the weekly chart shows signs of a potential reversal but remains in a neutral zone, indicating indecision.

Double Bottom-Exide IndustriesDouble Bottom &
No Sellers below the mark level
Exide Industries Ltd is primarily engaged in the
manufacturing of storage batteries and allied products in India.

Axis Bank Time to Buy at Demand Zone**Axis Bank** is one of the largest private sector banks in India, known for its wide range of financial services. Here’s a brief profile:
- **Founded**: 1993
- **Headquarters**: Mumbai, Maharashtra, India
- **CEO**: Amitabh Chaudhry (as of 2025)
- **Branches and ATMs**: Over 4,600 branches and 11,000+ ATMs across India
- **Services**: Retail banking, corporate banking, investment banking, asset management, insurance, loans, and credit cards
- **Key Subsidiaries**:
- Axis Mutual Fund
- Axis Capital Ltd.
- Axis Securities Ltd.
- Axis Finance Ltd.
- **Market Position**: Among the top private sector banks in India with a strong customer base and a significant presence in both urban and rural areas.
Axis Bank is recognized for its innovative banking solutions, digital services, and customer-centric approach. It has consistently been involved in various community and social responsibility initiatives.

AEROFLEX Breakout Retest - Looking goodDate : 15-12-2024
-------------------------------------
Breakout Retest (PICK RESEARCH TO OBSERVE)
AEROFLEX Looks Good Above 239
SL 172
Target 252, 265,291, 343++
Hold Period : Few Weeks to Months
Reason for Pick : Breakout, Above 20, 50, 200 SMA
Please consult your financial advisor before investing
All research for educational purposes only.

Positional Trade with 50% + Expected GainRounding Bottom & Breakout with Volume
BBTC LTP 2232
Weakness : incase if it breaks & Sustains below 2070
Add on Dips till 1900
SL CLB @ 1700
Strength 💪 : when it'll sustain above 2410
Possible Targets 🎯 : 2280/2480/2580/2680/2880/2980/3080
TSL MUST to Maximize your Profit's
Even from LTP 2232 if it goes till 3080 -->> its 38% Gain
if you like this Idea 💡 - Don't forget to Like / Boost 🚀it
For more info - Plz visit my Profile & Follow me
Rgds,
Naresh G
Sebi Reg.RA
